
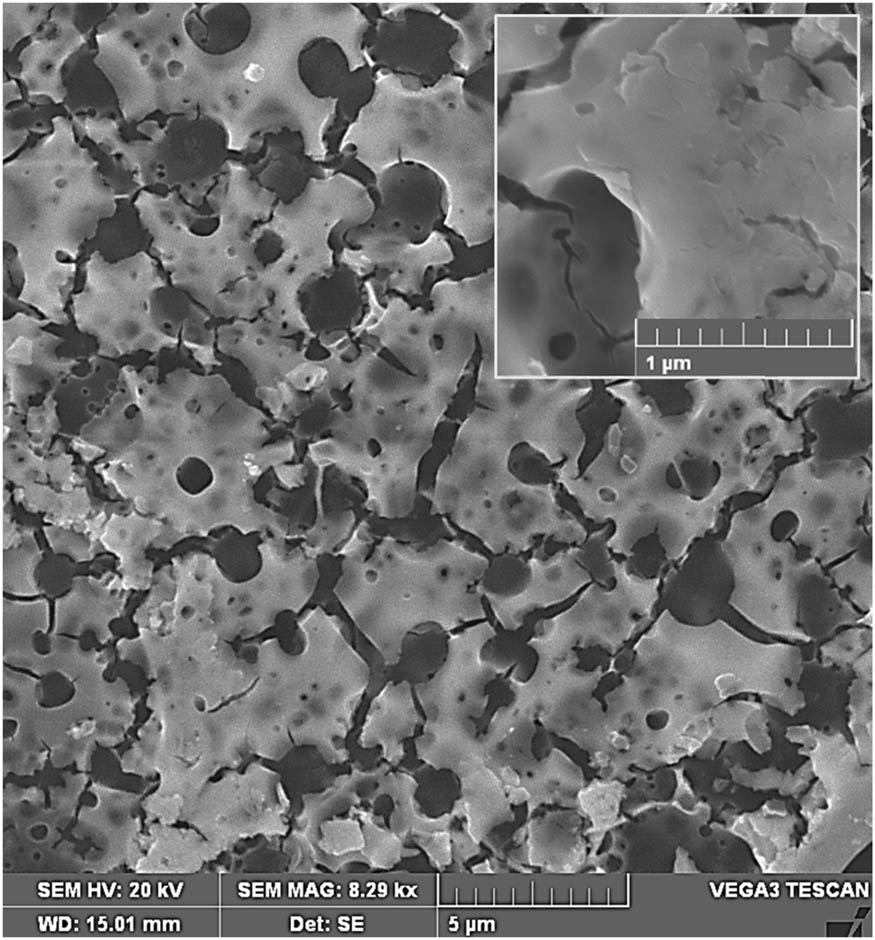
Figure 1
SEM micrograph of the annealed CdWO4 film. Inset is an image with greater resolution.
Table 1
EDX quantitative elemental analysis of the annealed film at 600°C.
| Spectral line | At% experimental/EDX | At% theoretical for CdWO4 |
|---|---|---|
| O K | 89.1 | 66.7 |
| Cd L | 4.2 | 16.7 |
| W M | 6.7 | 16.7 |
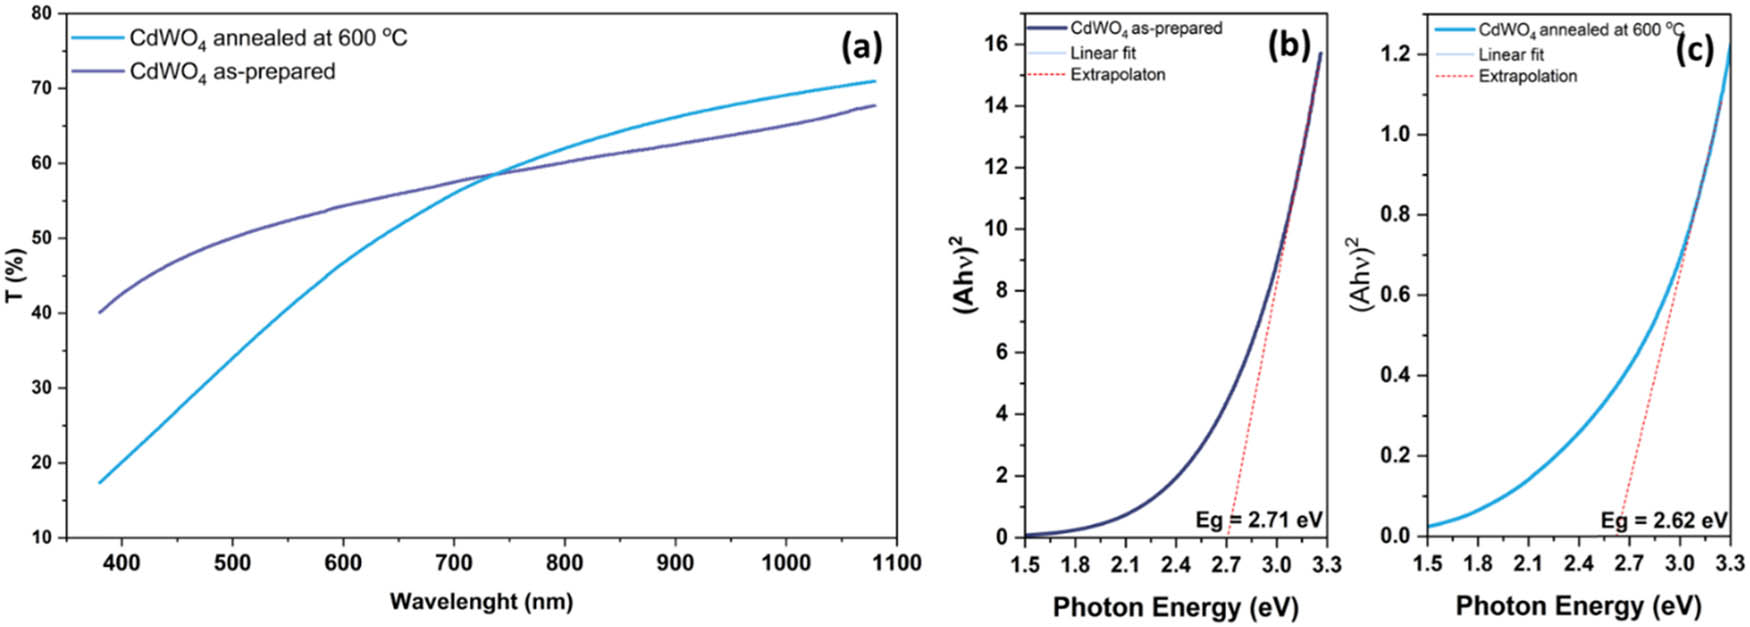
Figure 2
(a) Transmission spectra of CdWO4 films; Tauc plot of (b) as-prepared and (c) annealed at 600°C CdWO4 films.
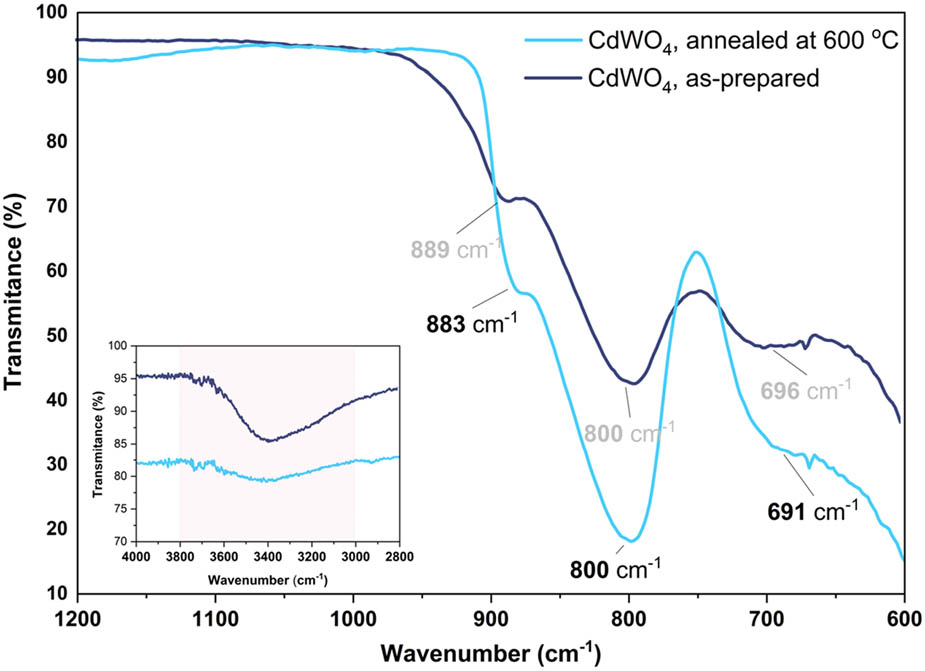
Figure 3
ATR-FTIR spectra of CdWO4 films, as-prepared and annealed at 600°C.
Table 2
IR vibration modes of the unannealed and annealed CdWO4 films.
| IR, vibration mode –as-prepared CdWO4 film (cm−1) | IR, vibration mode –CdWO4 film annealed at 600°C (cm−1) | Reference [23] (cm−1) |
|---|---|---|
| 887, ν 1 | 881, ν 1 | 885, 835, and 700 |
| 797, ν 3 | 802, ν 3 | 796 |
| 696, (weak), ν 1 | 687, (shoulder), ν 1 | 795 |
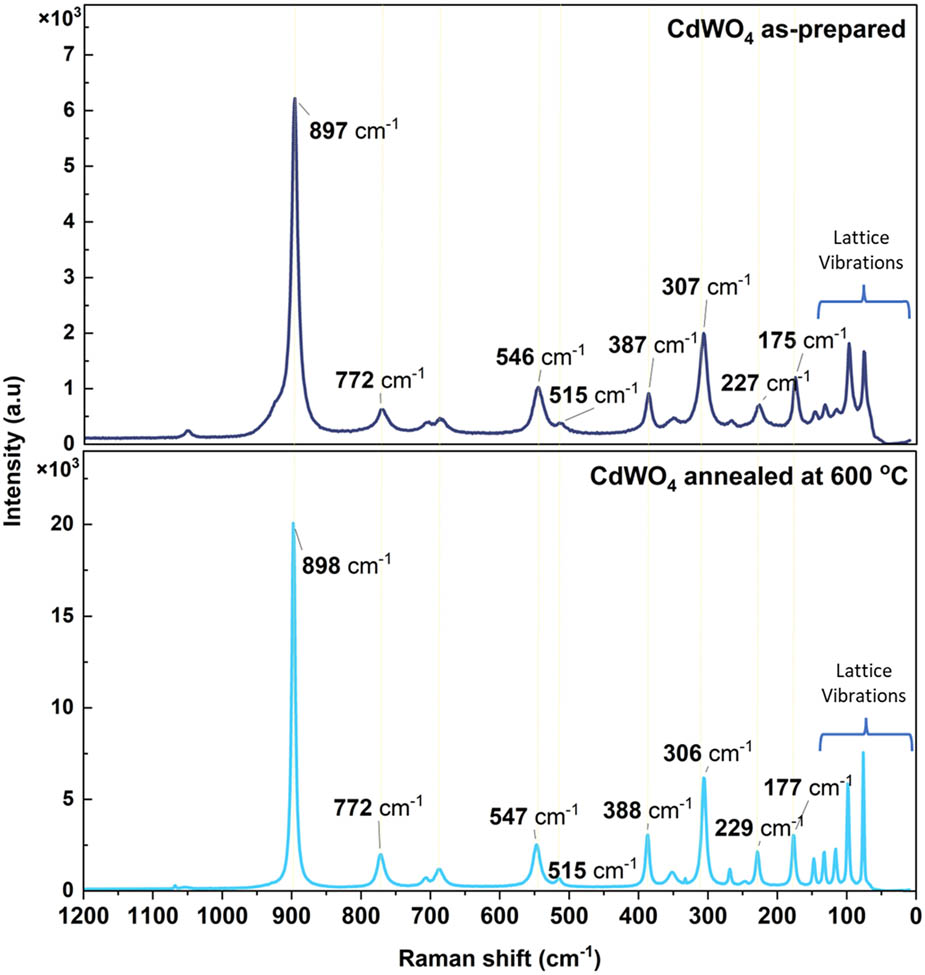
Figure 4
Raman spectra of CdWO4 thin films, as-prepared and annealed at 600°C.
Table 3
Raman vibrations of the unannealed and annealed CdWO4 films.
| Raman shift, vibration mode – as-prepared CdWO4 film (cm−1) | Raman shift, vibration mode – CdWO4 film annealed at 600°C (cm−1) | Reference [22] (cm−1) |
|---|---|---|
| 898, ν 1 | 897, ν 1 | 900 |
| 546, 387, and 307, ν 2 | 547, 388, and 306, ν 2 | 550, 390, and 308 |
| 772, ν 3 | 772, ν 3 | 776 |
| 515, ν 4 | 515, ν 4 | 522 |
| 145, 132, 114, 98, and 75, lattice vibr. | 147, 133, 116, 97, and 77, lattice vibr. |
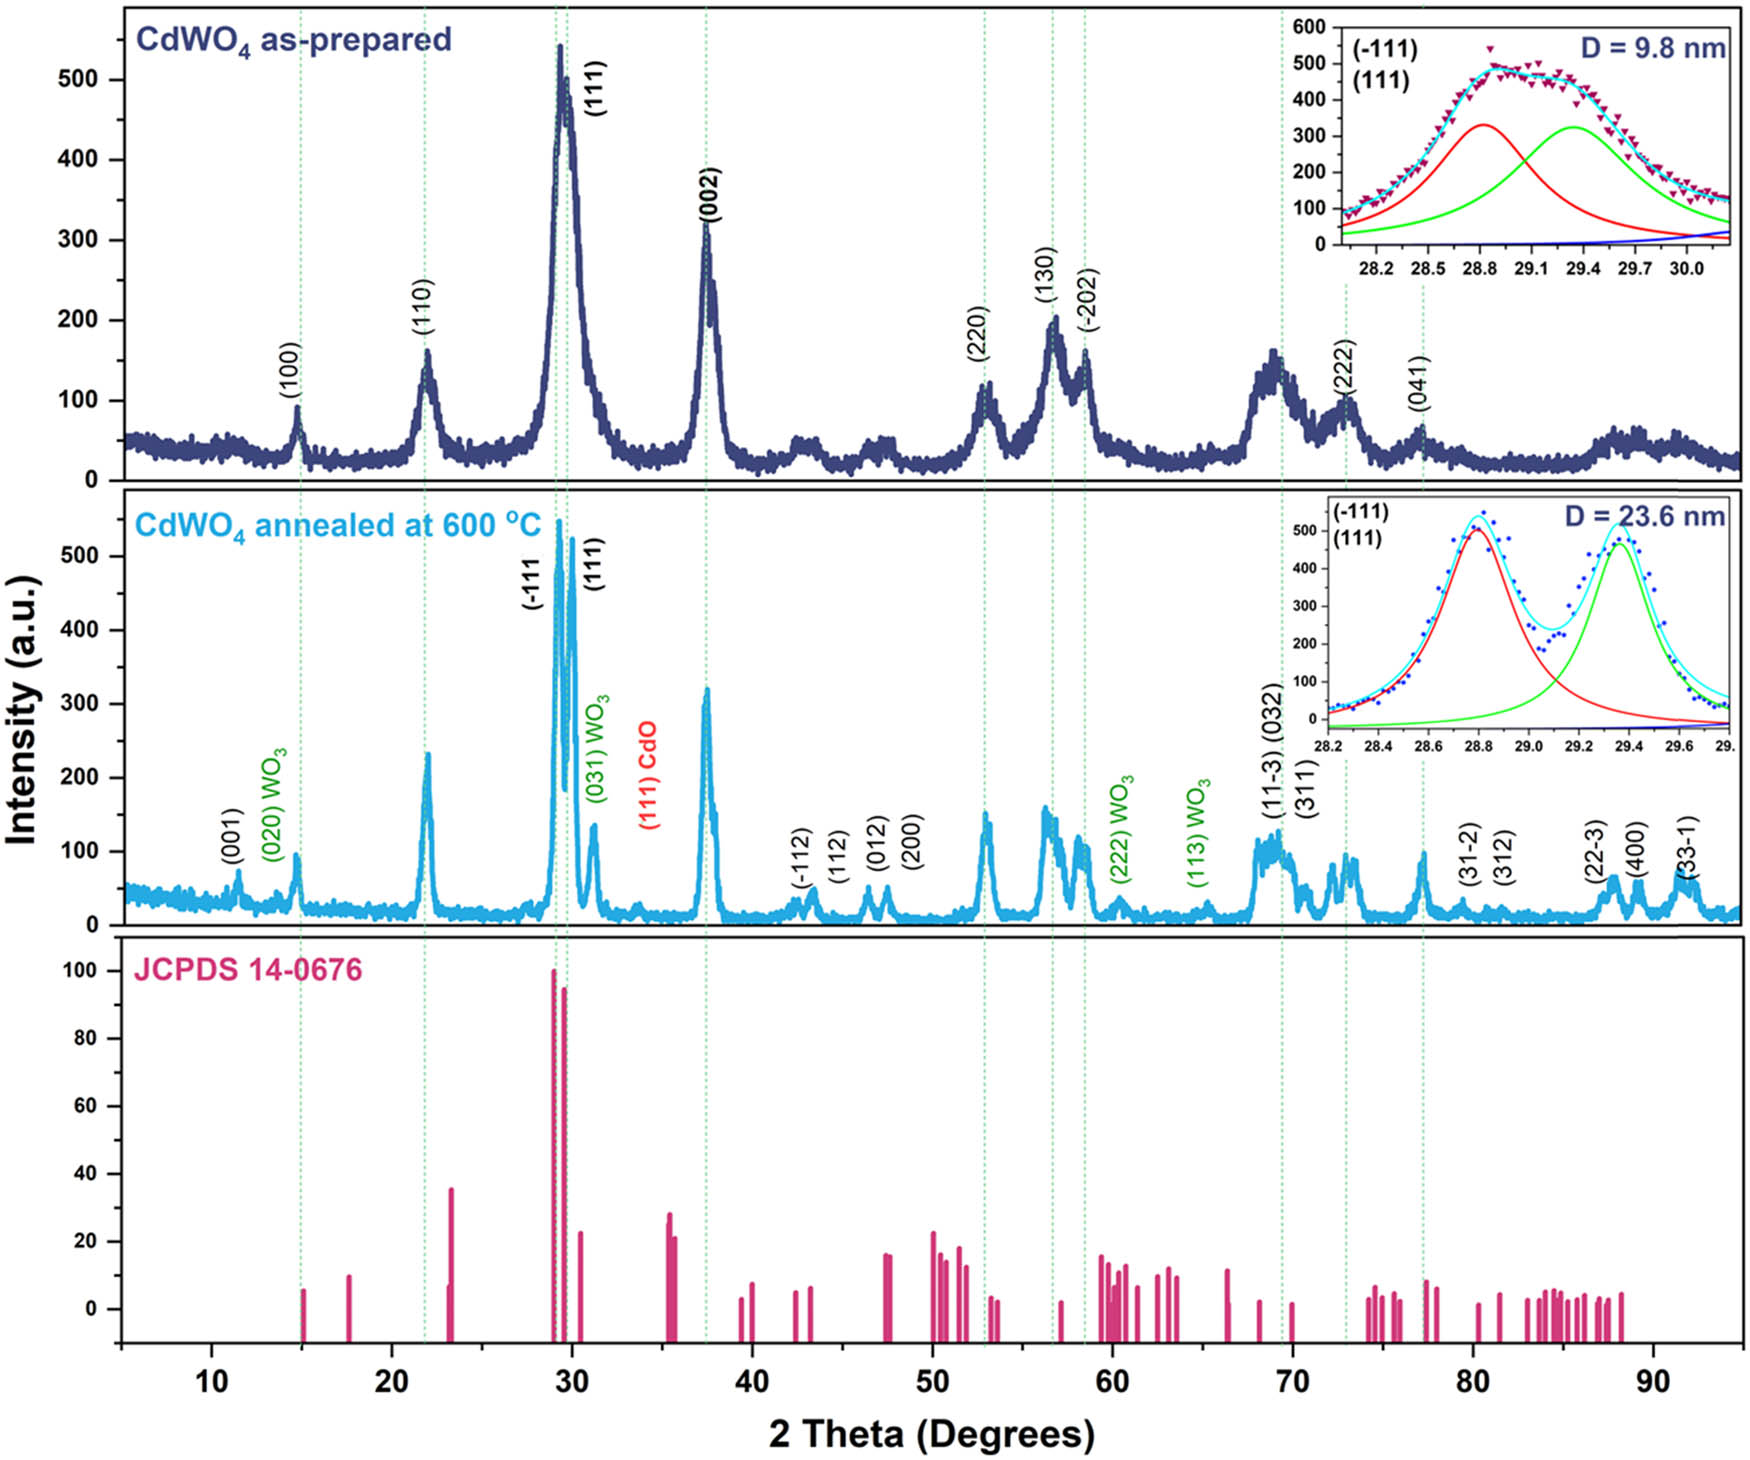
Figure 5
X-ray diffractogram of CdWO4 thin films: as-prepared and annealed at 600°C, along with the JCPDS 14-0676 standard reference file. Multi-peak deconvolution of diffraction maxima (−1, 1, 1) and (1, 1, 1) to evaluate the FWHM of (1, 1, 1) at a 2θ angle 29.35°, to calculate the crystallite size (D) (insets).
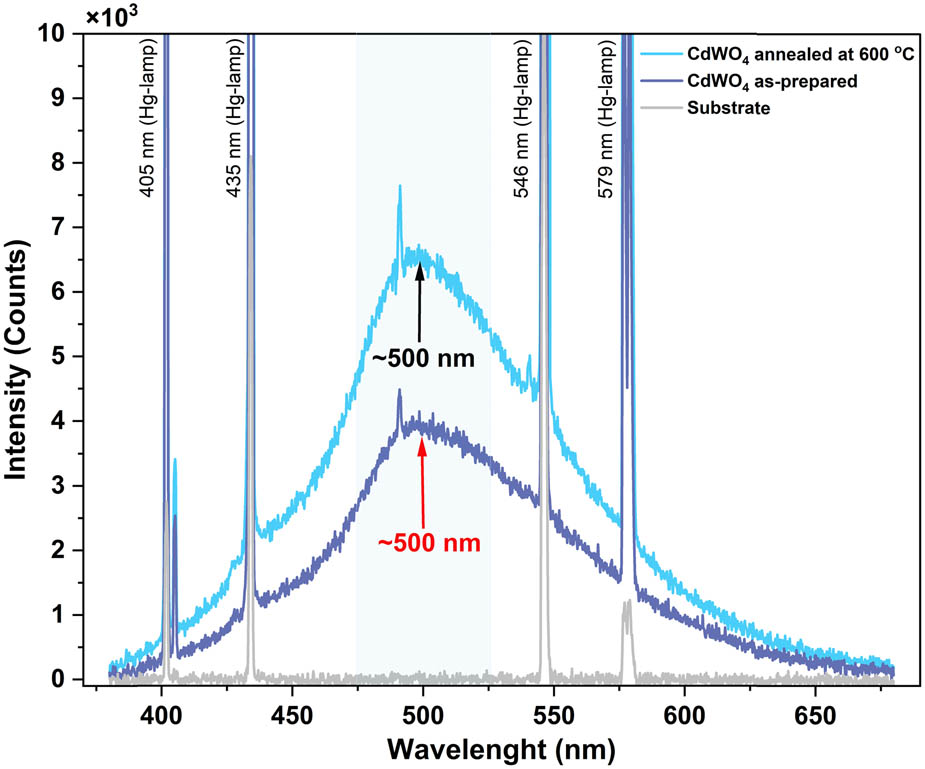
Figure 6
PL along with the reflectance spectrum of CdWO4 thin films (excitation: 254 nm with a Hg lamp). The grey spectrum was recorded from a blank substrate (glass slide) under Hg lamp illumination.
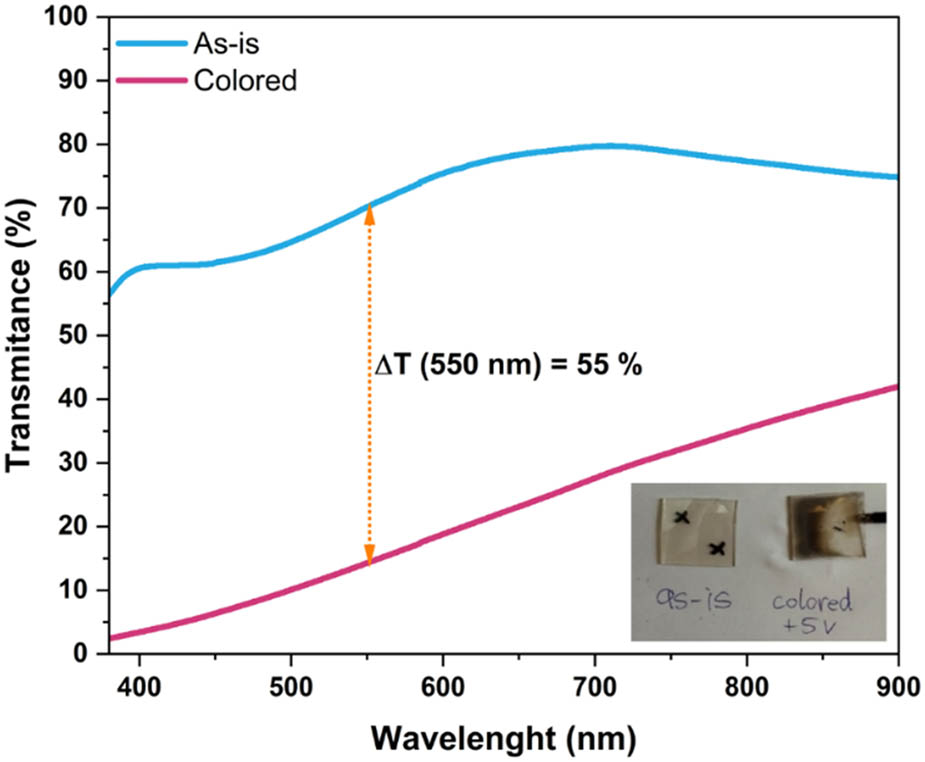
Figure 7
Transmission spectra of the as-is and coloured CdWO4 films.