
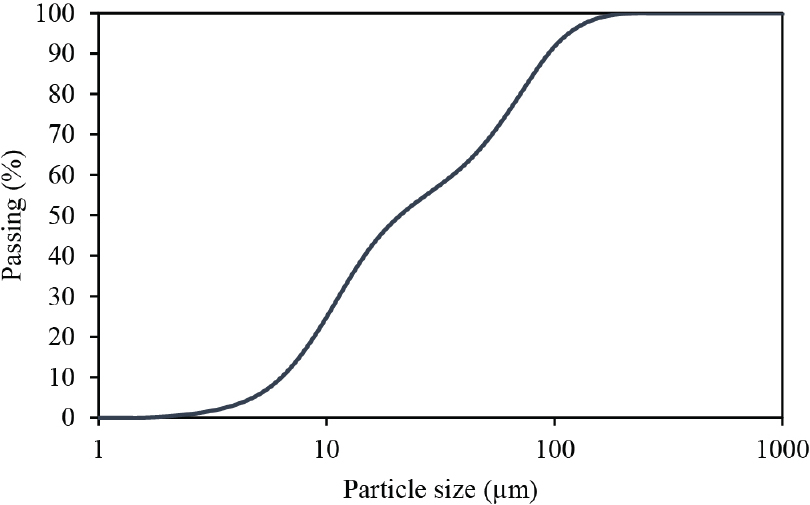
Fig. 1.
The MK particle size used in this study
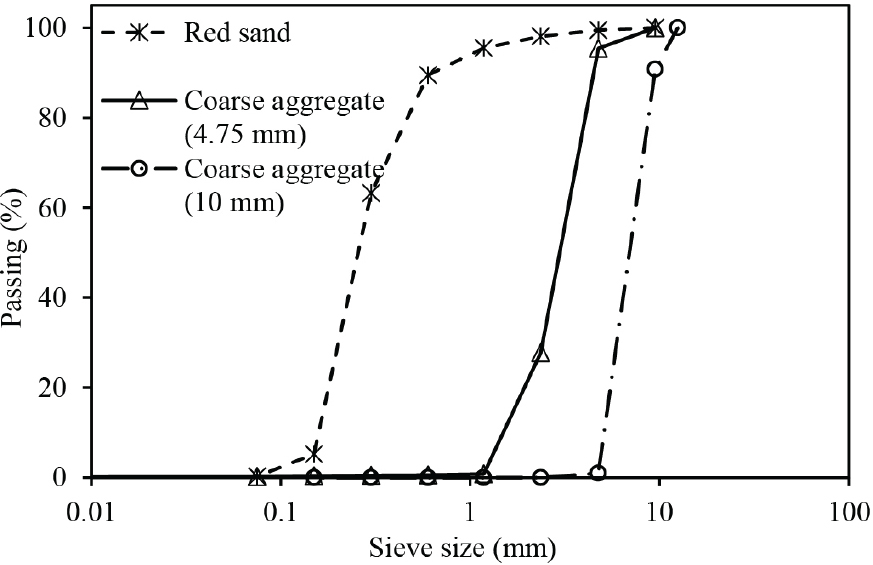
Fig. 2.
Sieve analysis of the fine and coarse aggregates
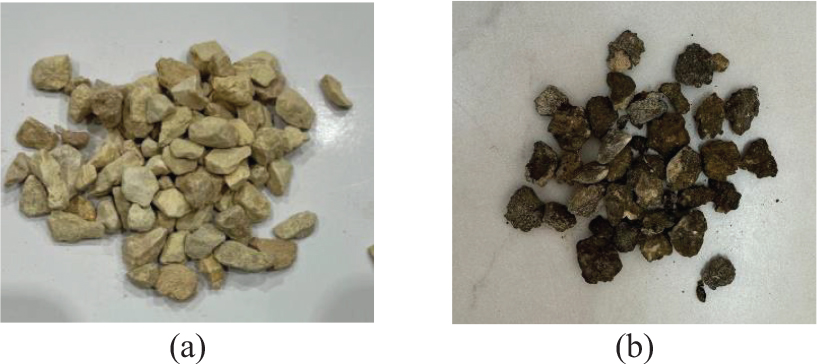
Fig. 3.
Samples of the coarse aggregates used in this study. (a) Limestone aggregate. (b) RAP aggregate
Table 1.
Chemical analysis of MK (% weight)
| Composition | SiO2 | Fe2O3 | Al2O3 | Na2O | CaO | SO3 | TiO2 | K2O | MgO | P2O5 | Others |
|---|---|---|---|---|---|---|---|---|---|---|---|
| Value (%) | 50.995 | 2.114 | 42.631 | 0.284 | 1.287 | 0.439 | 1.713 | 0.337 | 0.127 | 0.051 | 0.022 |
Table 2.
Properties of the CFRP sheet and epoxy adhesive
| Material | Property | Value | Notes |
|---|---|---|---|
| CFRP sheet | Thickness | 0.6 mm | Experimental values |
| Ultimate tensile strength | 1122 MPa | ||
| Ultimate tensile strain | 1.7% | ||
| Tensile modulus of elasticity | 68.9 GPa | ||
| Epoxy adhesive | Tensile strength | 71.5 MPa | Given by the manufacturer |
| Tensile strain at break | %5.25 | ||
| Tensile modulus of elasticity | 1.86 GPa |
Table 3.
Properties of the CFRP sheet and epoxy adhesive
| Material | A0 mixture | A25 mixture | A50 mixture | |
|---|---|---|---|---|
| MK | 350 | 350 | 350 | |
| Alkaline solutions | NaOH | 110.04 | 110.04 | 110.04 |
| Na2SiO3 | 196.98 | 196.98 | 196.98 | |
| Water | 5.74 | 5.74 | 5.74 | |
| Fine aggregate | White sand | 419 | 419 | 419 |
| Crushed limestone | 180 | 180 | 180 | |
| Coarse aggregate | Limestone | 1,272 | 954 | 636 |
| RAP | 0 | 334.9 | 669.7 | |
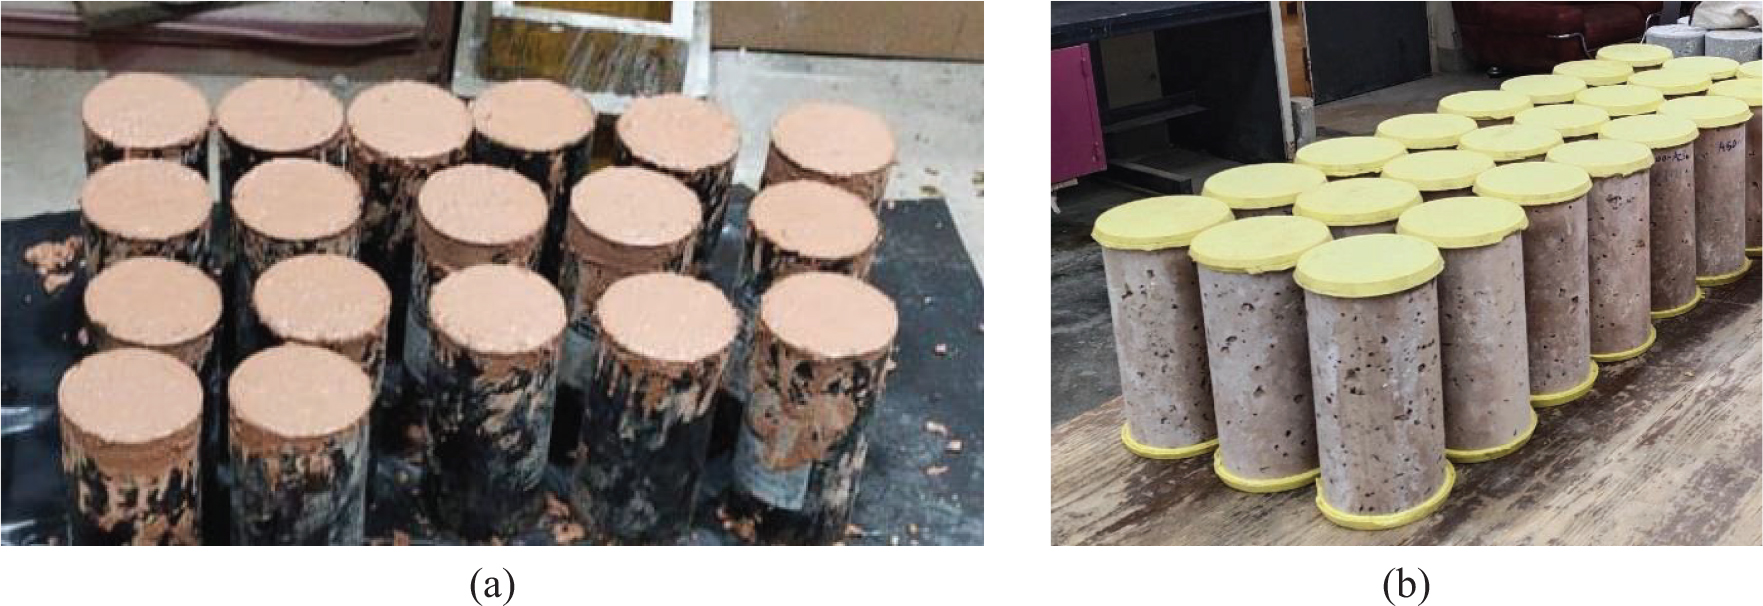
Fig. 4.
Specimen preparation. (a) Cylinders during casting. (b) Cylinders ready for testing
Table 4.
Test matrix
| Group | Concrete mixture | Specimens ID | RAP aggregate | Exposure to temperature | Strengthening | No. of specimens |
|---|---|---|---|---|---|---|
| Group “1” | A0 | A0-R | 0% | 26°C | – | 3 |
| A0-300 | 300° C | 3 | ||||
| A0-S-R | 26°C | CFRP | 3 | |||
| A0-S-300 | 300°C | 3 | ||||
| Group “2” | A25 | A25-R | 25% | 26°C | – | 3 |
| A25-300 | 300°C | 3 | ||||
| A25-S-R | 26°C | CFRP | 3 | |||
| A25-S-300 | 300°C | 3 | ||||
| Group “3” | A50 | A50-R | 50% | 26°C | – | 3 |
| A50-300 | 300°C | 3 | ||||
| A50-S-R | 26°C | CFRP | 3 | |||
| A50-S-300 | 300°C | 3 | ||||
| Total no. of specimens | 36 | |||||
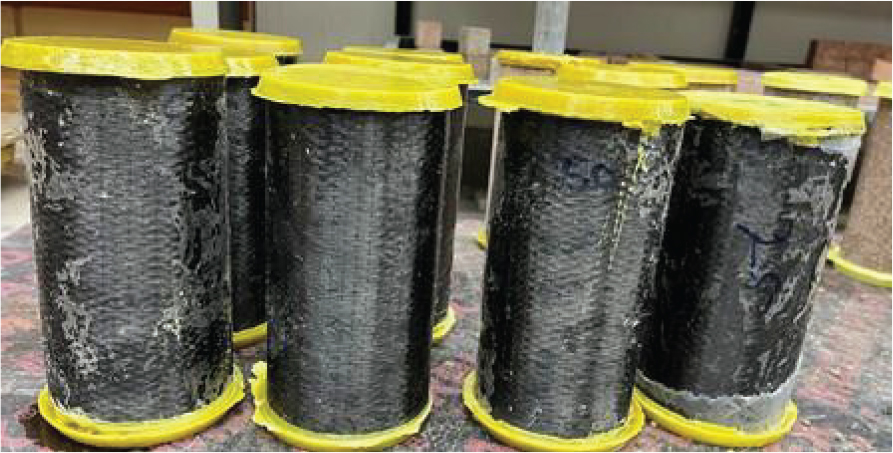
Fig. 5.
The specimens strengthened by CFRP sheets
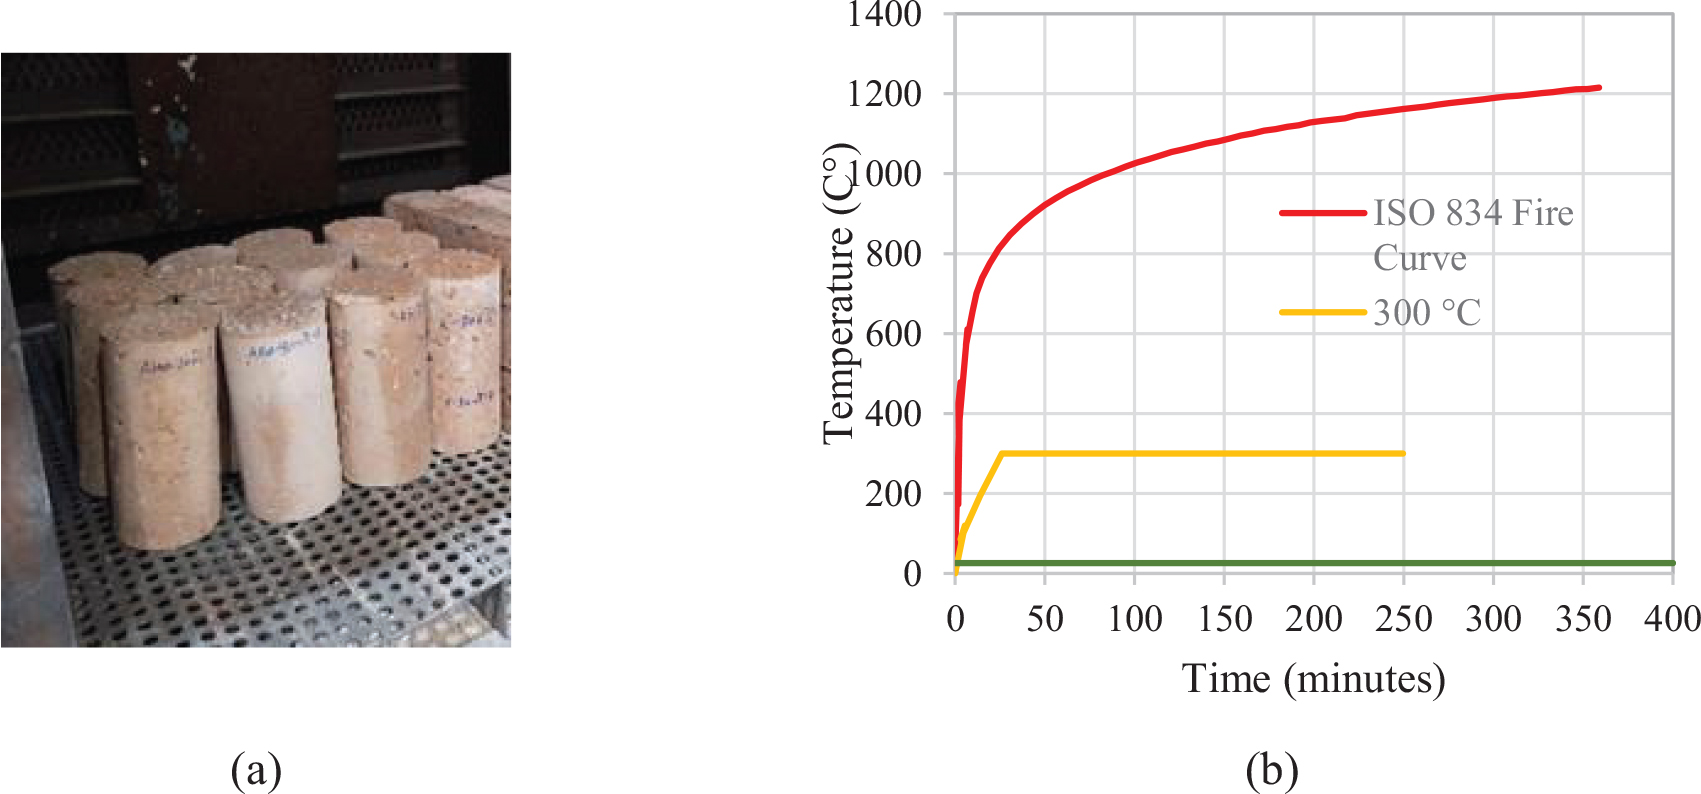
Fig. 6.
Specimen preparation. (a) Cylinders inside the oven. (b) Time-temperature curves
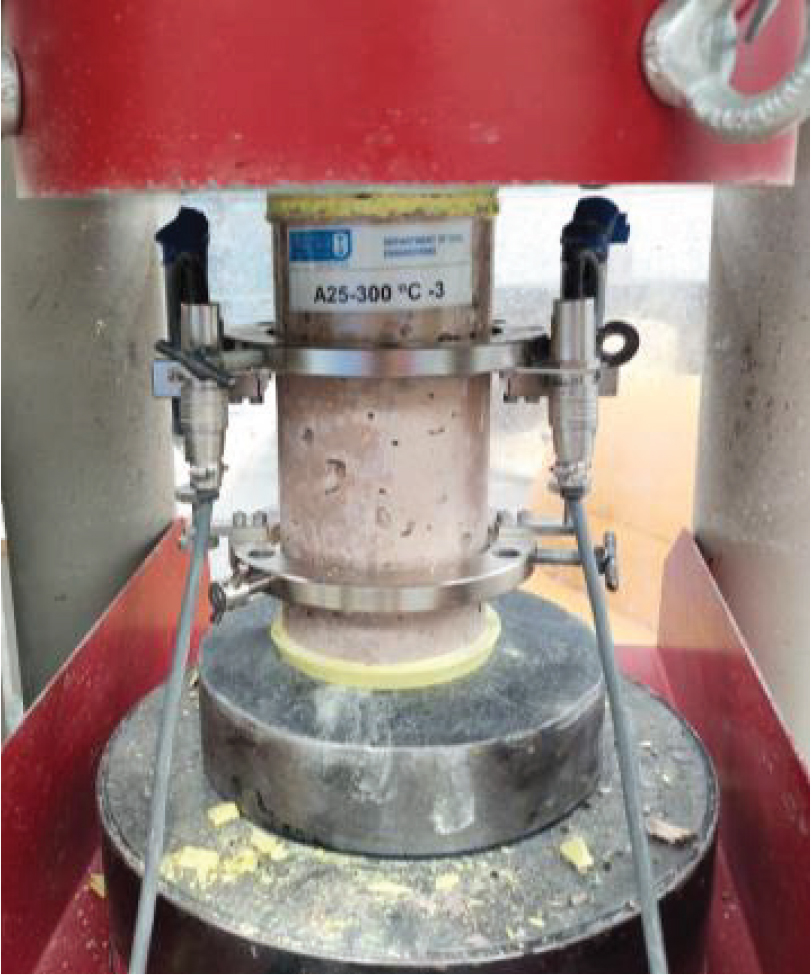
Fig. 7.
Test setup
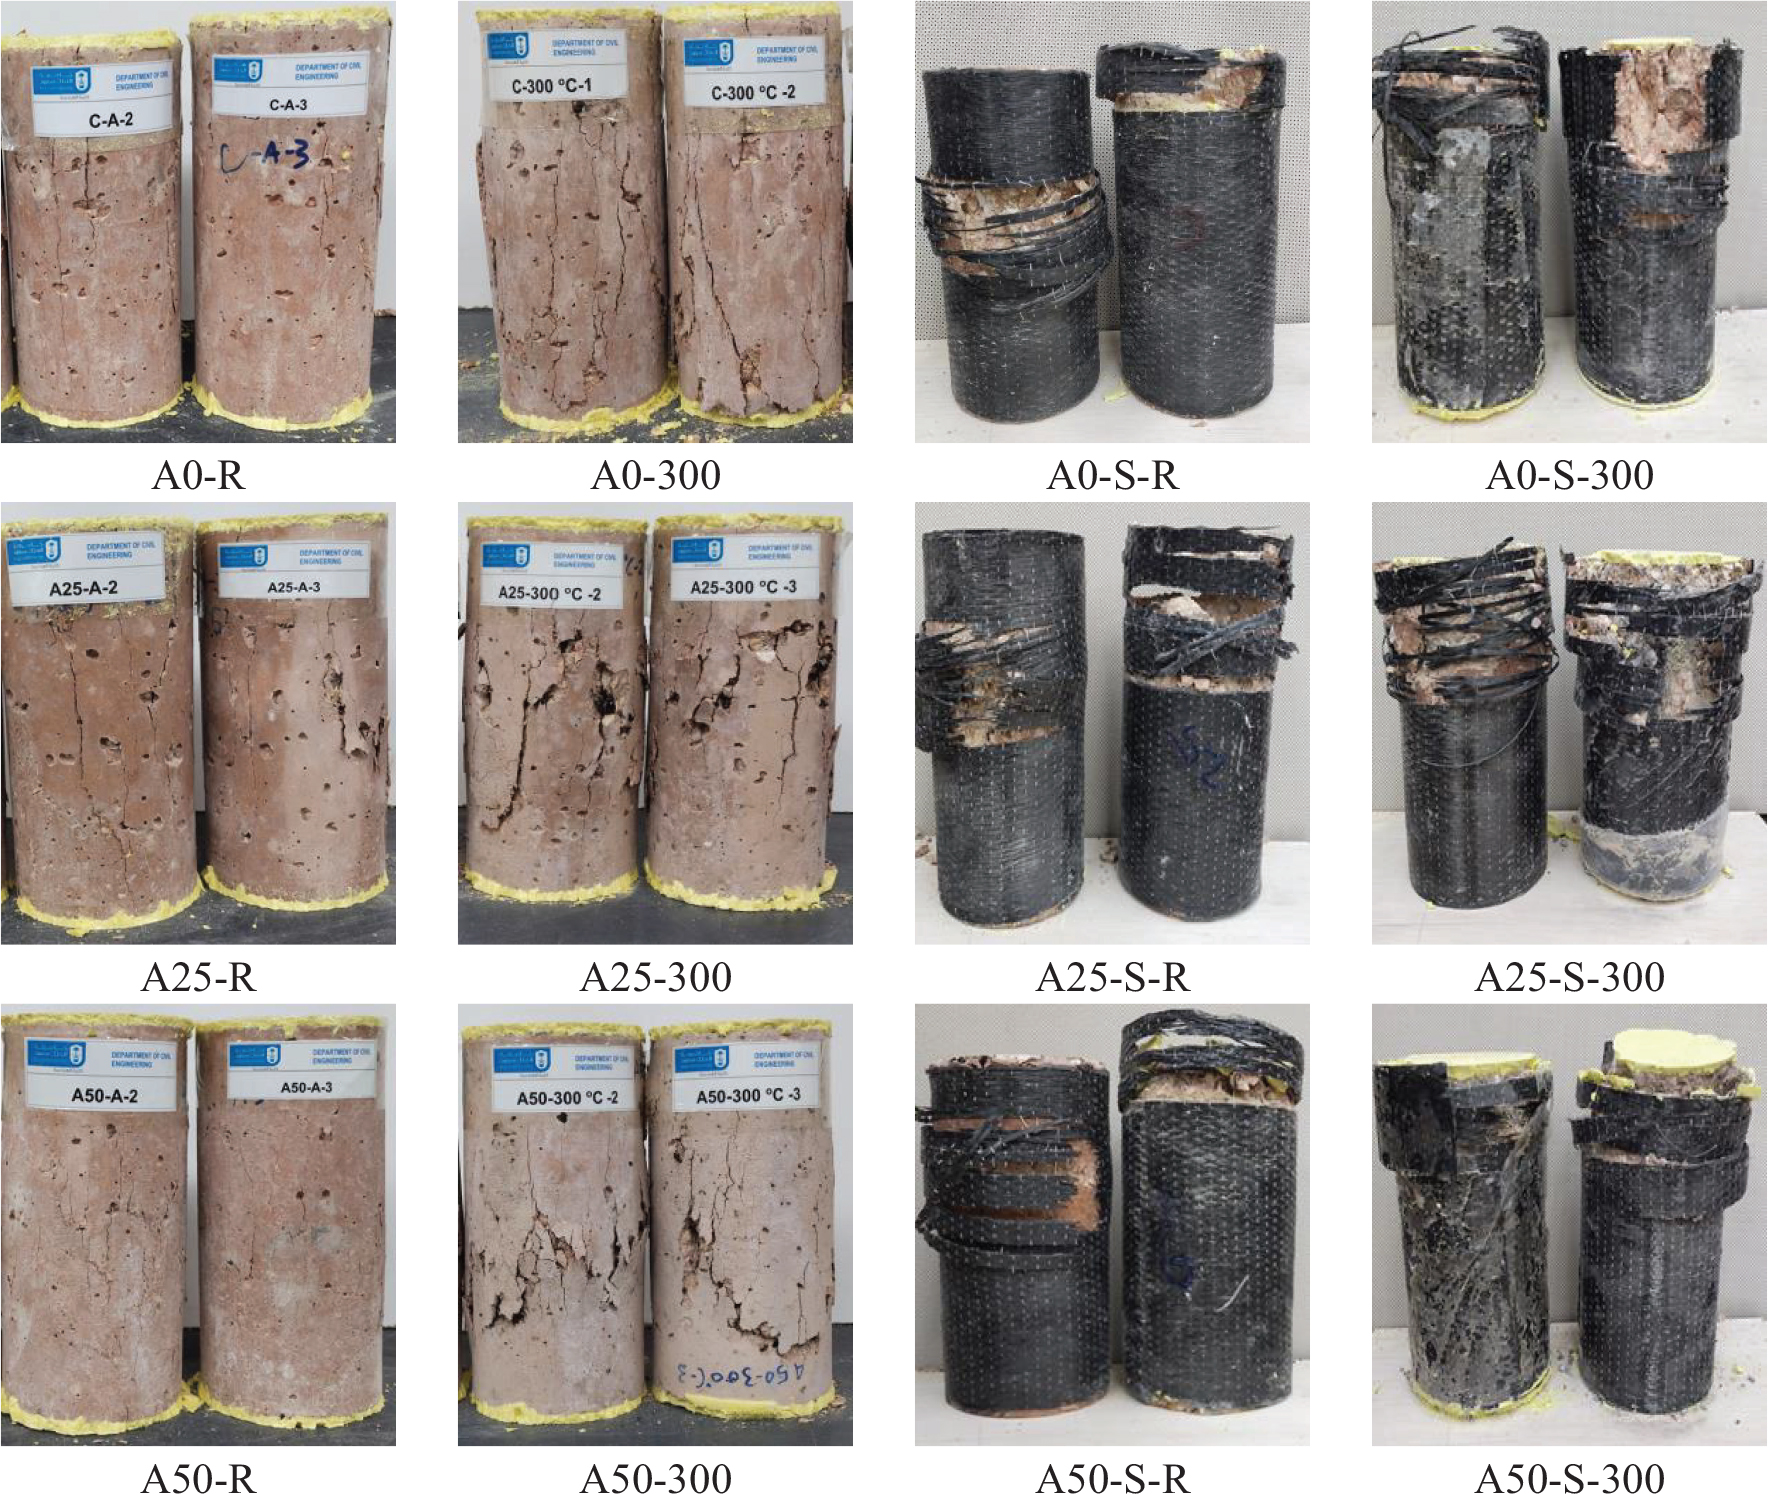
Fig. 8.
Failure mode for all specimens
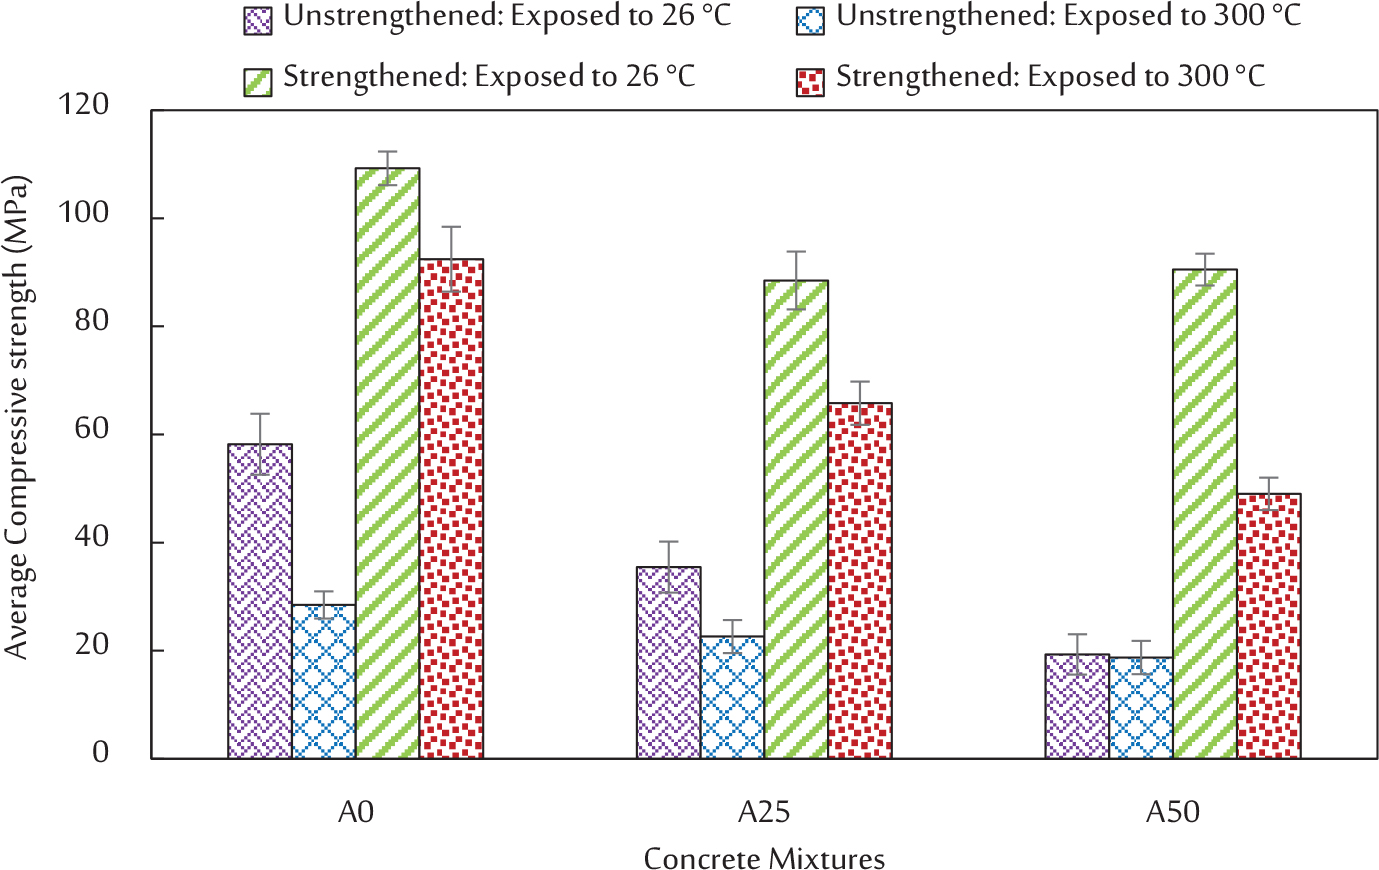
Fig. 9.
Compressive strength of all specimens
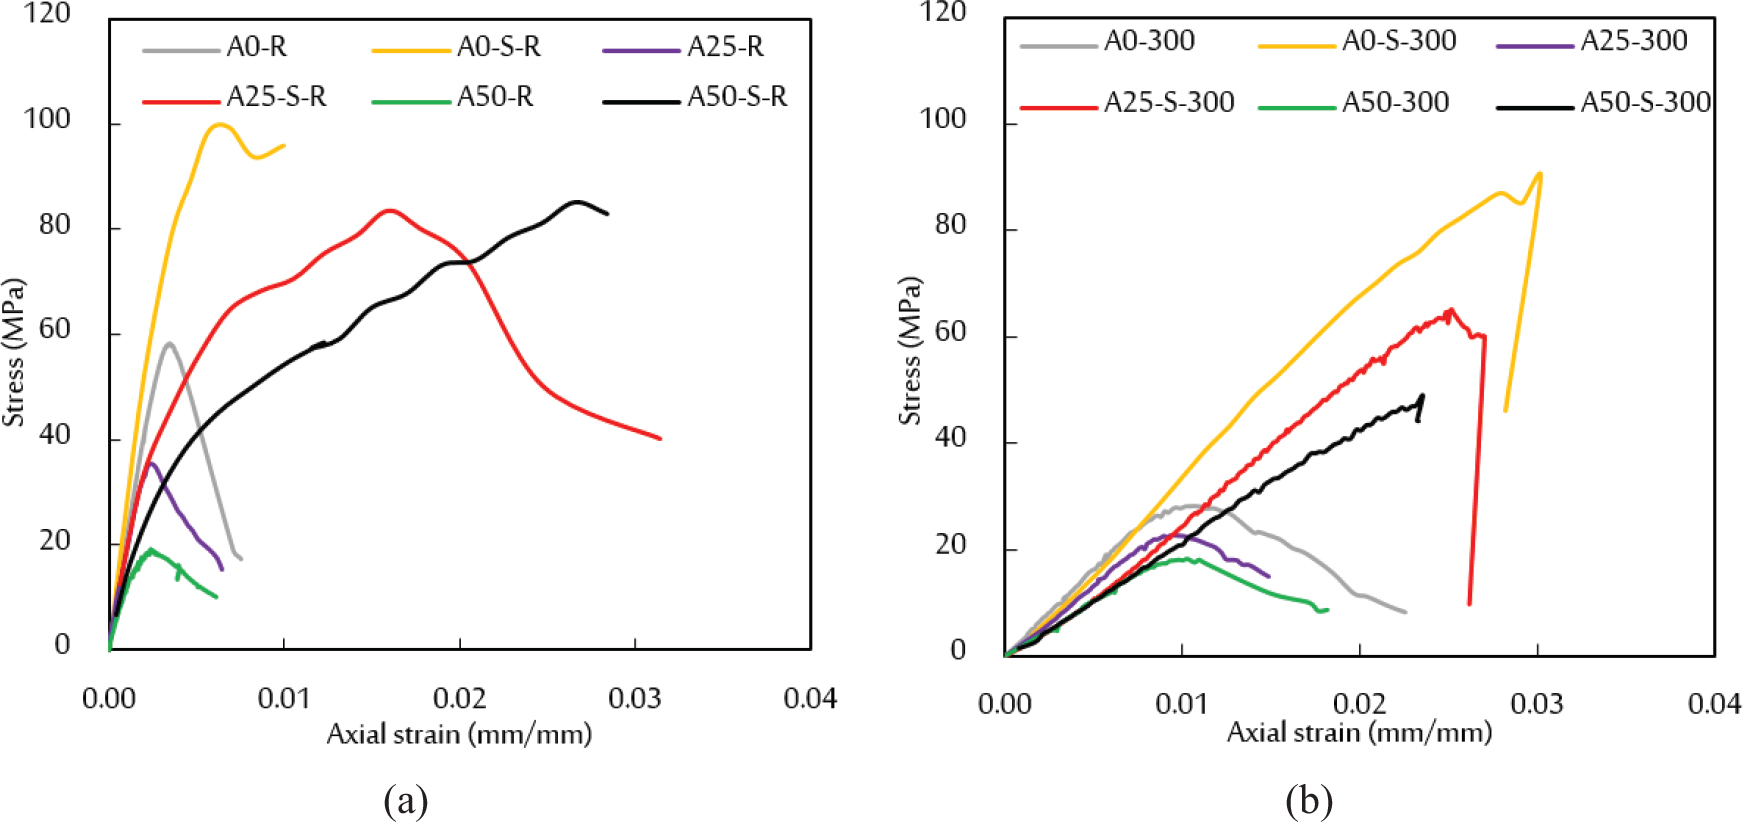
Fig. 10.
Stress-strain curves for all concrete cylinders. (a) Room temperature. (b) Heated at 300°C
Table 5.
Summary of the test results
| Specimen ID | Average compressive strength | COV | Initial stiffness | Toughness index | |||
|---|---|---|---|---|---|---|---|
| (MPa) | Relative variation * | (N/mm) | Relative variation * | % | Relative variation * | ||
| A0-R | 58.20 | – | 9.69 | 19562.6 | – | 1.55 | – |
| A0-300 | 28.46 | -51.1% | 12.98 | 3265.6 | -83.3% | 1.51 | -2.5% |
| A0-S-R | 109.24 | +87.7% | 4.29 | 26563.4 | +35.8% | 1.06 | -31.9% |
| A0-S-300 | 92.43 | +58.8% | 1.65 | 3409.2 | -82.6% | 1.01 | -34.8% |
| A25-R | 35.46 | – | 7.16 | 17900.7 | – | 1.73 | – |
| A25-300 | 22.61 | -36.2% | 13.62 | 2540.9 | -85.8% | 1.52 | -11.7% |
| A25-S-R | 88.50 | +149.6% | 3.43 | 16389.2 | -8.4% | 1.04 | -39.9% |
| A25-S-300 | 65.79 | +85.5% | 2.66 | 2501.5 | -86.0% | 1.01 | -41.3% |
| A50-R | 19.31 | – | 15.39 | 13431.9 | – | 2.00 | – |
| A50-300 | 18.73 | -3.0% | 15.27 | 2019.7 | -85.0% | 1.86 | -7.1% |
| A50-S-R | 90.51 | +368.8% | 5.90 | 9028.6 | -32.8% | 1.03 | -48.2% |
| A50-S-300 | 49.02 | +153.9% | 3.06 | 2152.2 | -84.0% | 1.02 | -49.0% |
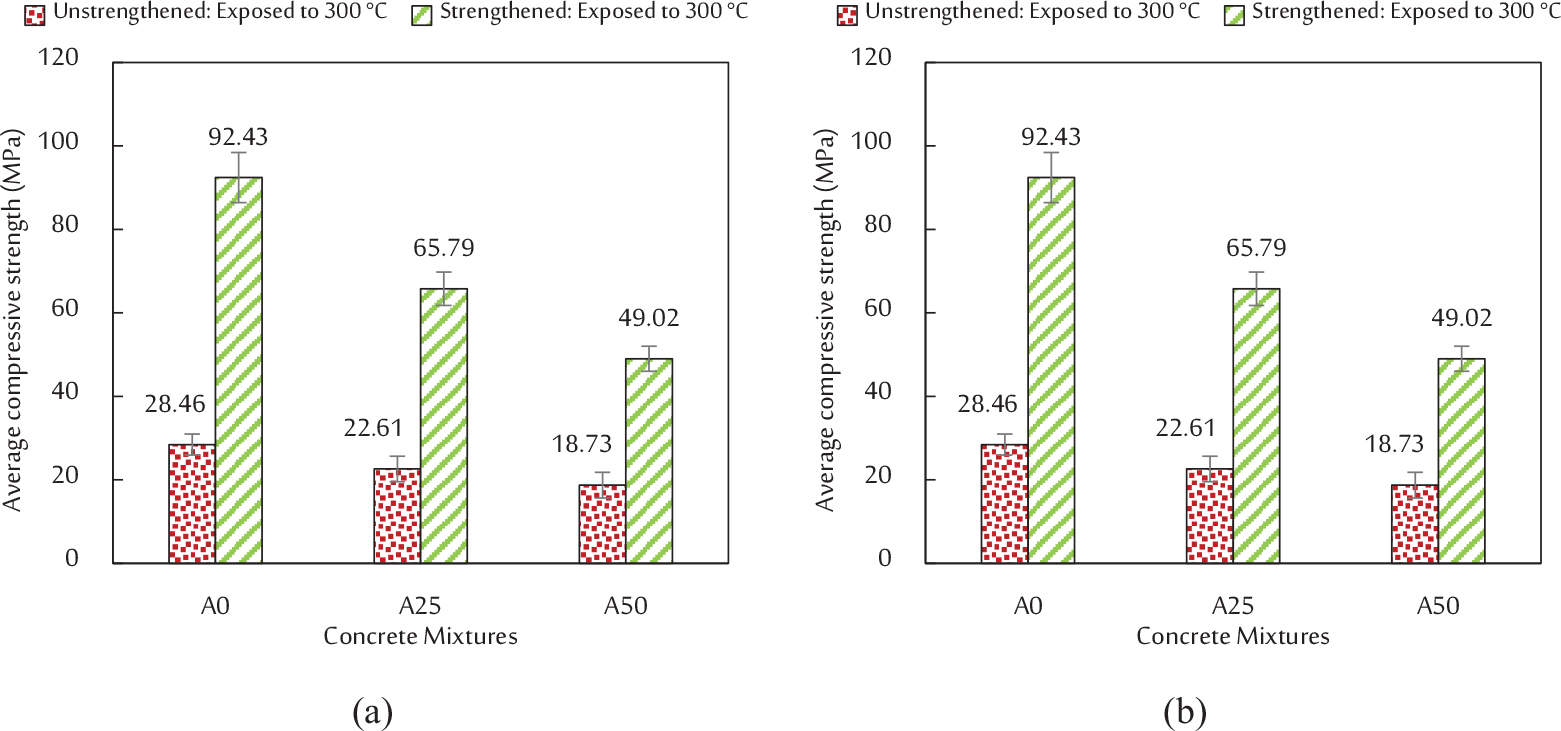
Fig. 11.
The effectiveness of CFRP strengthening. (a) Unheated specimens. (b) Heated specimens
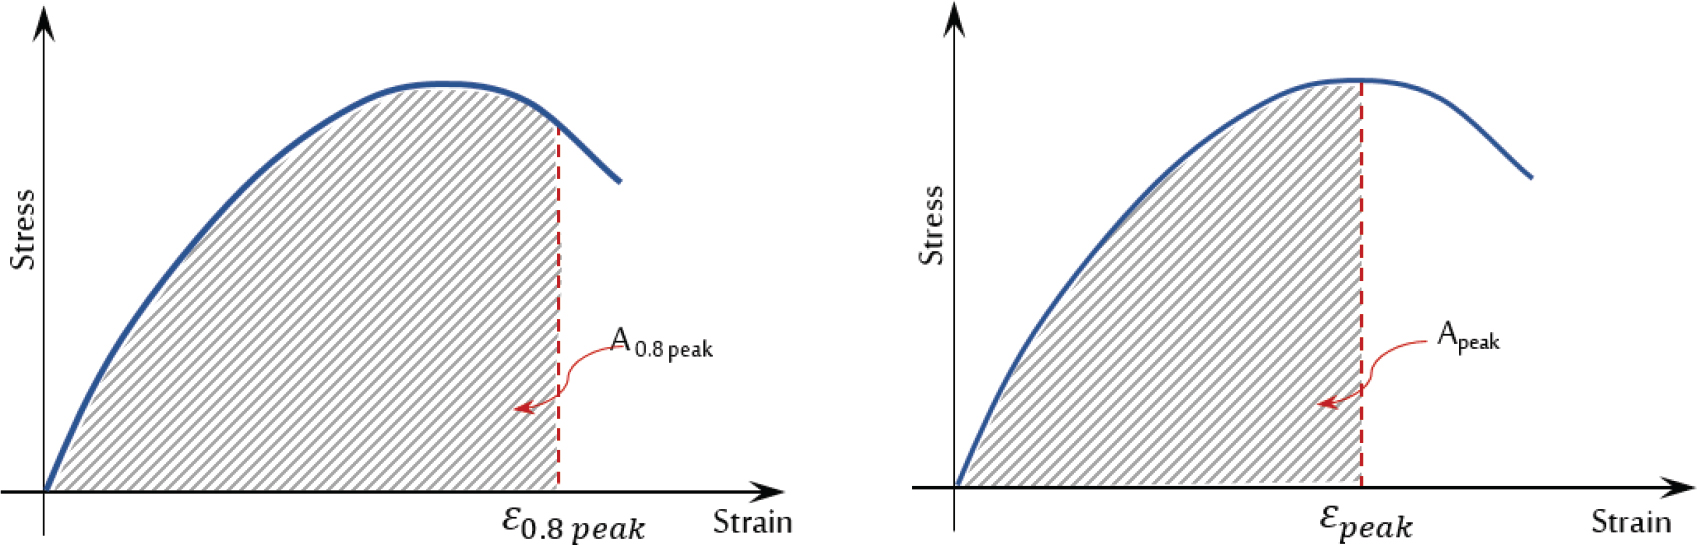
Fig. 12.
The toughness index calculation