
Table 1.
DLS assessment results
| Sample name | Hydrodynamic size | Zeta potential |
|---|---|---|
| RESALNPs | 504.067 ± 30.38 nm | −26.05 ± 6.60 mV |
| PREALNPs | 499.91 ± 55.68 nm | −24.93 ± 9.94 mV |
| ALNPs | 536.90 ± 42.30 nm | −26.33 ± 3.21 mV |
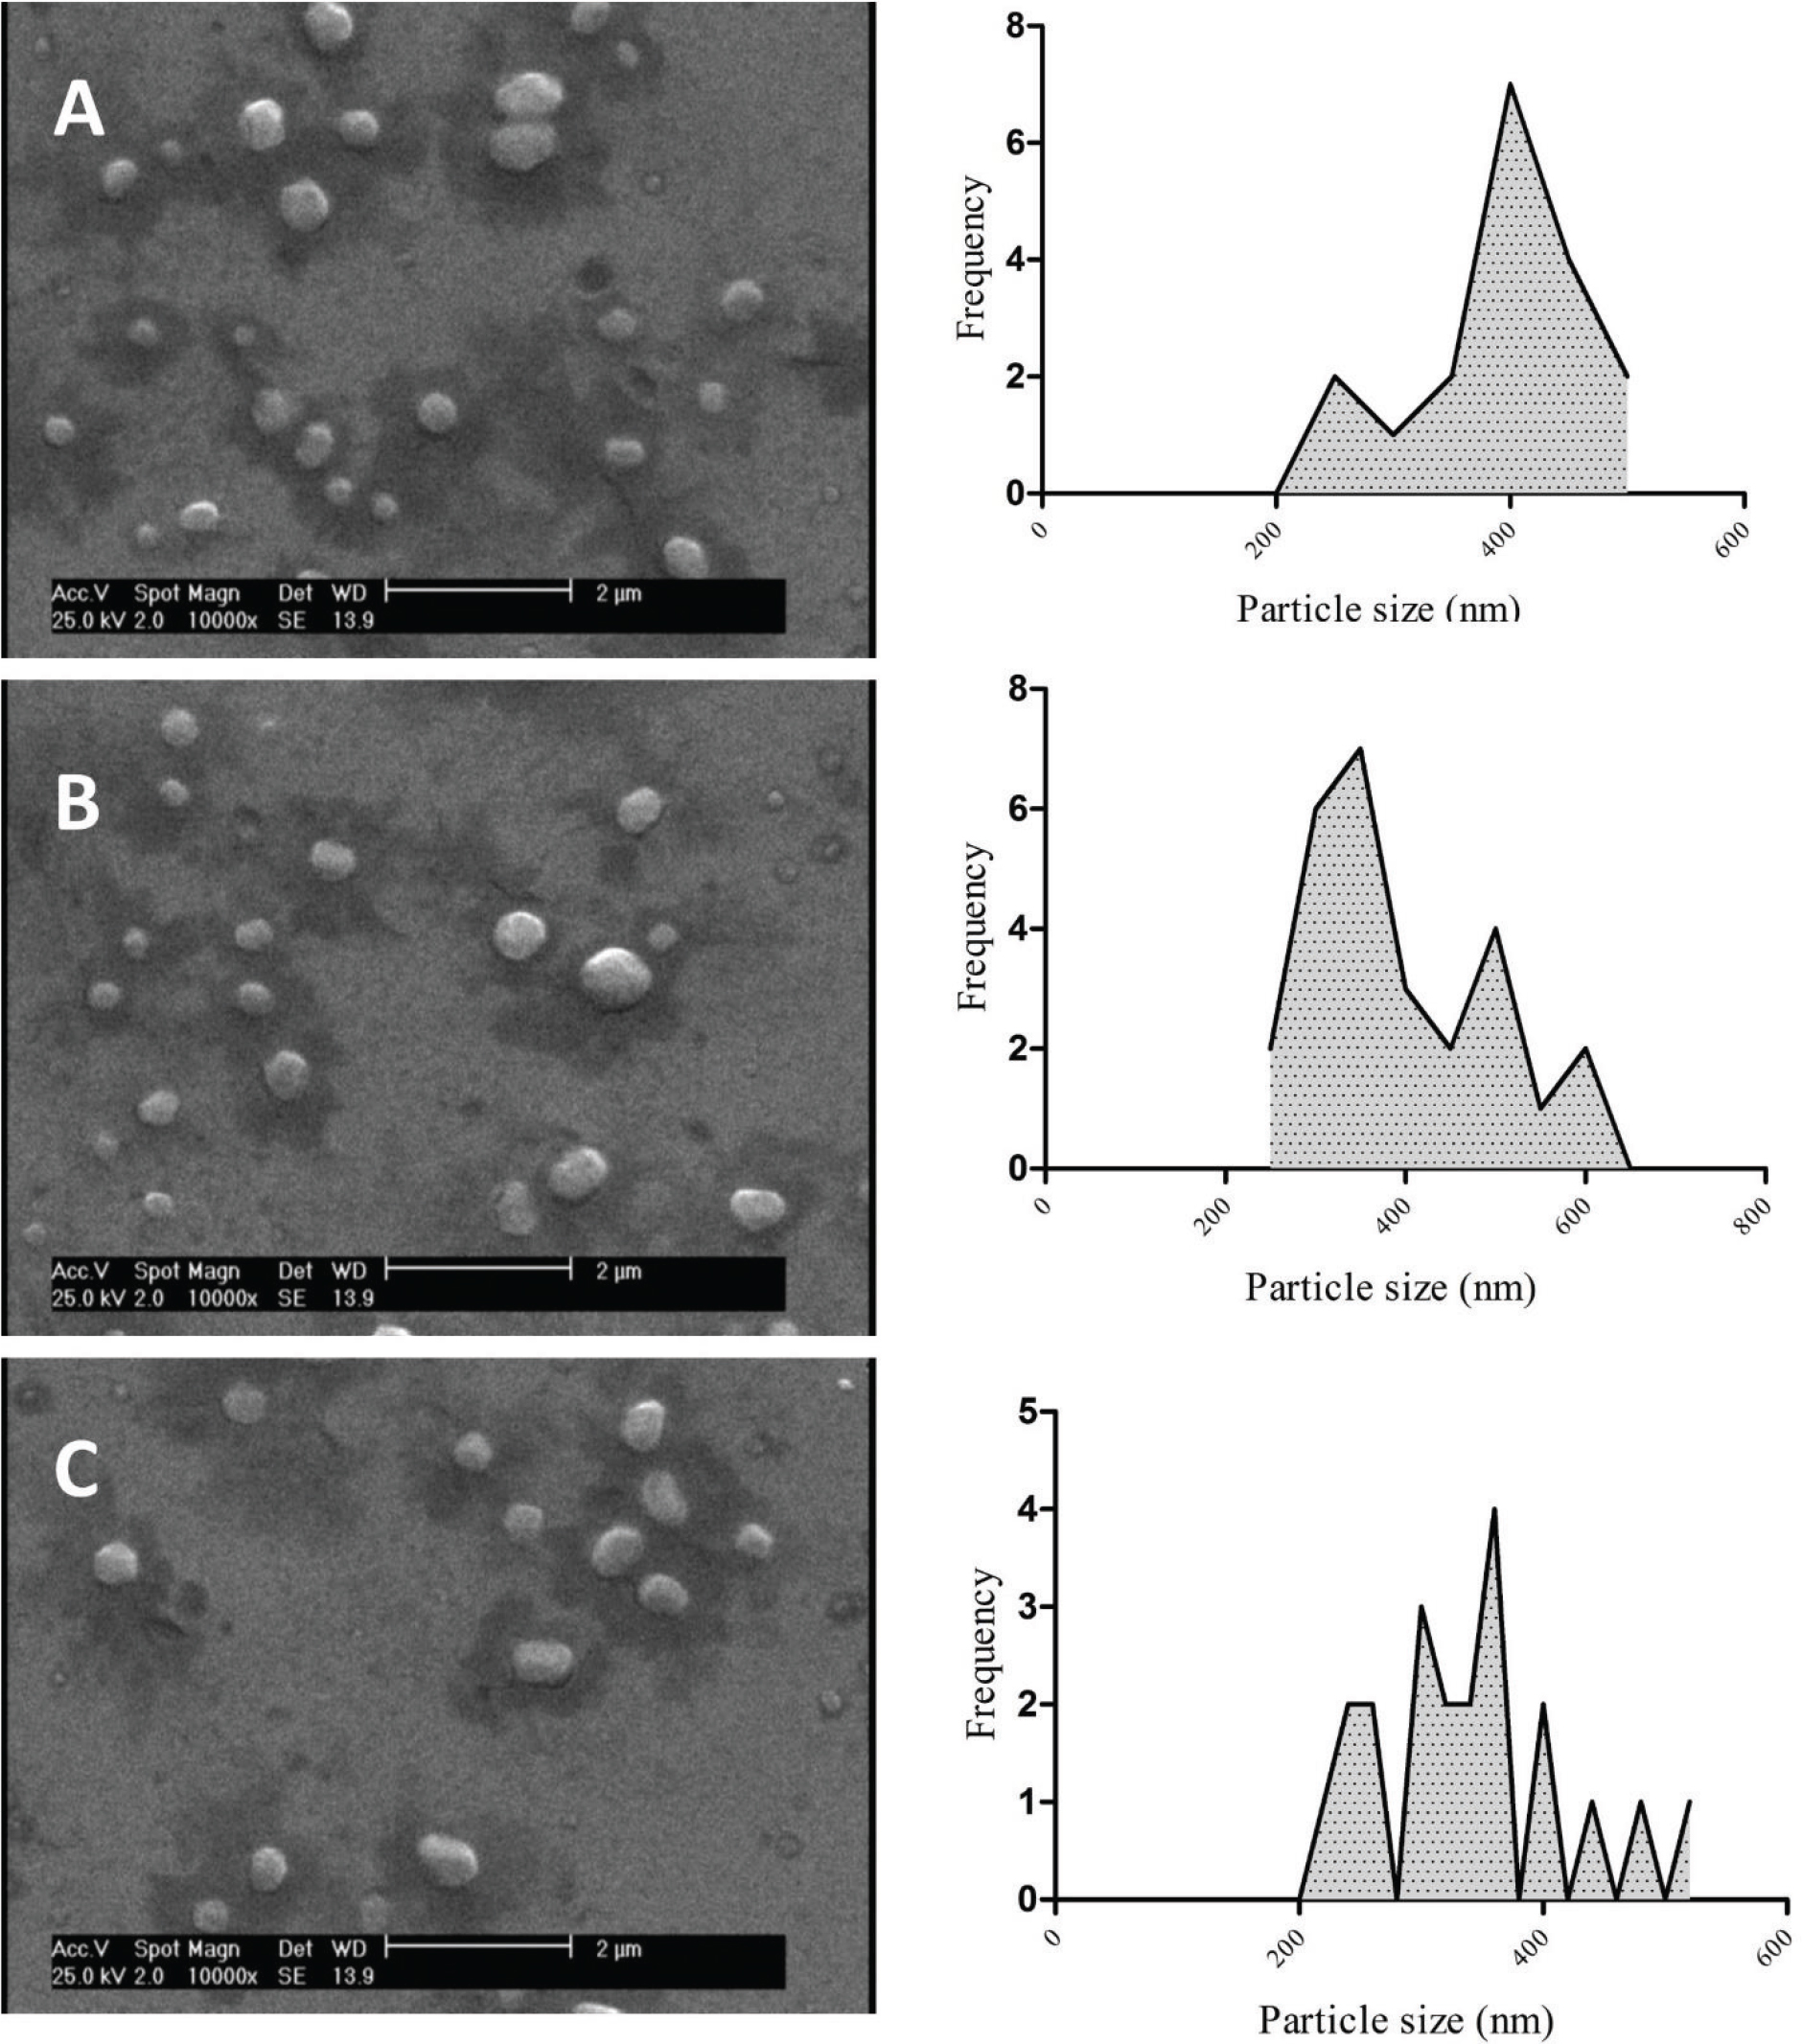
Fig. 1.
SEM images of (A) RESALNPs, (B) PREALNPs, and (C) drug-free ALNPs. Right panel shows the size distribution of each nanocarrier
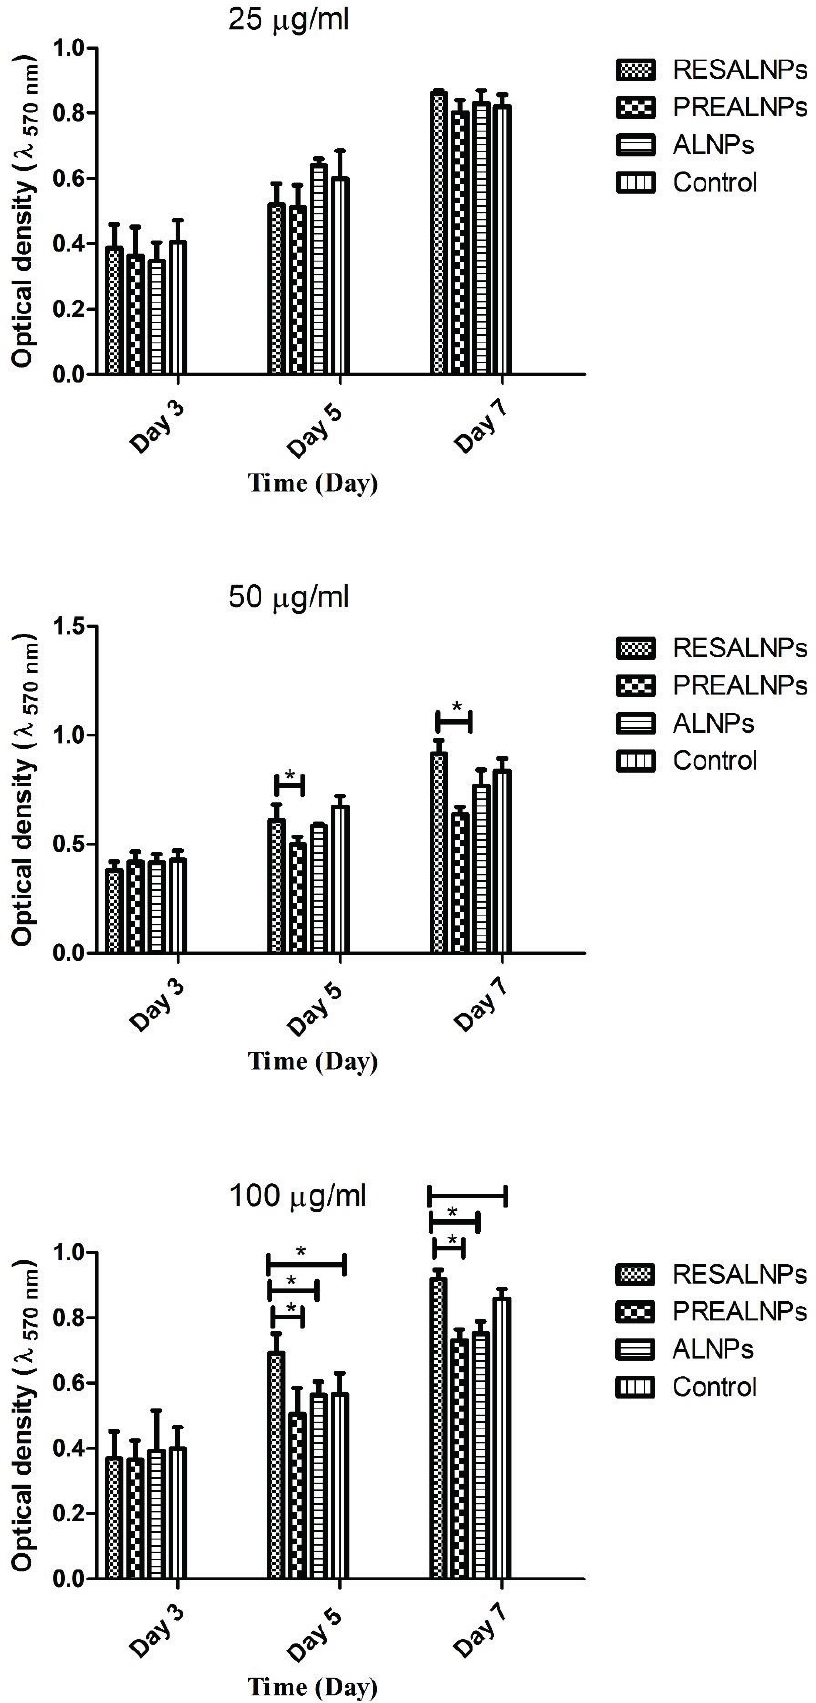
Fig. 2.
MTT assay with MG-63 cells cultured with RESALNPs, PREALNPs, and ALNPs during 7-day culture. * shows p-value < 0.05
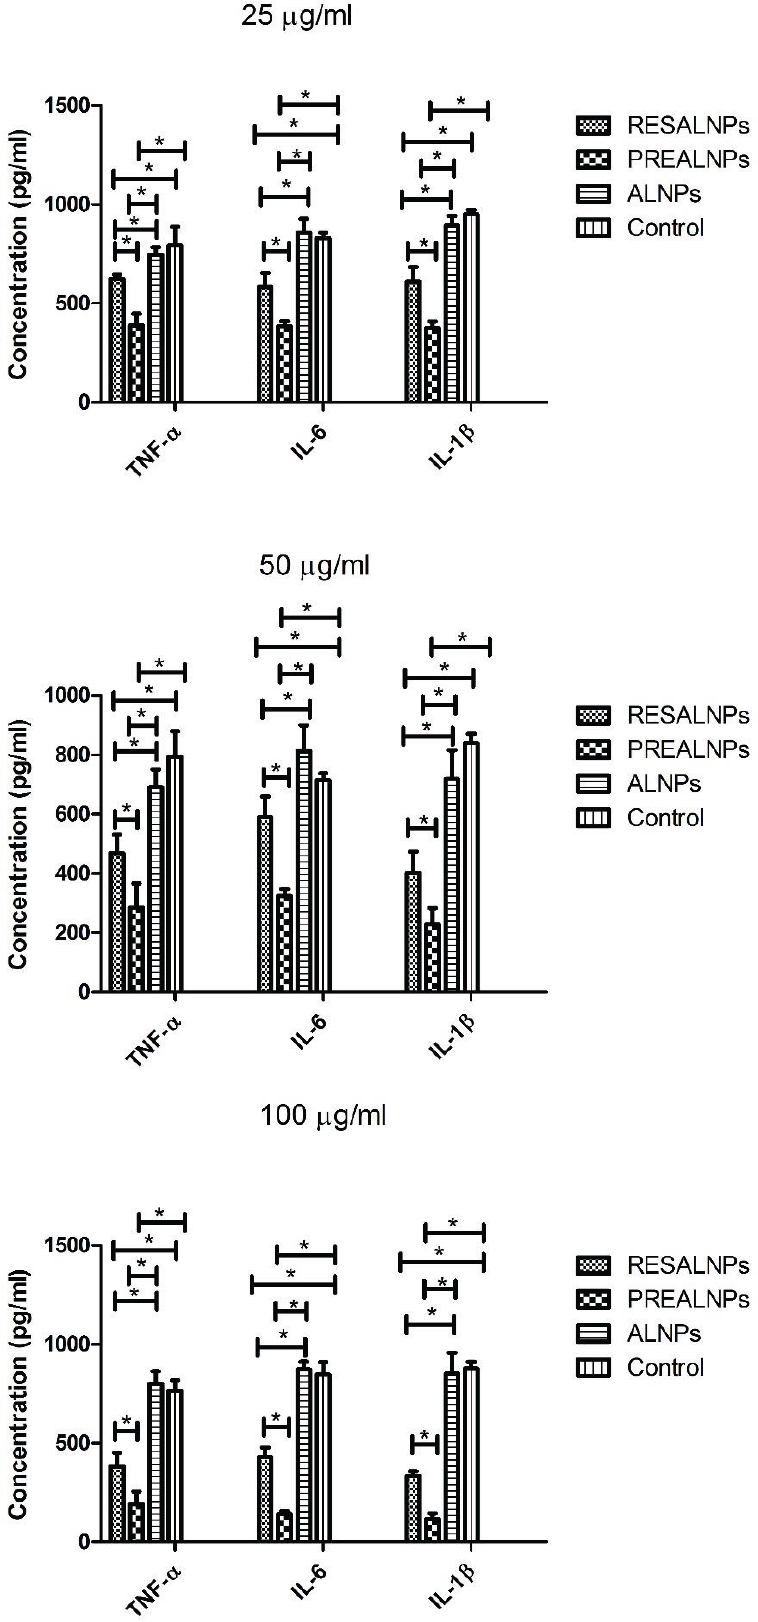
Fig. 3.
Anti-inflammatory assay results with RESAL-NPs and PREALNPs compared with ALNPs and cells cultured with the normal media as the control group, * shows p-value < 0.05
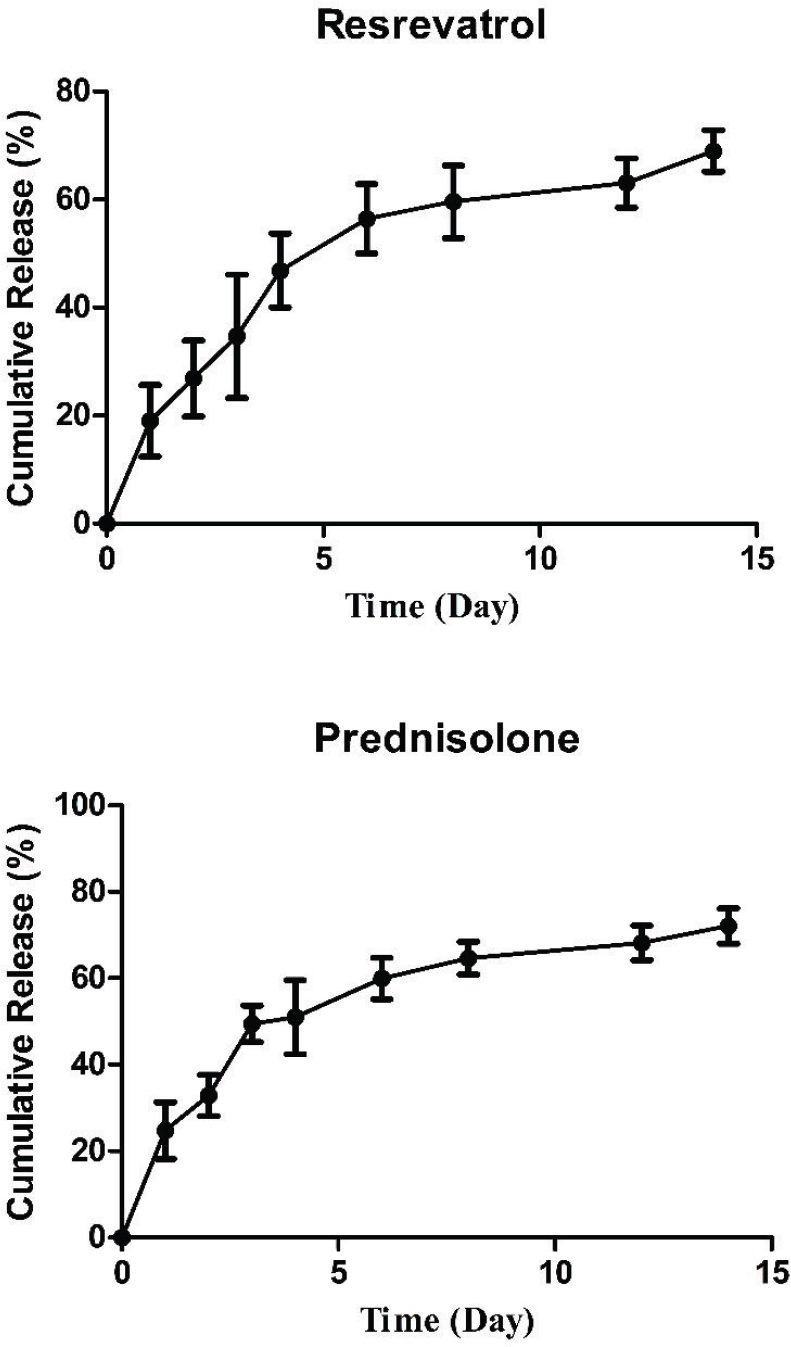
Fig. 4.
Release of resveratrol and prednisolone from ALNPs during the course of 14 days in PBS
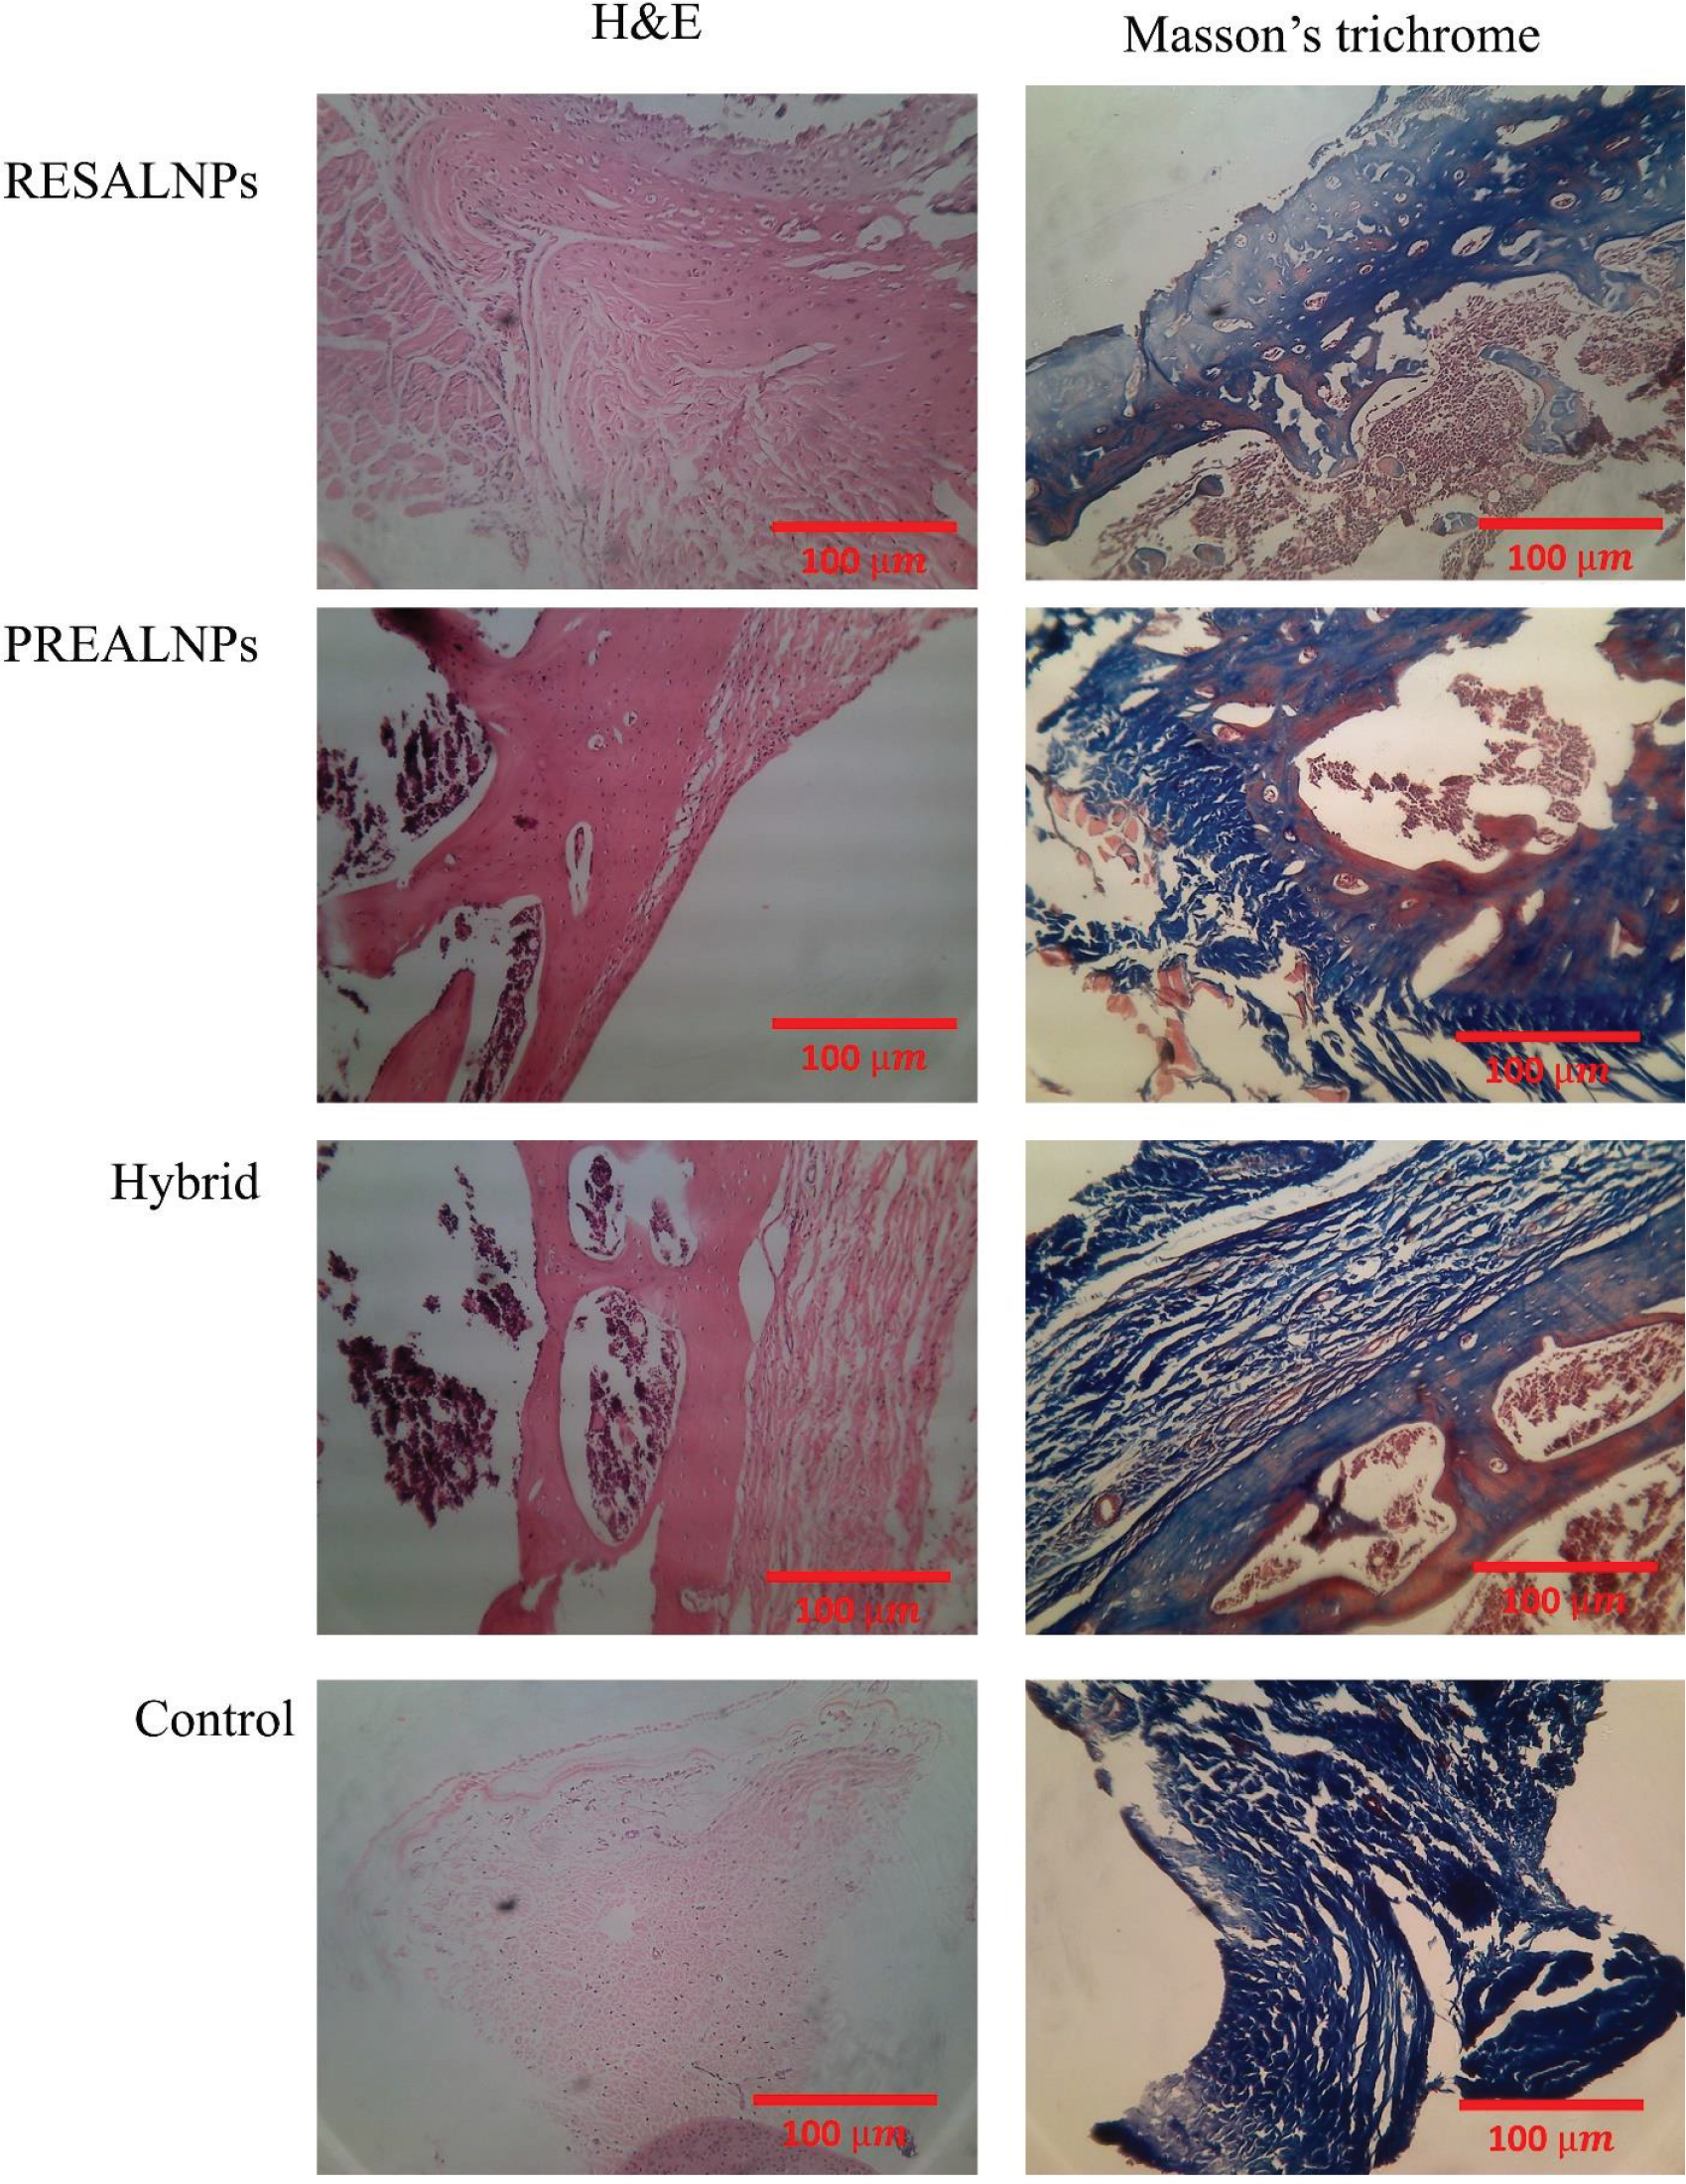
Fig. 5.
Hematoxylin and Eosin (H&E) and Masson’s trichrome staining images of cartilage tissue in different groups
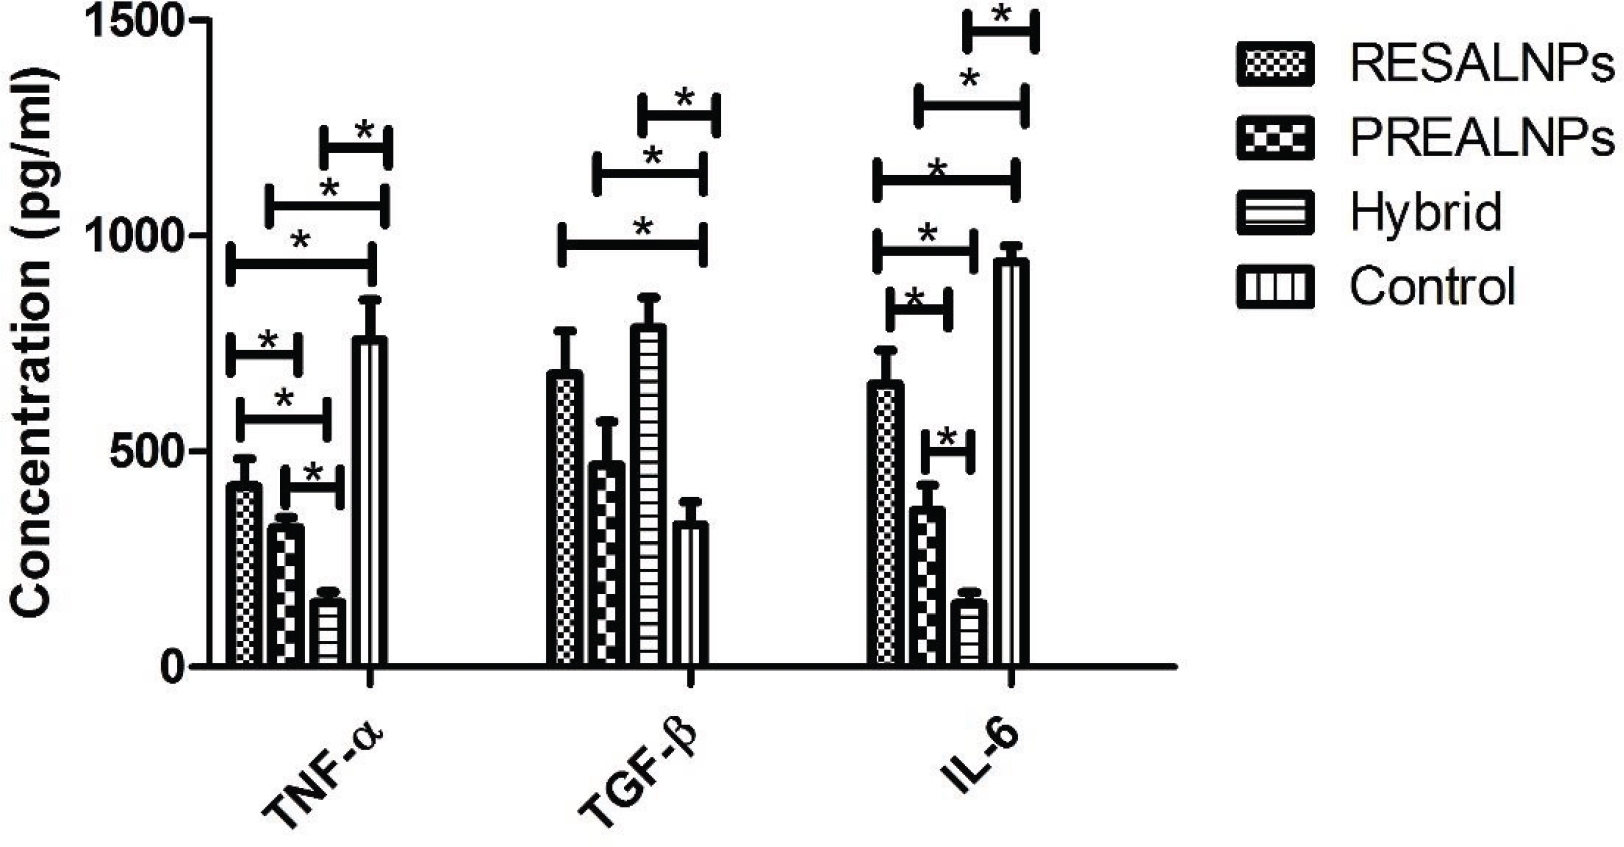
Fig. 6.
Tissue concentrations of TNF-α, TGF-β, and IL-6 in cartilage tissue treated with different nanocarriers, * shows p-value < 0.05