
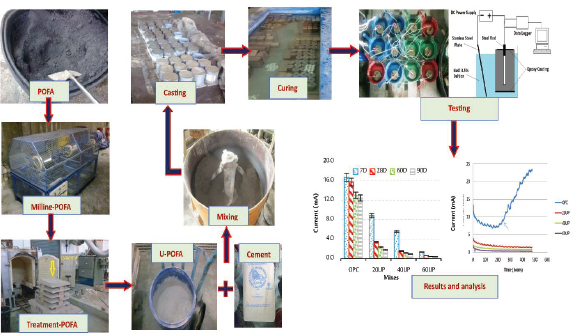
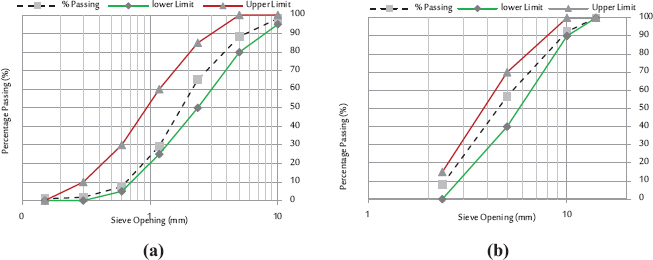
Fig. 1.
Sieve analysis curves: (a) fine aggregate; (b) coarse aggregate
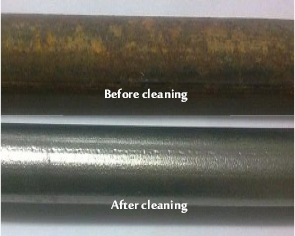
Fig. 2.
The steel bar before and after the cleaning phase
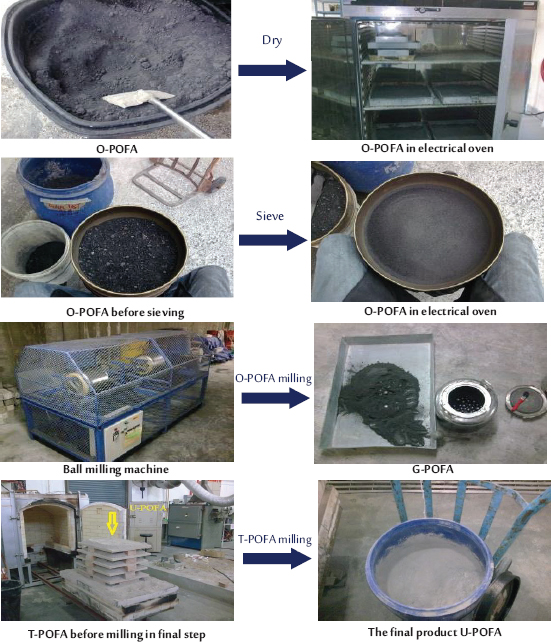
Fig. 3.
Production of U-POFA
Table 1.
The concrete mix proportions in kg/m3
| Mix | Water | OPC | U-POFA | Aggregate | SP | |
|---|---|---|---|---|---|---|
| Coarse | Fine | |||||
| OPC | 154 | 550 | – | 933 | 842 | 12.1 |
| 20UP | 154 | 440 | 110 | 933 | 842 | 12.1 |
| 40UP | 154 | 330 | 220 | 933 | 842 | 12.1 |
| 60UP | 154 | 220 | 330 | 933 | 842 | 12.1 |
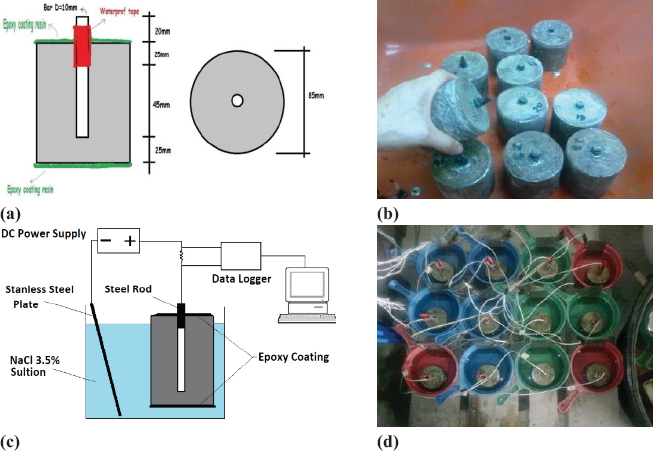
Fig. 4.
IVT procedure: (a) Sample preparation; (b) samples for the IVT; (c) the IVT schematic setup; (d) samples under the IVT
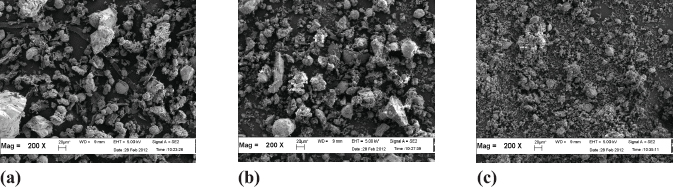
Fig. 5.
SEM morphology of POFAs: (a) O-POFA; (b) G-POFA; (c) U-POFA
Table 2.
The physical characteristics of POFAs and OPC
| Materials | OPC | O-POFA | G-POFA | U-POFA |
|---|---|---|---|---|
| Median particle size (μm) | 10.18 | 16.66 | 12.35 | 2.21 |
Table 3.
The chemical compositions of OPC, G-POFA, and U-POFA
| Compositions | OPC | G-POFA | U-POFA |
|---|---|---|---|
| SiO2 | 18.81 | 45.37 | 62.08 |
| Al2O3 | 4.54 | 5.09 | 7.09 |
| Fe2O3 | 3.2 | 3.76 | 5.92 |
| CaO | 65.77 | 3.87 | 5.39 |
| MgO | 0.78 | 3.22 | 4.24 |
| P2O5 | 0.08 | 2.99 | 3.84 |
| K2O | 1.18 | 4.11 | 5.57 |
| SO3 | 3.54 | 0.23 | 0.23 |
| TiO2 | 0.20 | 0.19 | 0.27 |
| MnO | 0.19 | 0.06 | 0.09 |
| Na2O | 0.09 | 0.07 | 0.10 |
| C | 30.60 | 4.74 |
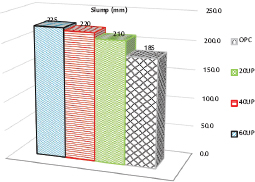
Fig. 6.
Slump results for all mixes
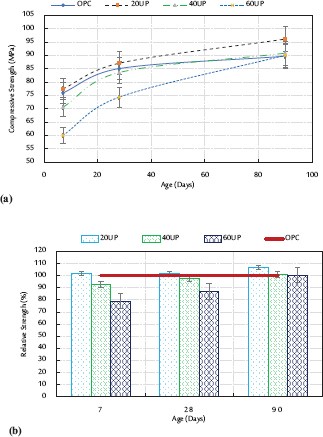
Fig. 7.
Compressive strength results: (a) strength development with days; (b) the relative strength
Table 4.
Porosity and water absorption results
| Mix | OPC | 20UP | 40UP | 60UP | ||||||||
|---|---|---|---|---|---|---|---|---|---|---|---|---|
| Age (days) | 7 | 28 | 90 | 7 | 28 | 90 | 7 | 28 | 90 | 7 | 28 | 90 |
| Porosity (%) | 12.3 | 10.9 | 10.1 | 11.6 | 9.5 | 8.7 | 9.6 | 9.2 | 7.4 | 8.8 | 7.4 | 5.4 |
| Water absorption (%) | 5.7 | 4.8 | 4.2 | 5.0 | 4.1 | 3.7 | 4.3 | 4.0 | 3.2 | 3.8 | 3.2 | 2.3 |
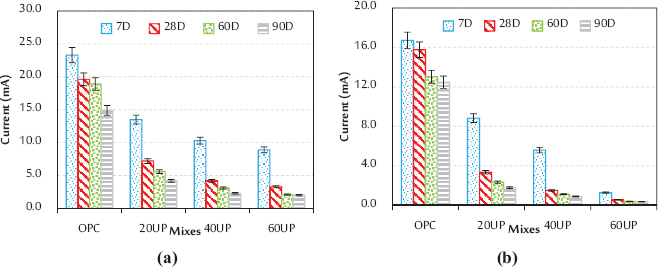
Fig. 8.
Impressed voltage test results: (a) the initial current of samples; (b) the average steady state currents
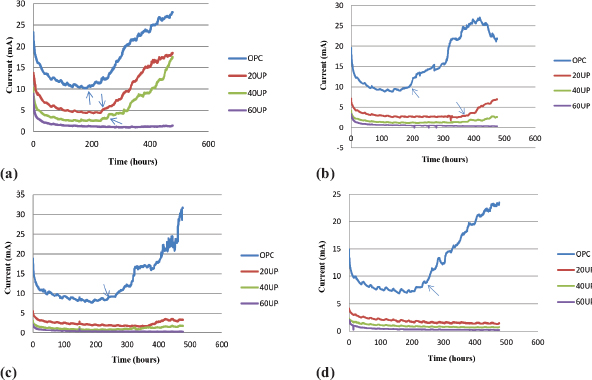
Fig. 9.
The corrosion current vs time of the specimens at: (a) 7 days; (b) 28 days; (c) 60 days; (d) 90 days
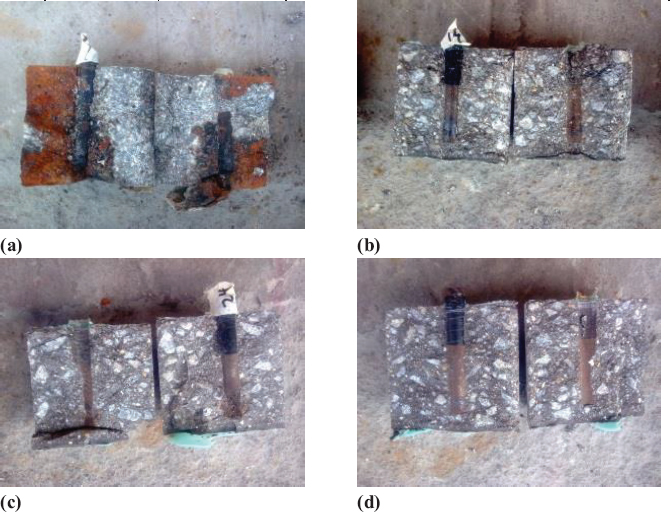
Fig. 10.
Samples after the IVT: (a) OPC; (b) 20UP; (c) 40UP; (d) 60UP
Table 5.
Impressed voltage test results (in hours)
| Mix | The start–end times of steady state | The initial crack time of the samples | ||||||
|---|---|---|---|---|---|---|---|---|
| Age (Days) | 7 | 28 | 60 | 90 | 7 | 28 | 60 | 90 |
| OPC | 40 – 180 | 40 – 190 | 35 – 230 | 20 – 240 | 176 | 188 | 229 | 236 |
| 20UP | 40 – 230 | 30 – 350 | 10 – 477 | 5 – 477 | 234 | 353 | – | – |
| 40UP | 35 – 245 | 20 – 477 | 5 – 477 | 1 – 477 | 245 | – | – | – |
| 60UP | 25 – 477 | 15 – 477 | 1 – 477 | 0.5 – 477 | – | – | – | – |
Table 6.
Corrosion rate (mm/ year) by mass loss via the IVT
| Age (Days) | Mix | |||
|---|---|---|---|---|
| OPC | 20UP | 40UP | 60UP | |
| 7 | 7.276 | 3.913 | 2.425 | 0.661 |
| 28 | 6.945 | 1.488 | 0.717 | 0.331 |
| 60 | 5.705 | 1.075 | 0.524 | 0.220 |
| 90 | 5.457 | 0.827 | 0.441 | 0.165 |
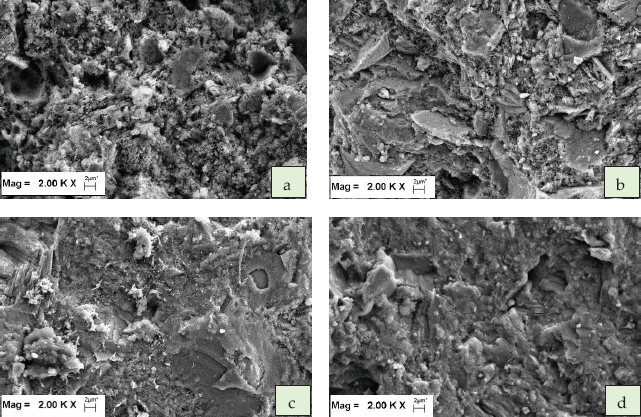
Fig. 11.
SEM imaging of cement pastes aged 28 days, (a)Cement paste contains 0% U-POFA, (b) Cement paste contains 20% U-POFA, (c) Cement paste contains 40% U-POFA, (d) Cement paste contains 60% U-POFA