
Table 1.
The elemental composition of Cu-Cr-O films as a function of annealing temperature
| Annealing temperature (°C) | Cu (at.%) | Cr (at.%) | O(at.%) | Cu/Cr ratio |
|---|---|---|---|---|
| As-deposited | 28.41 | 14.05 | 57.54 | 2.02 |
| 500 | 31.69 | 15.95 | 52.36 | 1.99 |
| 600 | 31.20 | 16.24 | 52.55 | 1.92 |
| 700 | 31.23 | 15.68 | 53.09 | 1.99 |
| 800 | 31.81 | 15.68 | 52.51 | 2.03 |
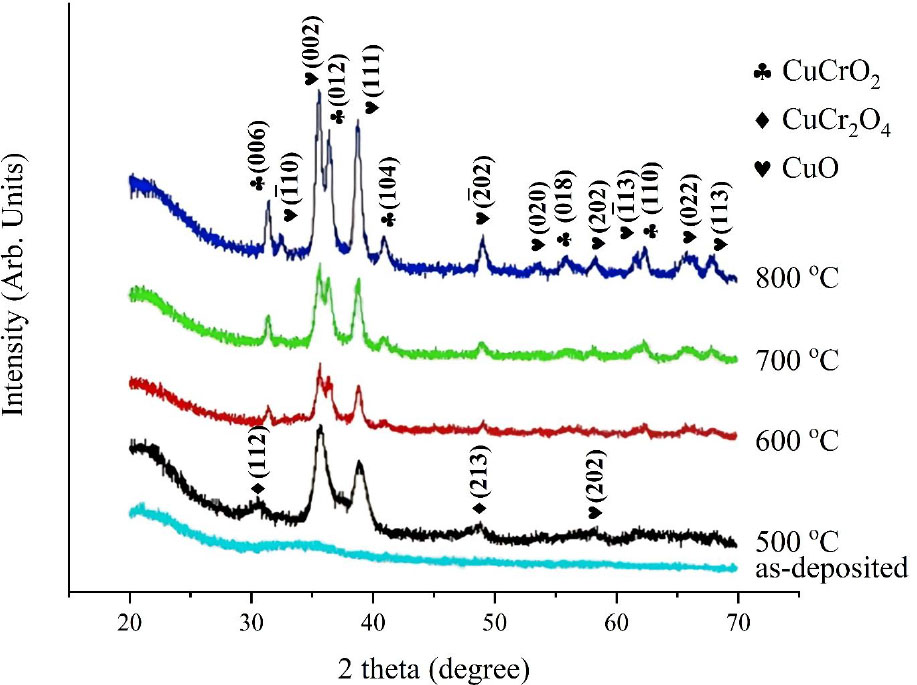
Fig. 1.
XRD patterns of Cu-Cr-O films with different post-annealing temperatures
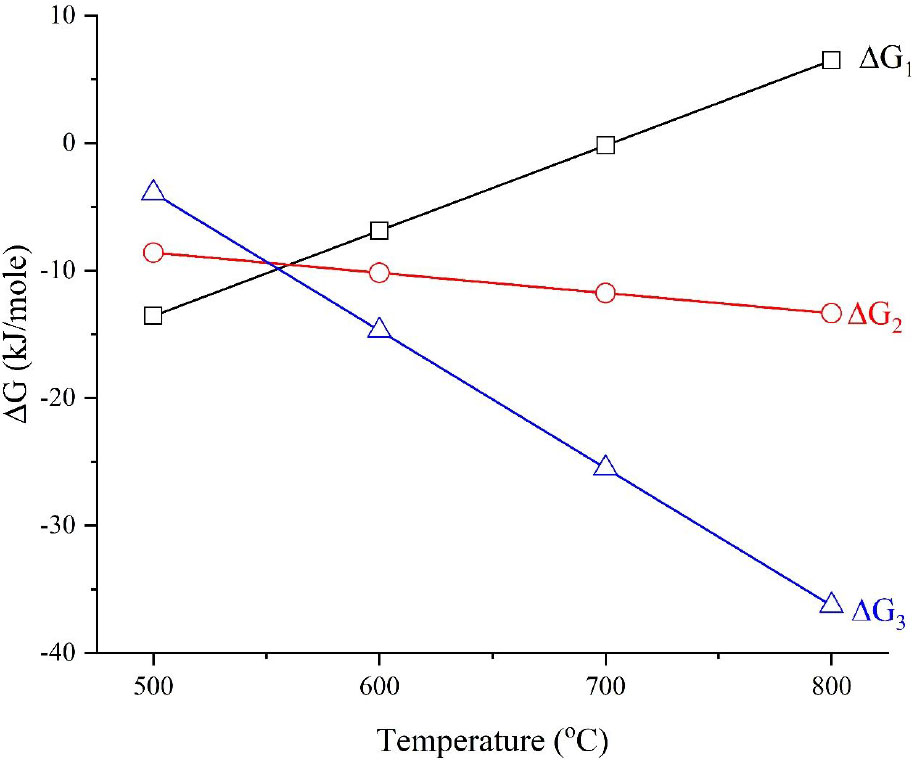
Fig. 2.
The ΔG of reactions 2, 4, and 6 with different annealing temperatures
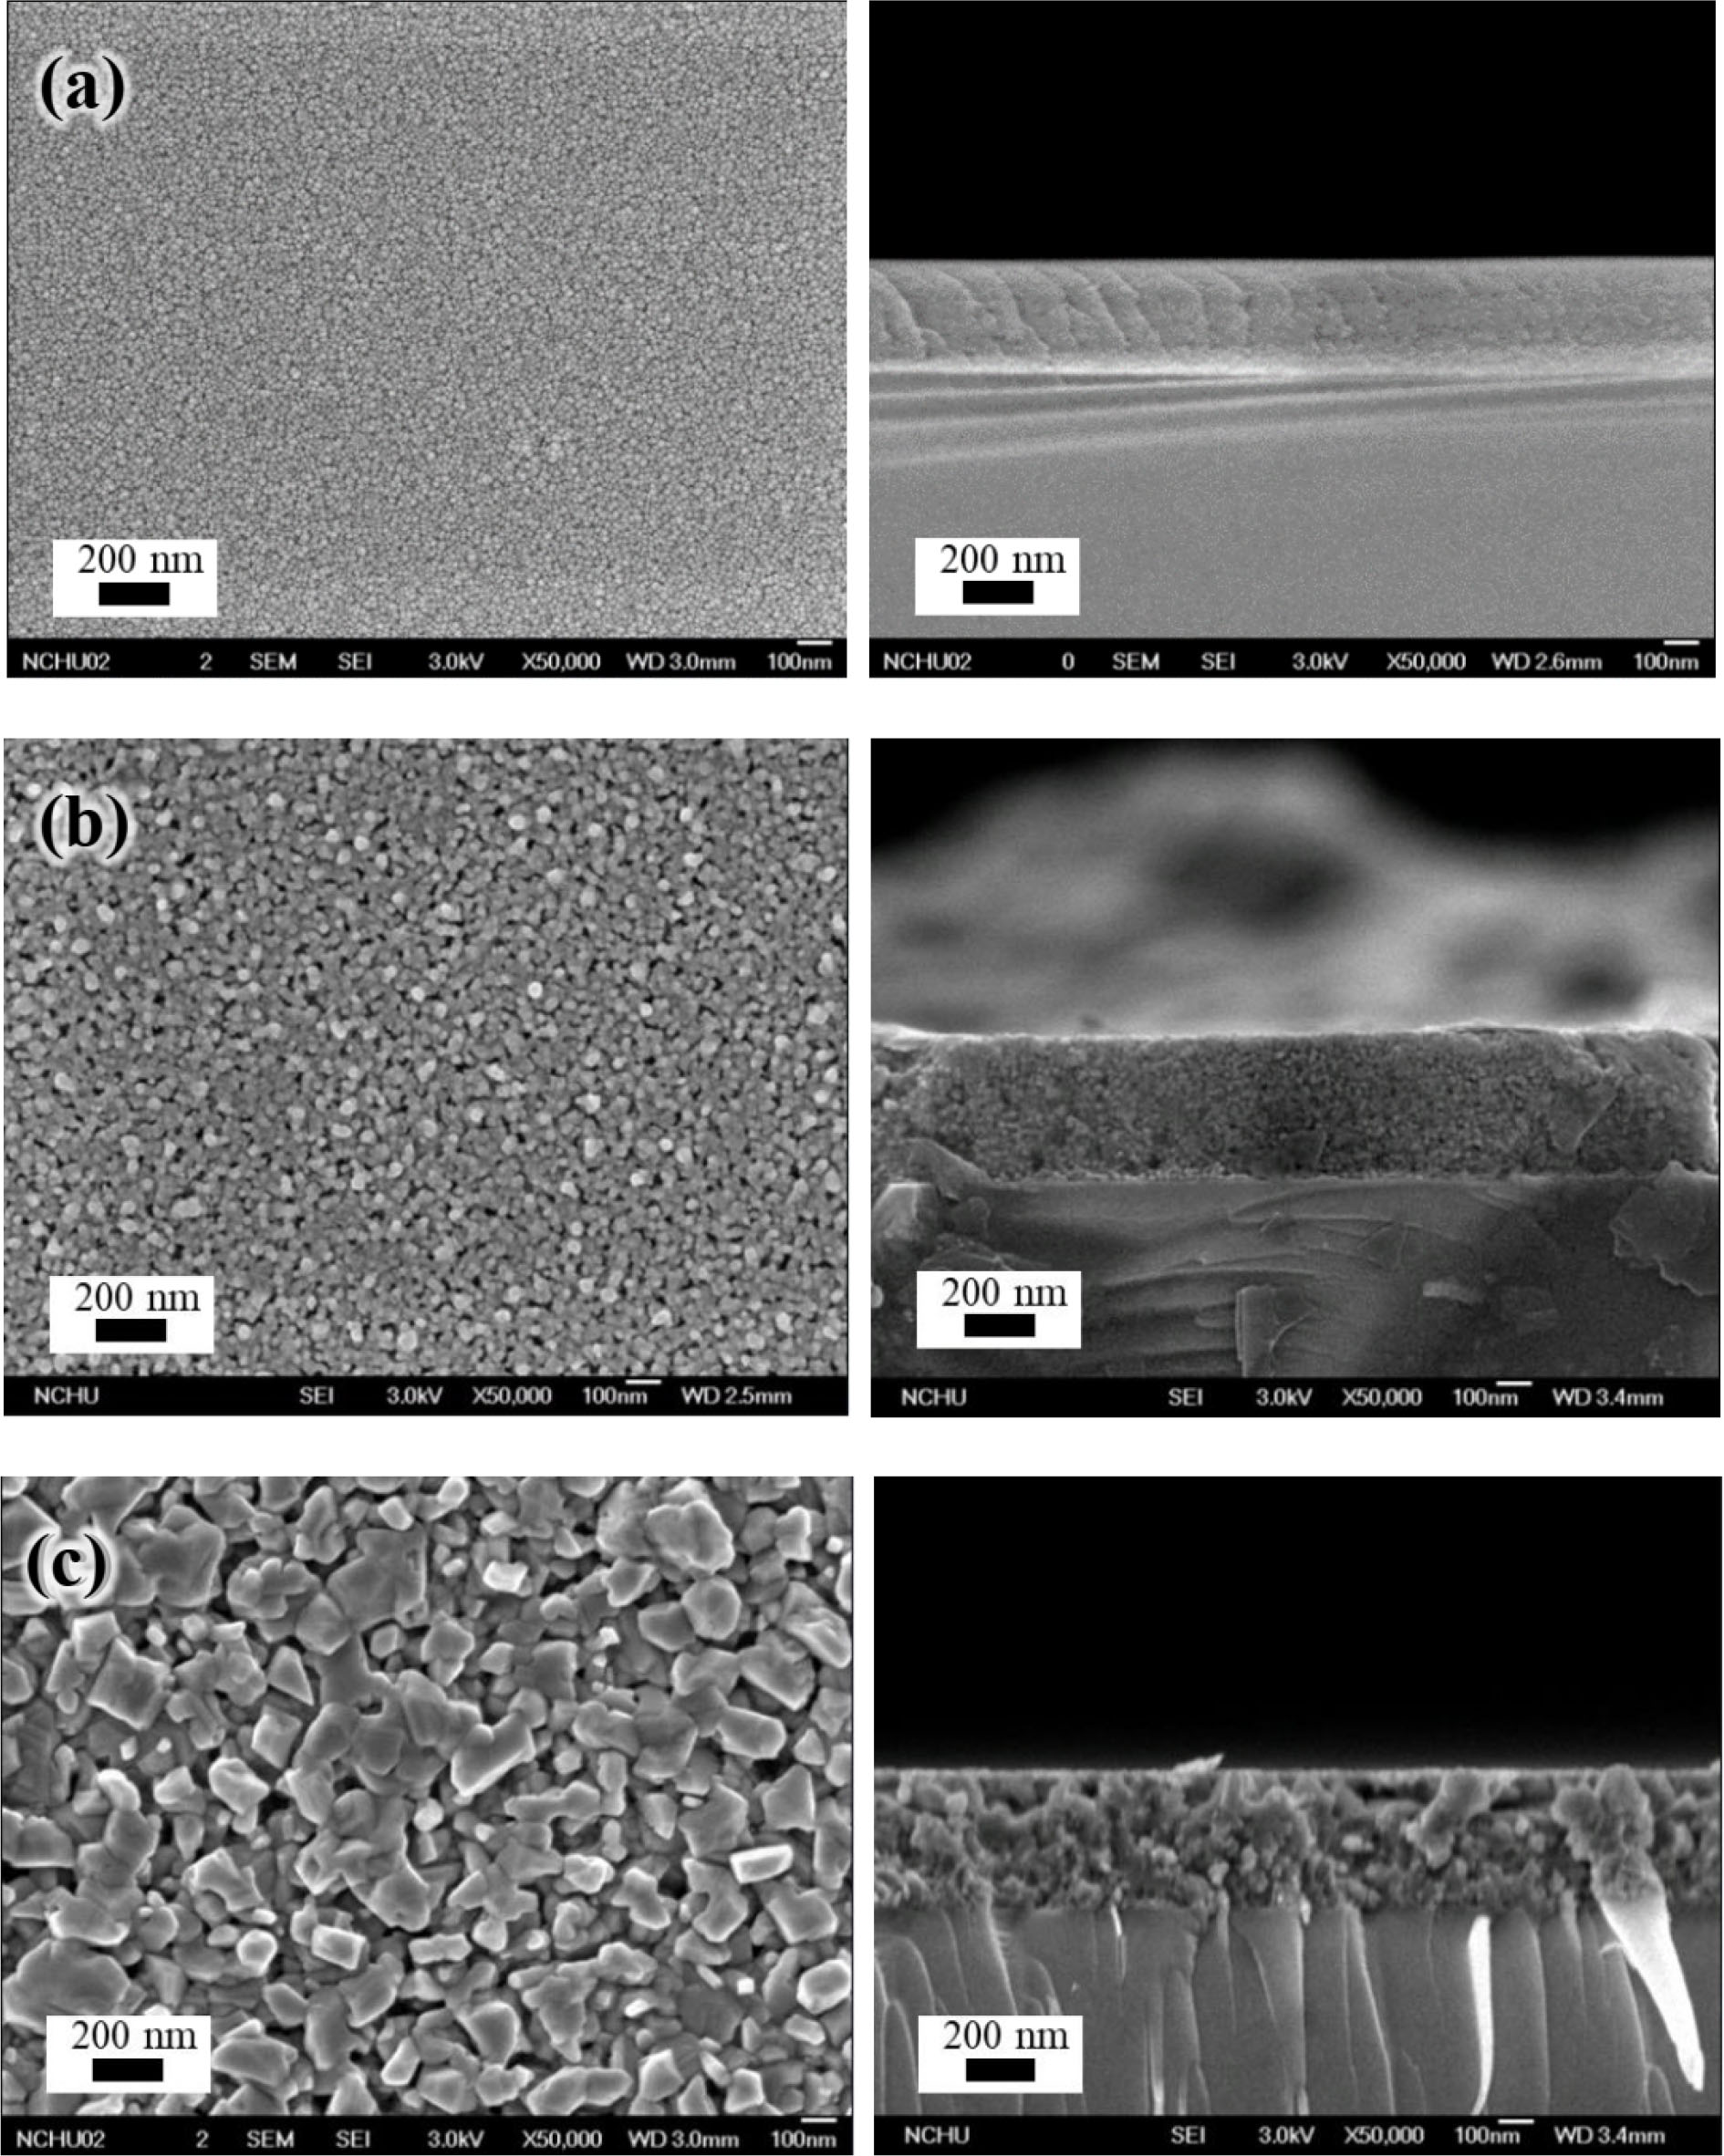
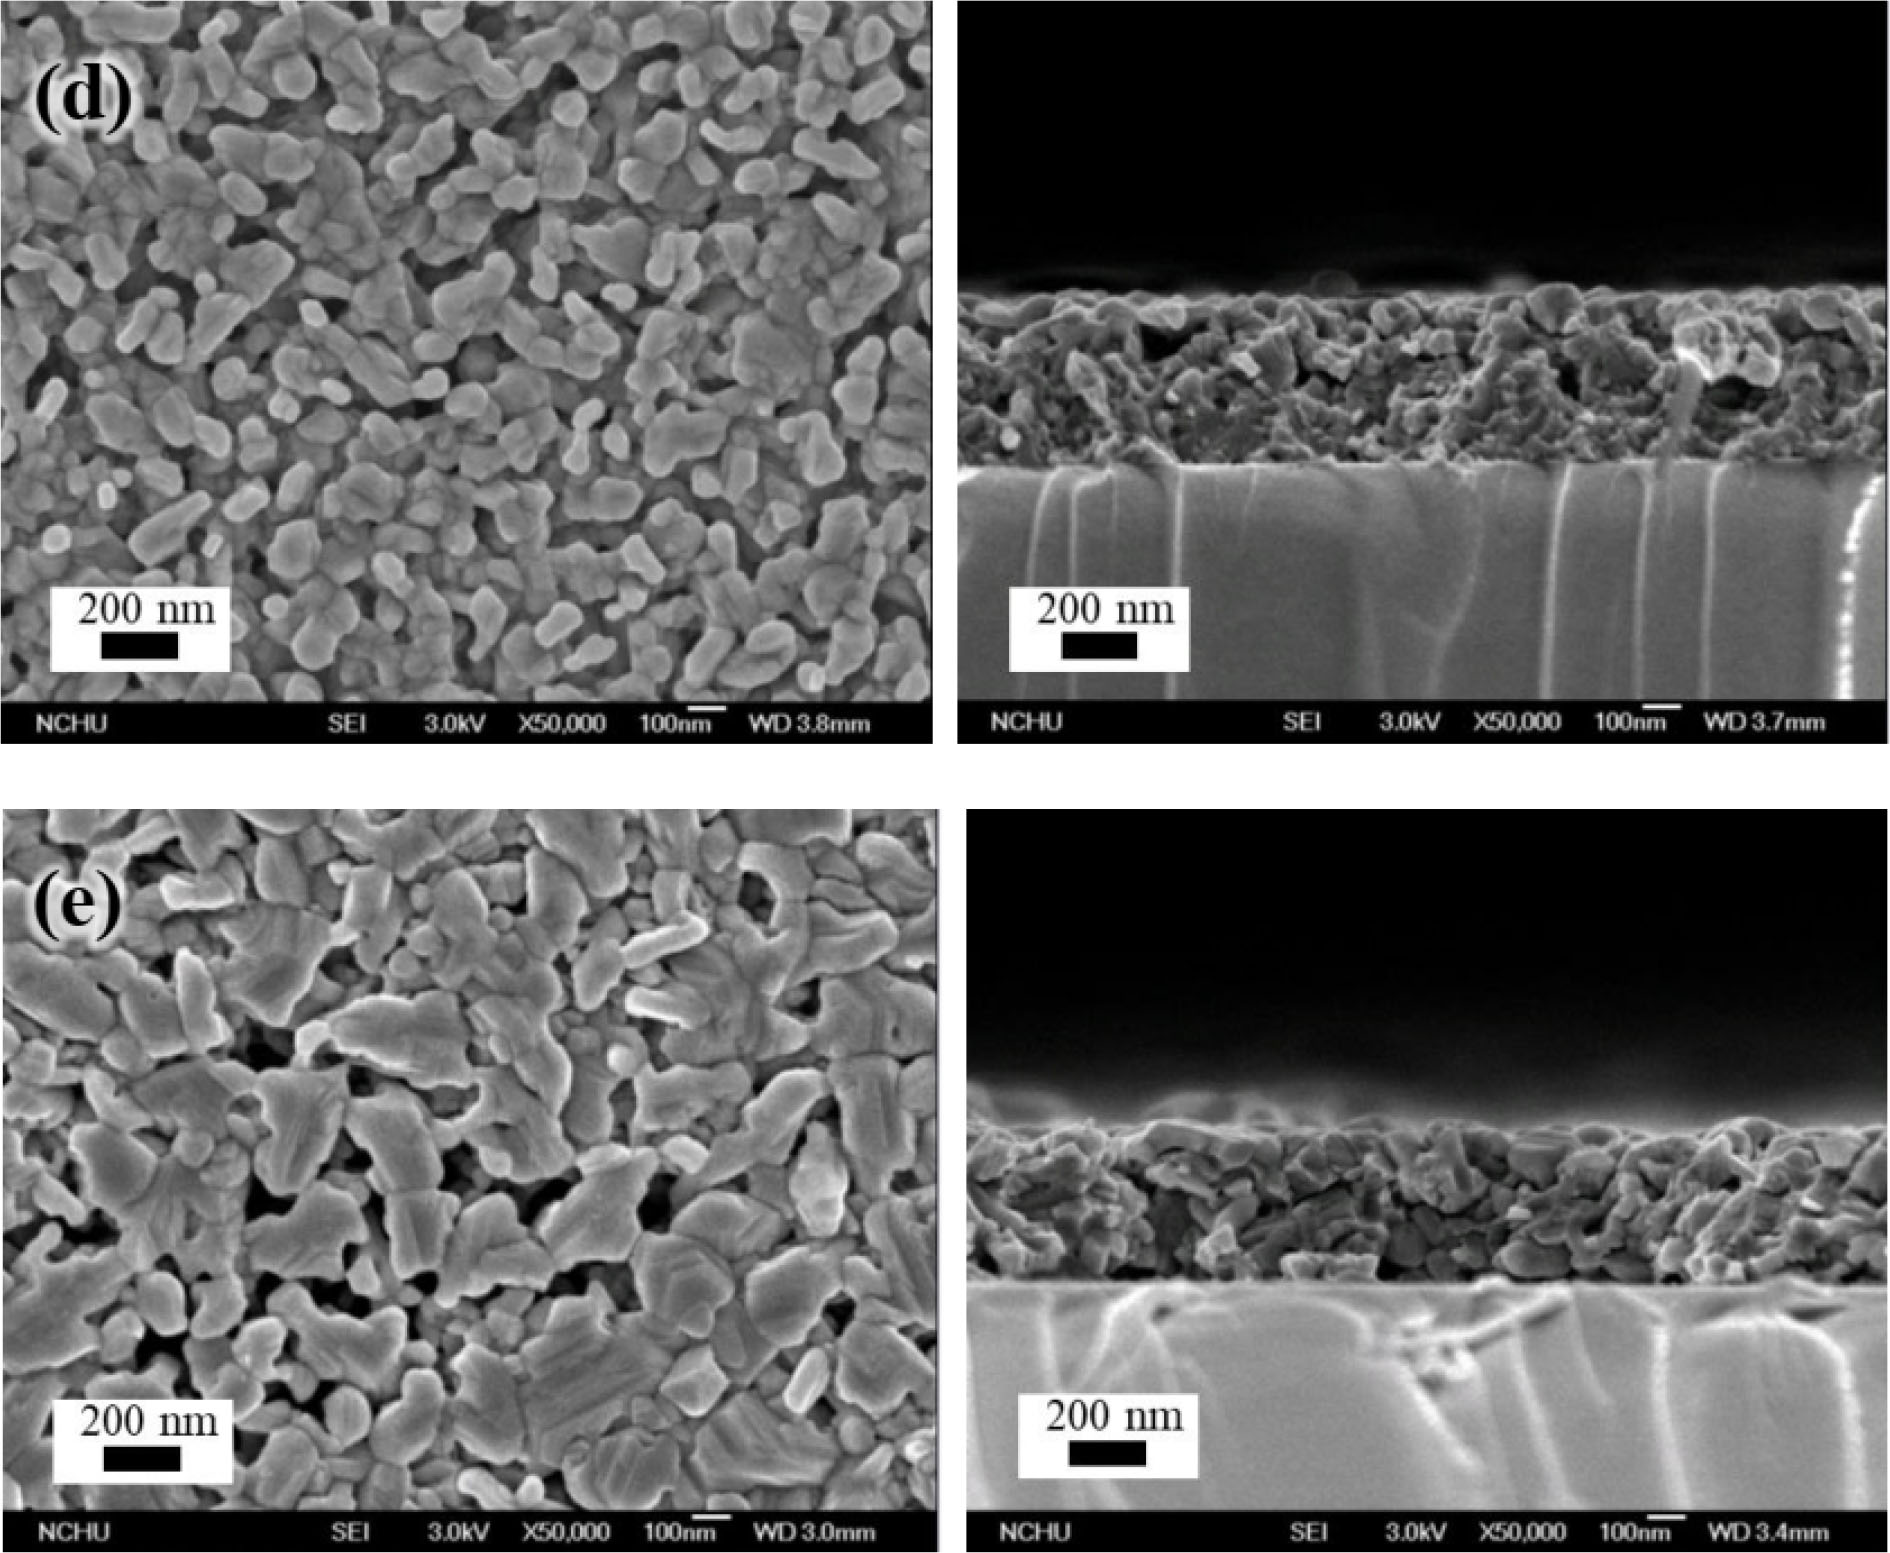
Fig. 3.
Cross-section and plane-view SEM images of Cu-Cr-O films with different post-annealing temperatures: (a) as-deposited, (b) 500°C, (c) 600°C, (d) 700°C, and (e) 800°C
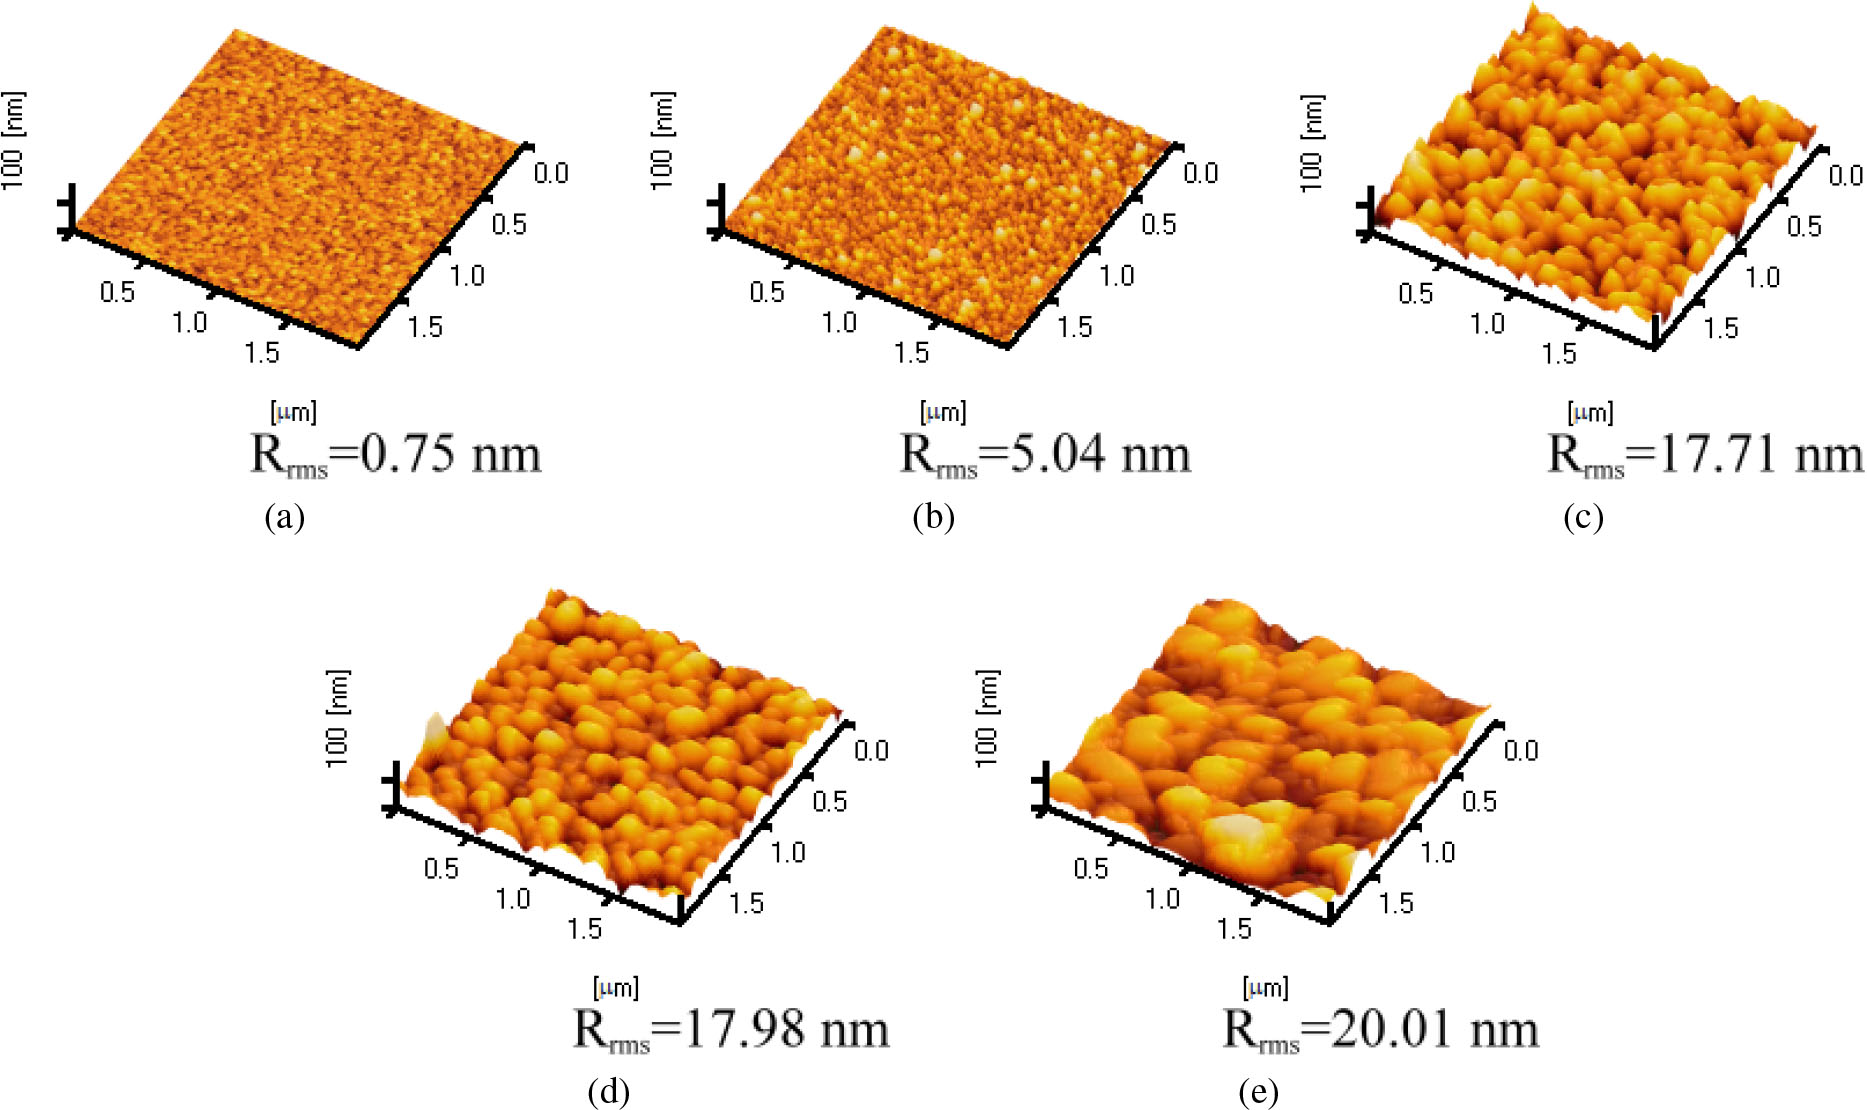
Fig. 4.
AFM images of Cu-Cr-O films with different post-annealing temperatures: (a) as-deposited, (b) 500°C, (c) 600°C, (d) 700°C, and (e) 800°C
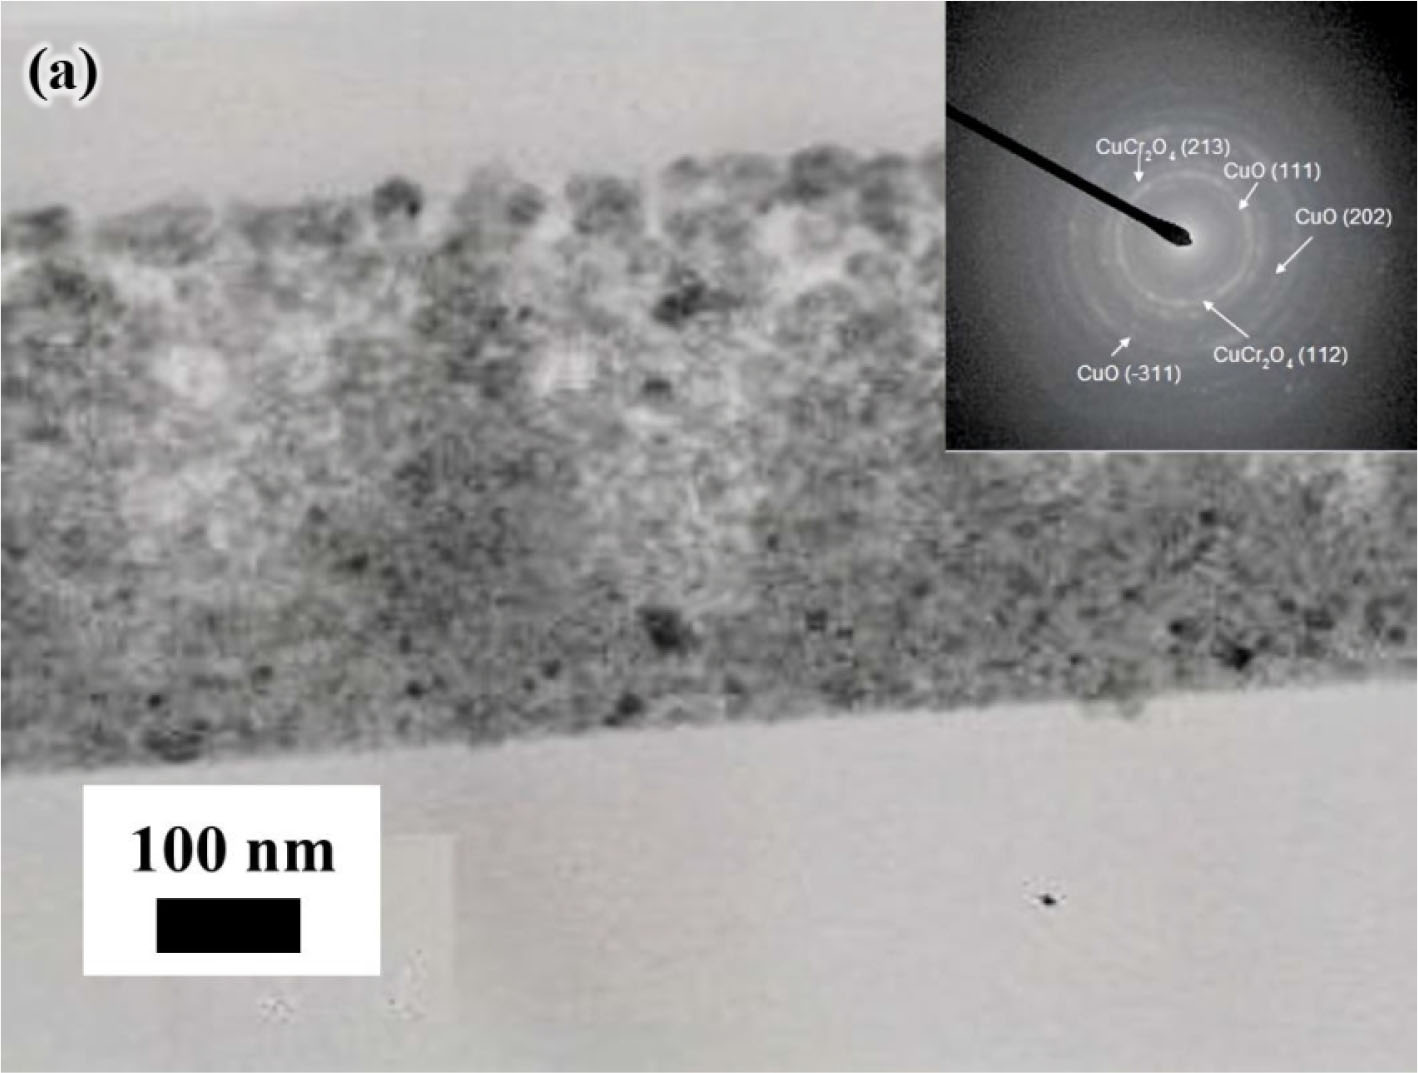
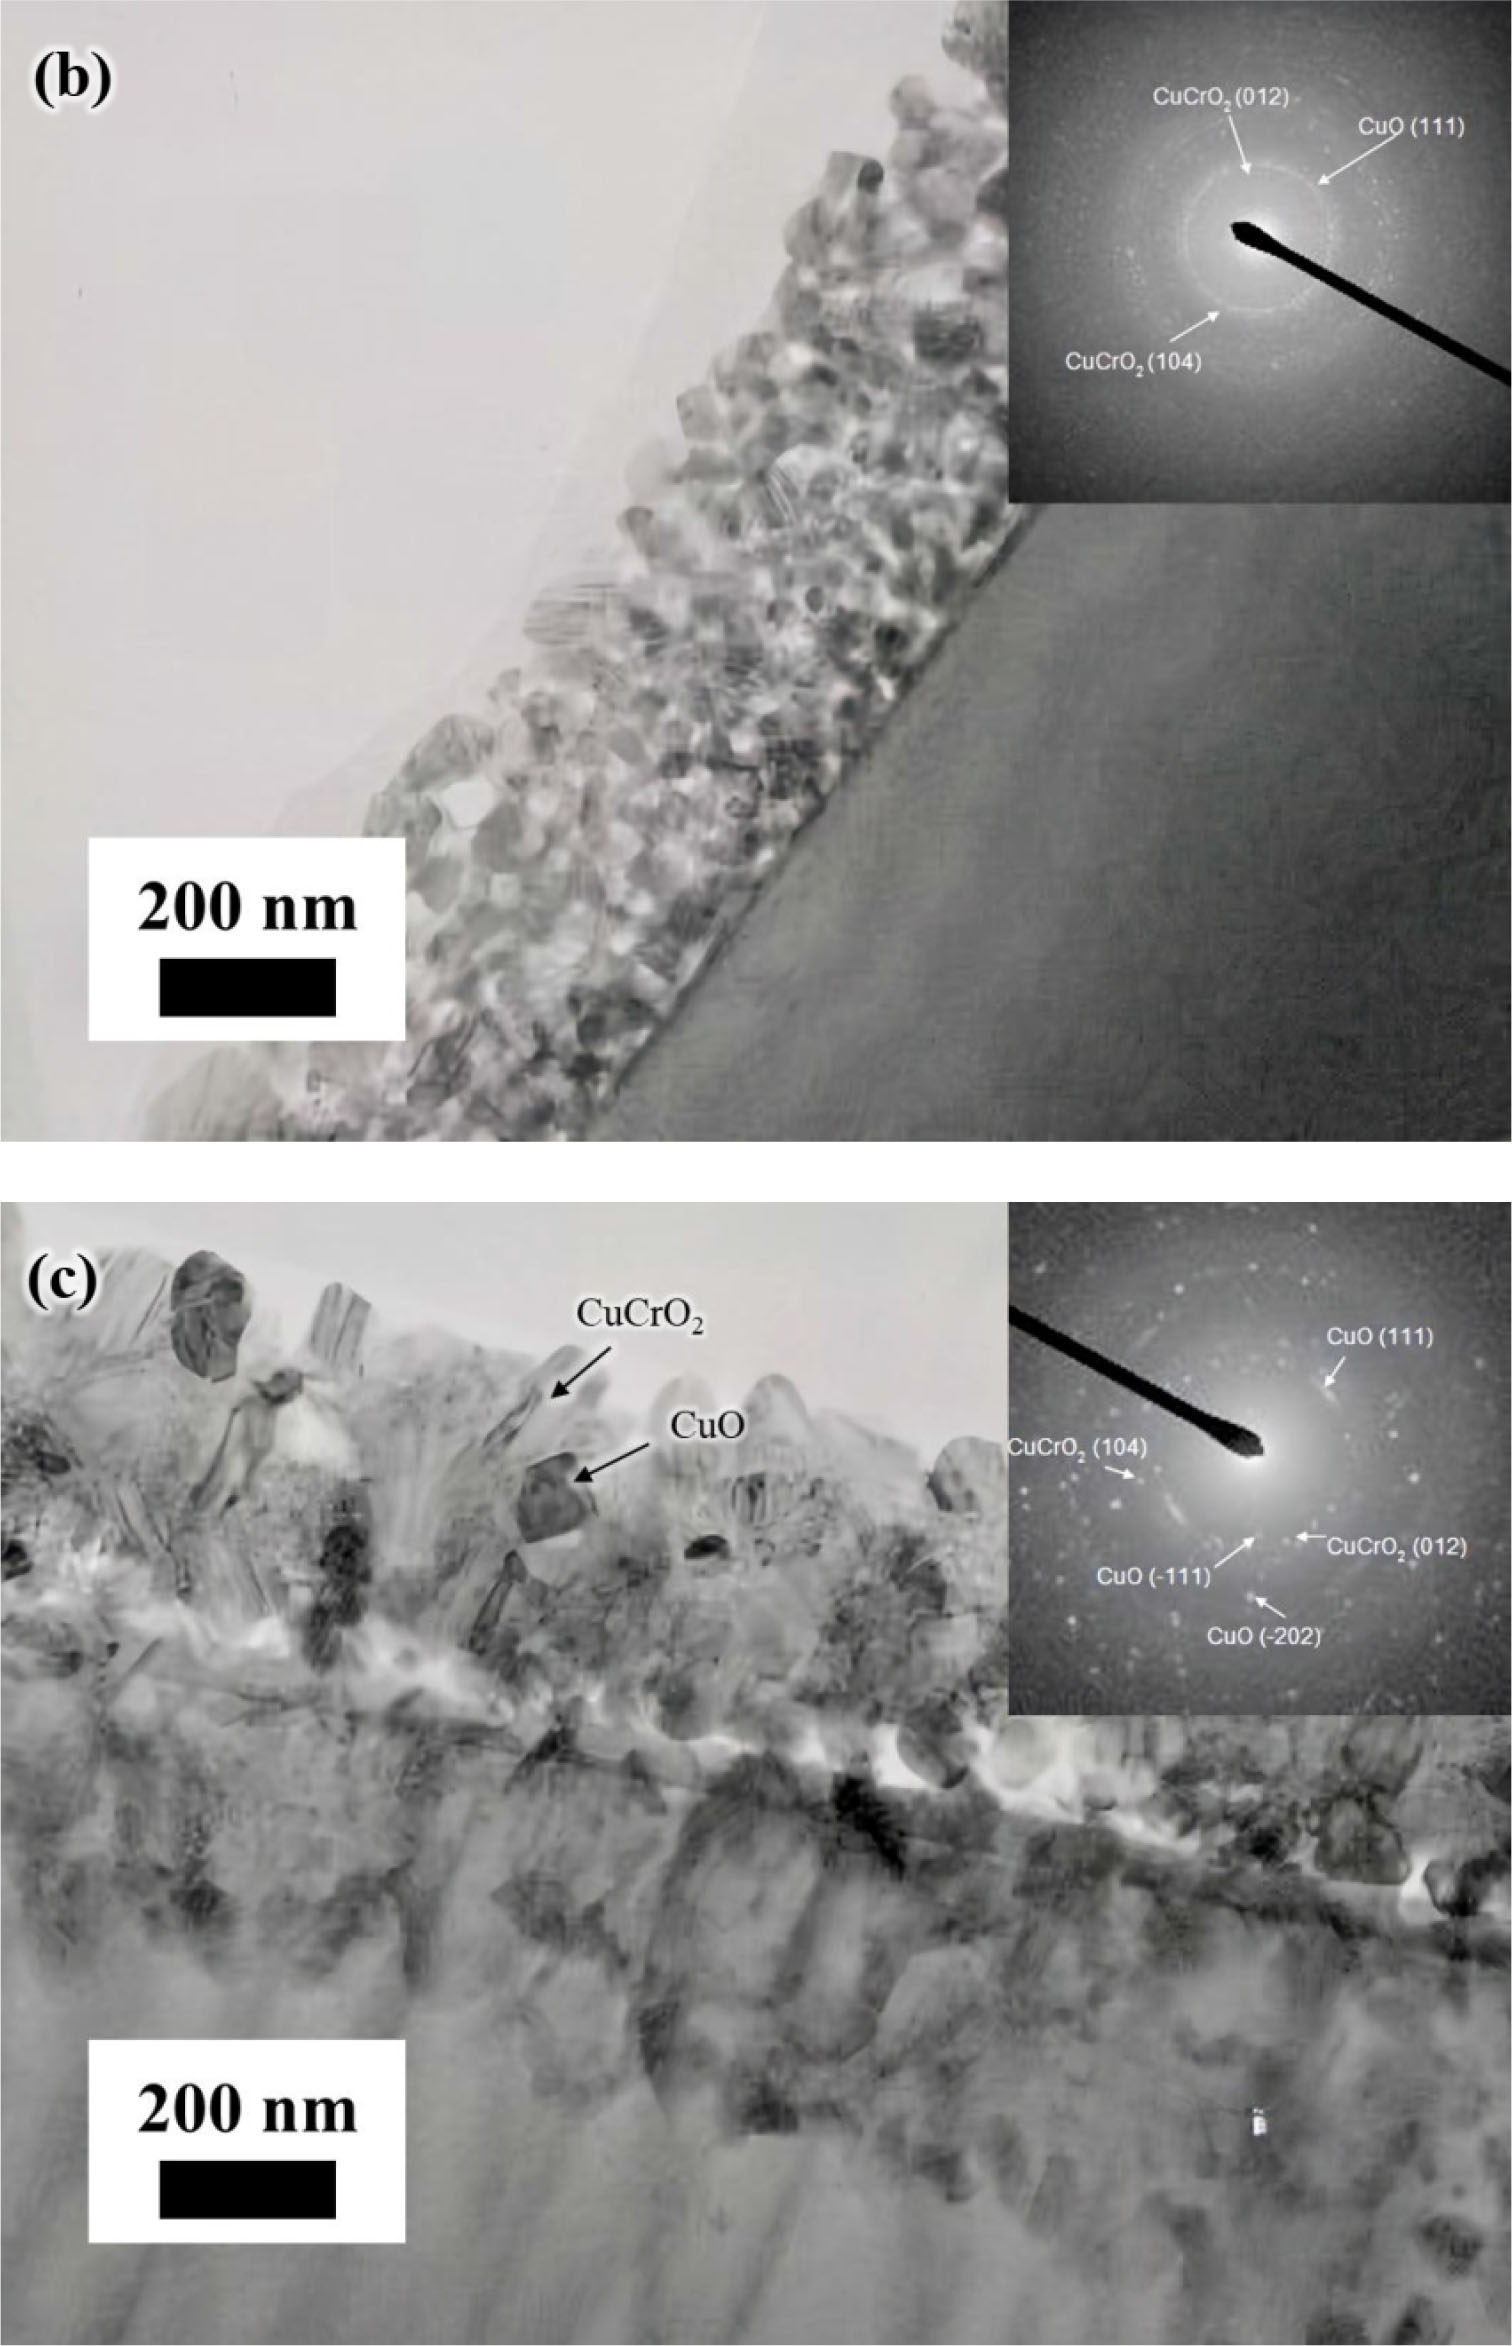
Fig. 5.
TEM images with corresponding SAD patterns (insets) of Cu-Cr-O films with different post-annealing temperatures: (a) 500°C, (b) 600°C, and (c) 800°C
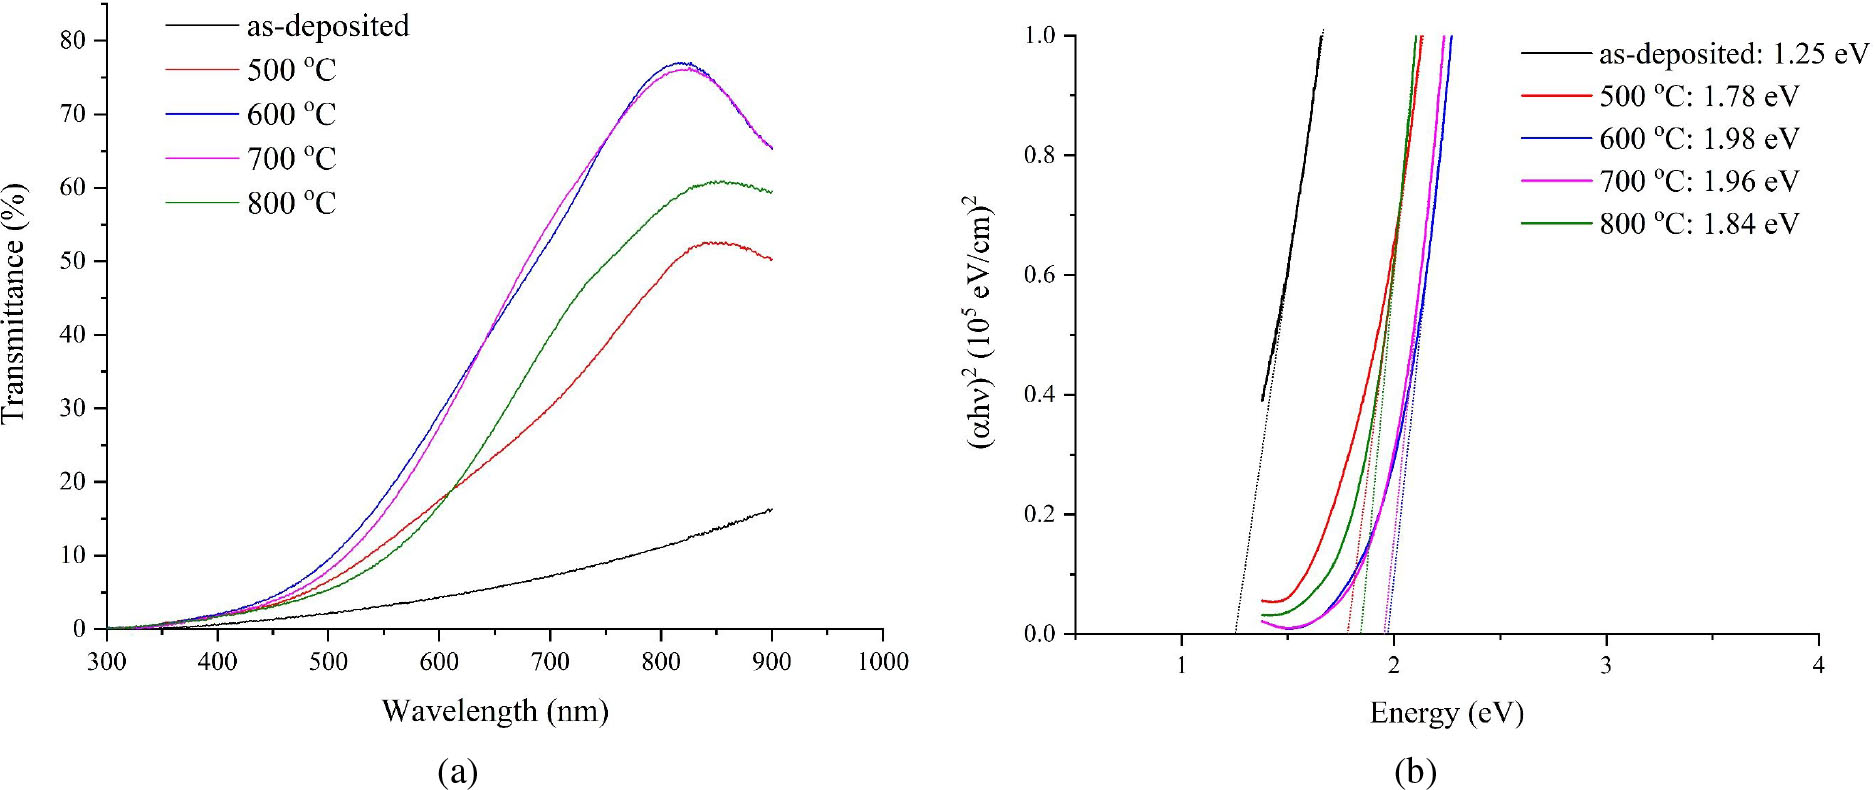
Fig. 6.
(a) Light transmittance of Cu-Cr-O films with different post-annealing temperatures. (b) variation of (αhv)2 versus hv
Table 2.
The carrier concentration, Hall mobility, and electrical resistivity of Cu-Cr-O films as a function of annealing temperature
| Annealing temperature (°C) | Carrier concentration (×1017 cm−3) | Hall Mobility (cm2/V-s) | Electrical resistivity (Ω-cm) |
|---|---|---|---|
| 500 | 2.81 | 0.121 | 183 |
| 600 | 4.05 | 0.373 | 41 |
| 700 | 3.25 | 0.223 | 86 |
| 800 | 0.43 | 0.268 | 540 |