
Table 1
A brief overview of the literature
| S. No. | Process parameters considered | Work material investigated | Work description | Outcome of the investigation |
|---|---|---|---|---|
| 1 | Pulse on time, pulse off time, wire feed rate, current, voltage, thermal conductivity, co-efficient of thermal expansion, density and wire tension [1] | Al 2124 SiCp MMCs | In the WEDM of AlSiCp MMC, DA and ANN-based predicted models for surface roughness and MRR were developed. | With an increase in pulse duration and thermal conductivity, the rate of material removal and surface roughness both increase significantly. The ANN approach gives a better result than DA. |
| 2 | Pulse on time, pulse off time and wire feed [2] | HEA-reinforced aluminium metal–metal composite | The best parameter combination for a better surface finish, a faster MRR and a smaller KW is found using the Taguchi method and an L18 OA. | The pulse ON time has a significant influence on surface roughness (76.70%), KW (41.96%) and MRR (35.37%), and increasing the pulse ON time enhances the response variables. According to results of multi-objective optimisation using the TOPSIS methodology, MRR and surface finish have improved while KW has significantly decreased. |
| 3 | Pulse on time, pulse off time, wire feed, wire tension, current and voltage [3] | AA6061-TiB2 | Studied the effect of reinforcement and wire material on the surface roughness in MMCs. The experiments were carried out using the Taguchi methodology. XRD analysis was used to determine the phase constituents of the work material. | The results of the experiments show that the percentage of particle reinforcement was the most important factor in surface quality (62.04%) and machinability (34.2%). The machinability and surface quality of the TiB2 (5 wt.%) reinforced composite are excellent. Zinc-coated brass wire outperforms plain brass wire. |
| 4 | Pulse on time, pulse off time, wire feed and wire tension [4] | SiCp/Al composite | Prepared casted, coated, annealed and plastic processed wire for WEDM of MMCs. | The use of zinc coating on the wire resulted in increased MRR by 16.67%, reduced surface roughness by 21.18% and reduced wire breakage by 16.67% under the same discharge parameters when compared to brass wire electrode. |
| 5 | Short pulse time, wire feed rate, pulse width, spark gap, servo control mean reference voltage and time between pulses [5] | Al/ZrO2 (p)-metal matrix composite | Surface veracity aspects such as surface defects and recast layer thickness are investigated. | The result finding shows lower value of pulse on/off time, and frequency of pulse plays an important role in surface veracity. |
| 6 | Gap voltage, wire feed, pulse on time and pulse off time [6] | Al-Si12/B4C/fly ash | In WEDM of Al-Si12/B4C/fly ash composites, the effects of control parameters on MRR and surface roughness were examined using the Taguchi and ANOVA methods. | MRR increases as the pulse on time and reinforcement increase. Optimal machining conditions resulted in a maximum MRR of 38.01 mm3/min and a minimum surface roughness of 3.24 m. |
| 7 | Voltage, peak current, wire tension and dielectric pressure [7] | AMMCs with 6% and 8% weight fraction of Al2O3 | AMMC with weight fraction of Al2O3 is machined through WEDM | Based on the TOPSIS approach, the optimal MR and Ra process parameters were ascertained as 1.5 mm/min and 3.648 m, respectively. According to ANOVA, the peak current has a significant influence on MR and Ra. |
| 8 | Pulse on time and pulse off time, gap voltage, peak current and wire feed [8] | Aluminium-based composite materials (AA 7075) with (Al2O3) particles | The effect of wirecut EDM process parameters on MRR and surface roughness of Ni-P-coated and un-coated alumina-reinforced composite materials was investigated. | By combining grey relation analysis with principal component analysis, an ideal set of process parameters was observed. The identified optimal parameters were validated by running confirmation tests, and the experimental results were observed to be in good agreement with the predicted results. |
| 9 | Pulse on time and pulse off time, gap voltage, reinforcement and wire feed [9] | LM5/ZrO2 AMMCs | By using the Taguchi technique, the study sought to determine the optimal wire-EDM machining parameters for achieving maximum MRR, minimum SR and minimum kerf width KW. | The main statistical factors influencing MRR are the gap voltage (29.92%) and pulse on time (64.84%). |
| 10 | Pulse on time and pulse off time, gap voltage, percentage of reinforcement and wire feed [10] | Aluminium (LM25) rein-forced with fly ash and boron carbide (B4C) hybrid composites | WEDM experiments were planned and carried out using the Taguchi methodology's L27 OA approach, and the corresponding MRR and surface roughness were measured. | The grasshopper optimisation algorithm performed better than the others in terms of maximising volume removal rate and minimising surface roughness values, according to the results. |
| 11 | Doping percentage, reinforcement percentage, pulse on time and pulse off time, and wire feed [11] | Magnesium MMC | Investigation in WEDM has been carried out to oversee the effect of process variables on the machining performance parameters such as MRR and Ra of magnesium composite. | The results of the experiment show that increasing the duration of pulse ON and wire feed rate in WEDM increases the MRR. Surface roughness increases noticeably as pulse ON increases. |
| 12 | Cutting speed, feed and depth of cut [12] | Aluminium (AA6061) and alumina powder sized <1 mm with 99.9% purity | The study investigated the effects of varying alumina amounts ranging from 1 wt.% to 5 wt.% added to recycled aluminium chip using hot press forging. Ultimate tensile strength and elongation to failure were the primary responses studied. | The addition of 2 wt.% alumina to the recycled aluminium alloy produced high-quality and consistent results. |
| 13 | Current, pulse on time, wire speed, voltage and pulse off time [13] | SiCp reinforced Al6061 composite | The effect of parameters such as current, pulse on time, wire speed, voltage and pulse off time on wire-EDM machining of 4–8 wt.% SiCp/Al6061 alloy was investigated. | MRR was significantly influenced by current, pulse on time, pulse off time, wire speed and voltage. The MRR increased as the current, pulse on time, wire speed and voltage increased, but it decreased as the pulse off time and wire speed exceeded 700 rpm. |
| 14 | Stirring temperature, stirring speed, stirring time, preheat temperature of reinforced particles, preheat temperature of permanent die and squeeze pressure [14] | AlSi7Mg + alumina; scrap aluminium alloy + alumina; AlSi7Mg + SAC; scrap aluminium alloy + SAC | In the present study, stir-squeeze casting was successfully used to create AMCs using a novel method. The viability of using SAC from oil refineries as reinforcement material and SAAWs as the matrix material was examined. | According to the micrograph analysis, the scrap aluminium alloy alumina composite had the most uniform distribution of reinforcements and the lowest porosity among the four composites. |
| 15 | Current, pulse on time, wire feed rate, pulse off time, ultimate tensile strength and micro hardness [15] | AZ61 magnesium alloy with boron carbide and silicon carbide as an reinforcement with varying percentage levels | The fabricated magnesium MMC is machined through WEDM for MRR and surface roughness. | The highest MRR of 0.212 mm3/s was obtained at pulse on time of 115 μs and pulse off time of 50 μs, and the minimum values of surface roughness were obtained as 1.003942 μm. |
| 16 | Alumina weight percentage, amplitude percentage and pulse time [16] | SAAWs | Using a L9 OA and the Taguchi method, an experimental study was carried out. Multi-objective optimisation based on ratio analysis technique was used for optimisation. | The findings showed that compared to other composites, SAAWs reinforced with 1 weight percent of nanosized alumina particles and 5.5 weight percent of micro sized alumina particles had lower porosity and metal loss (wear), higher hardness, tensile strength, and compressive strength. |
| 17 | Cutting speed, surface topography, surface roughness, recast layer formation, residual stresses and microstructural and metallurgical alterations [17] | Inconel 706 | To determine the feasibility of machining these components, research was carried out on Inconel 706 superalloy using the WEDM process. | Despite the fact that zinc-coated wire improves productivity, hard brass wire was noticed to be advantageous in terms of improved surface quality of machined parts. |
| 18 | Pulse off time, pulse on time, gap voltage and peak current [18] | [Difficult-to-cut materials] | The study concentrated on the impacts of various optimisation techniques, such as single and multi-objective techniques, on difficult-to-cut materials. | Reviewed the recent and early research articles on the WEDM process to cut hard conductive materials along with single response and multi response optimisation. |
| 19 | Pulse off time, pulse on time, gap voltage and peak current [19] | A286 superalloy | Optimised the WEDM performances by particle swarm optimisation. | The best MRR and surface roughness, respectively, were 19.90 mm2/min and 3.49 m. |
| 20 | Pulse off time, pulse on time, gap voltage and peak current [20] | Hard-to-cut materials | Six algorithms, namely MOALO, NSMFO, MODA, MOGWO, MOGOA and NSWOA, are used in the Pareto optimisation of a WEDM process. | The results reveal that MOGWO, MOGOA and MODA can identify the optimum solutions in 47%, 28% and 20% of the situations, respectively. |
[i] AMMCs, aluminium metal matrix composites; ANN, artificial neural network; ANOVA, analysis of variance; DA, dimensional analysis; KW, kerf width; MMC, metal matrix composite; MOALO, multi-objective ant lion optimisation; MODA, multi-objective dragonfly algorithm; MOGOA, multi-objective grasshopper optimisation algorithm; MOGWO, multi-objective grey wolf optimiser; MRR, material removal rate; NSMFO, non-dominated sorting moth flame optimisation; NSWOA, non-dominated sorting whale optimisation algorithm; OA, orthogonal array; SAAWs, scrap aluminium alloy wheels; SAC, spent alumina catalyst
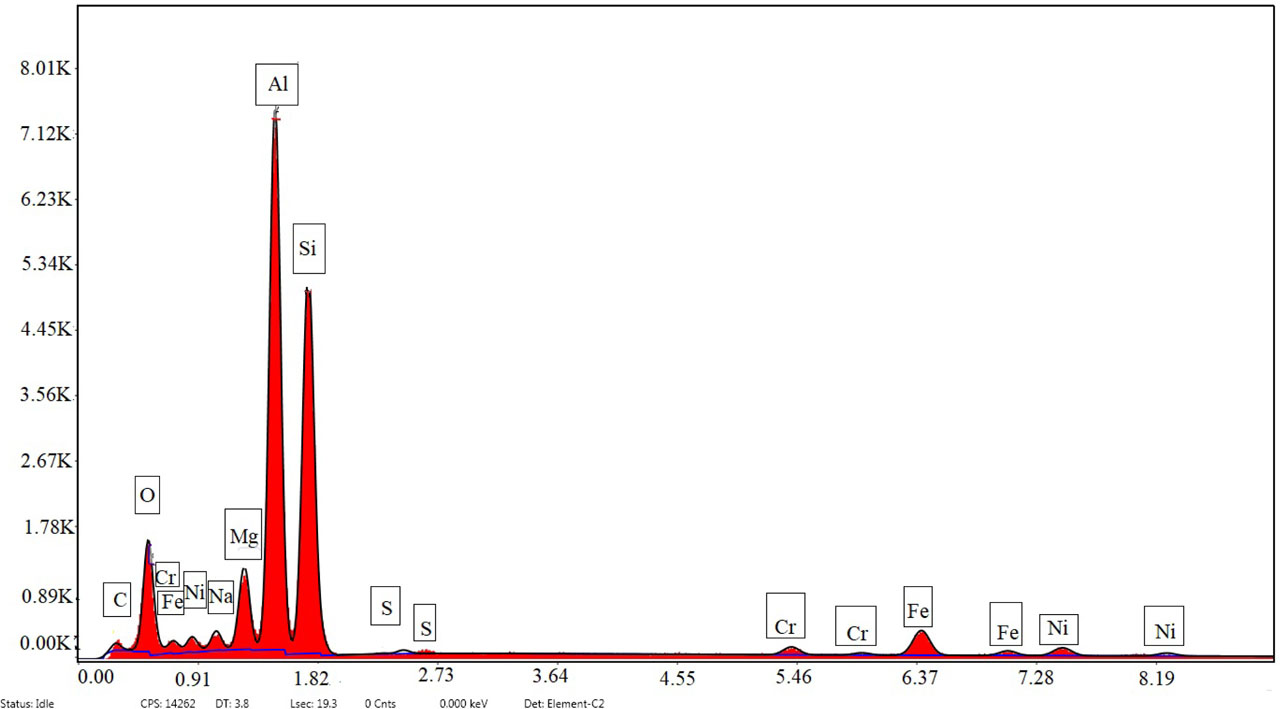
Fig. 1
EDX analysis of AMMC. AMMC, aluminium metal matrix composite; EDX, energy-dispersive X-ray
Table 2
Chemical compositions of composite materials
| Element | Weight percentage | Atomic percentage | Error percentage |
|---|---|---|---|
| C K | 4.49 | 9.08 | 21.36 |
| O K | 16.53 | 25.11 | 9.43 |
| Na K | 1.86 | 1.96 | 11.36 |
| Mg K | 5.01 | 5.01 | 6.53 |
| Al K | 31.72 | 28.58 | 4.71 |
| Si K | 29.47 | 25.5 | 6.15 |
| S K | 0.07 | 0.05 | 29.63 |
| Cr K | 1.44 | 0.67 | 12.35 |
| Fe K | 6.53 | 2.84 | 5.11 |
| Ni K | 2.9 | 1.2 | 10.1 |
Table 3
Control variables and their levels
| Control variables | Symbols | Units | Level 1 | Level 2 | Level 3 | Level 4 | Level 5 |
|---|---|---|---|---|---|---|---|
| Voltage | V | V | 30 | 40 | 50 | 60 | 70 |
| Wire feed rate | Fw | mm/min | 3 | 4 | 5 | 6 | 7 |
| Current | Ip | A | 10 | 15 | 20 | 25 | 30 |
| Pulse on time | ONT | μs | 100 | 105 | 110 | 115 | 120 |
| Pulse off time | OFFT | μs | 50 | 55 | 60 | 65 | 70 |
Table 4
Performance measure of wire breakage
| Ex. No. | V | Fw | IP | ONT | OFFT | First incidence of wire breakage in seconds |
|---|---|---|---|---|---|---|
| 1 | 30 | 7 | 30 | 120 | 70 | 304 |
| 2 | 40 | 7 | 30 | 120 | 70 | 60 |
| 3 | 50 | 7 | 30 | 120 | 70 | 32 |
| 4 | 60 | 7 | 30 | 120 | 70 | 27 |
| 5 | 70 | 7 | 30 | 120 | 70 | 22 |
| 6 | 70 | 3 | 30 | 120 | 70 | - |
| 7 | 70 | 4 | 30 | 120 | 70 | 28 |
| 8 | 70 | 5 | 30 | 120 | 70 | 21 |
| 9 | 70 | 6 | 30 | 120 | 70 | 19 |
| 10 | 70 | 7 | 30 | 120 | 70 | 15 |
| 11 | 70 | 7 | 10 | 120 | 70 | 727 |
| 12 | 70 | 7 | 15 | 120 | 70 | 32 |
| 13 | 70 | 7 | 20 | 120 | 70 | 26 |
| 14 | 70 | 7 | 25 | 120 | 70 | 23 |
| 15 | 70 | 7 | 30 | 120 | 70 | 21 |
| 16 | 70 | 7 | 30 | 100 | 70 | 1114 |
| 17 | 70 | 7 | 30 | 105 | 70 | 847 |
| 18 | 70 | 7 | 30 | 110 | 70 | 30 |
| 19 | 70 | 7 | 30 | 115 | 70 | 25 |
| 20 | 70 | 7 | 30 | 120 | 70 | 19 |
| 21 | 70 | 7 | 30 | 120 | 50 | 120 |
| 22 | 70 | 7 | 30 | 120 | 55 | 90 |
| 23 | 70 | 7 | 30 | 120 | 60 | 8 |
| 24 | 70 | 7 | 30 | 120 | 65 | 7 |
| 25 | 70 | 7 | 30 | 120 | 70 | 6 |
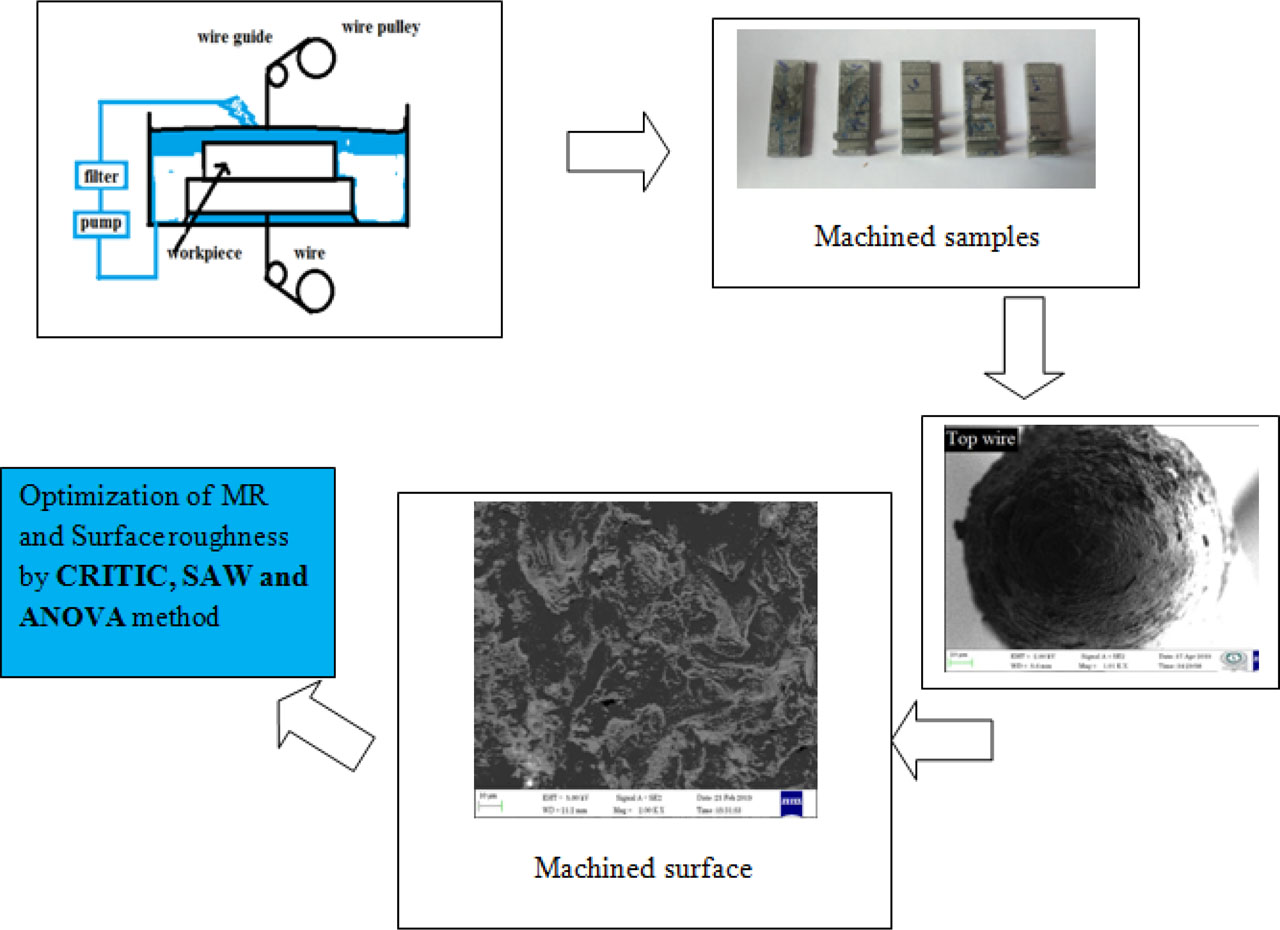
Fig. 2
Overview of the experimental work and methodology. ANOVA, analysis of variance; CRITIC, CRiteria Importance Through Intercriteria Correlation; MR, machining rate; SAW, simple additive weighting
Table 5
Parameters and their levels chosen for optimisation
| Control variables | Symbols | Units | Level 1 | Level 2 | Level 3 |
|---|---|---|---|---|---|
| Voltage | V | V | 30 | 50 | 70 |
| Wire feed rate | Fw | mm/min | 3 | 5 | 7 |
| Current | Ip | A | 10 | 20 | 30 |
| Pulse on time | ONT | μs | 100 | 110 | 120 |
| Pulse off time | OFFT | μs | 50 | 60 | 70 |
Table 6
L18 OA
| Exp. No. | V | Fw | Ip | ONT | OFFT | MR mm/min | Surface roughness (Ra) μm |
|---|---|---|---|---|---|---|---|
| 1 | 30 | 3 | 10 | 100 | 50 | 1.02 | 3.600 |
| 2 | 30 | 5 | 20 | 110 | 60 | 1.02 | 3.795 |
| 3 | 30 | 7 | 30 | 120 | 70 | 1.52 | 3.748 |
| 4 | 50 | 3 | 10 | 110 | 60 | 0.9 | 3.218 |
| 5 | 50 | 5 | 20 | 120 | 70 | 1.25 | 3.789 |
| 6 | 50 | 7 | 30 | 100 | 50 | 1.24 | 3.780 |
| 7 | 70 | 3 | 20 | 100 | 70 | 1.04 | 3.392 |
| 8 | 70 | 5 | 30 | 110 | 50 | 0.85 | 3.392 |
| 9 | 70 | 7 | 10 | 120 | 60 | 1.06 | 3.722 |
| 10 | 30 | 3 | 30 | 120 | 60 | 0.85 | 3.570 |
| 11 | 30 | 5 | 10 | 100 | 70 | 1.28 | 3.575 |
| 12 | 30 | 7 | 20 | 110 | 50 | 1.35 | 3.405 |
| 13 | 50 | 3 | 20 | 120 | 50 | 0.82 | 3.532 |
| 14 | 50 | 5 | 30 | 100 | 60 | 0.92 | 3.420 |
| 15 | 50 | 7 | 10 | 110 | 70 | 1.23 | 3.228 |
| 16 | 70 | 3 | 30 | 110 | 70 | 0.76 | 3.729 |
| 17 | 70 | 5 | 10 | 120 | 50 | 0.88 | 3.686 |
| 18 | 70 | 7 | 20 | 100 | 60 | 1.06 | 3.370 |
[i] OA, orthogonal array
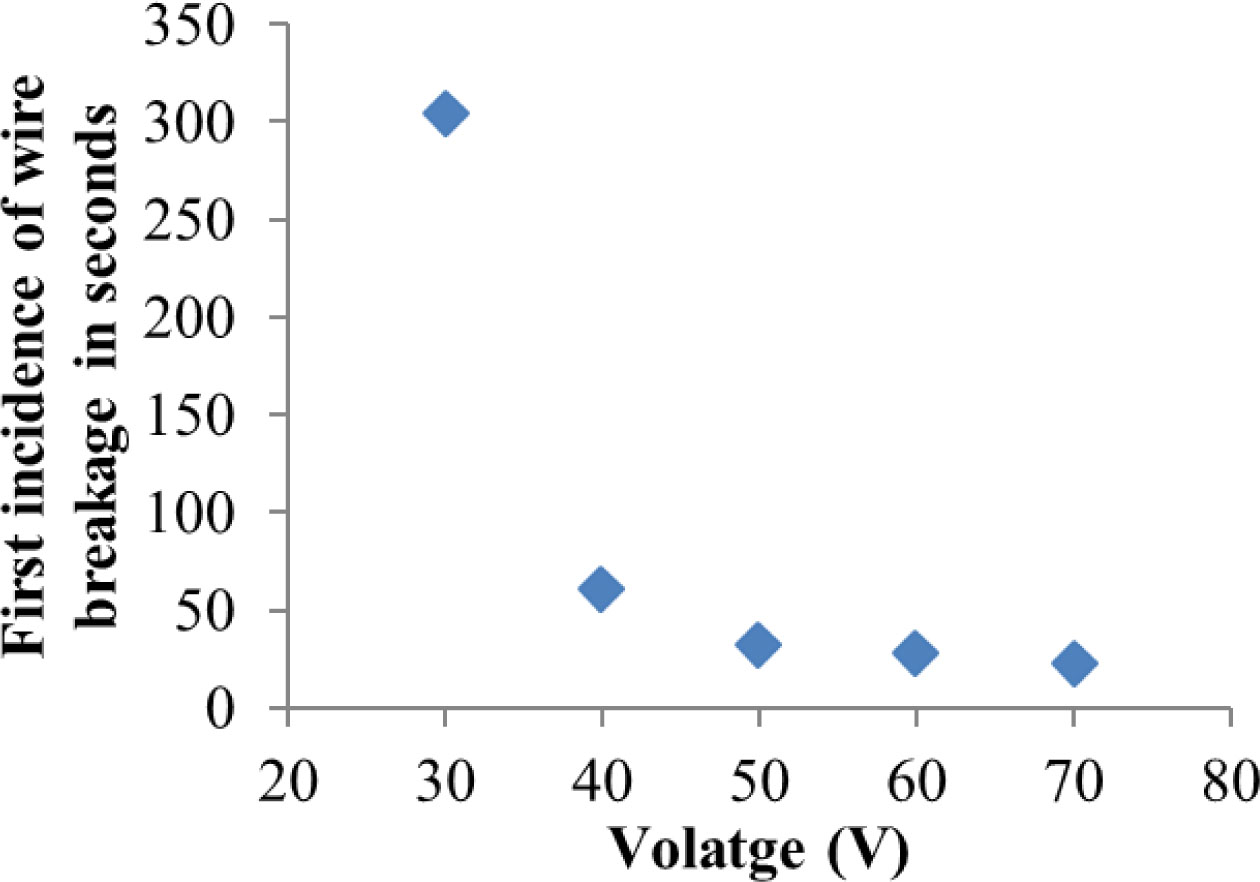
Fig. 3
Effect of voltage on the first incidence of wire breakage at 7 mm/min, 30 A, 120 μs (ONT) and 70 μs
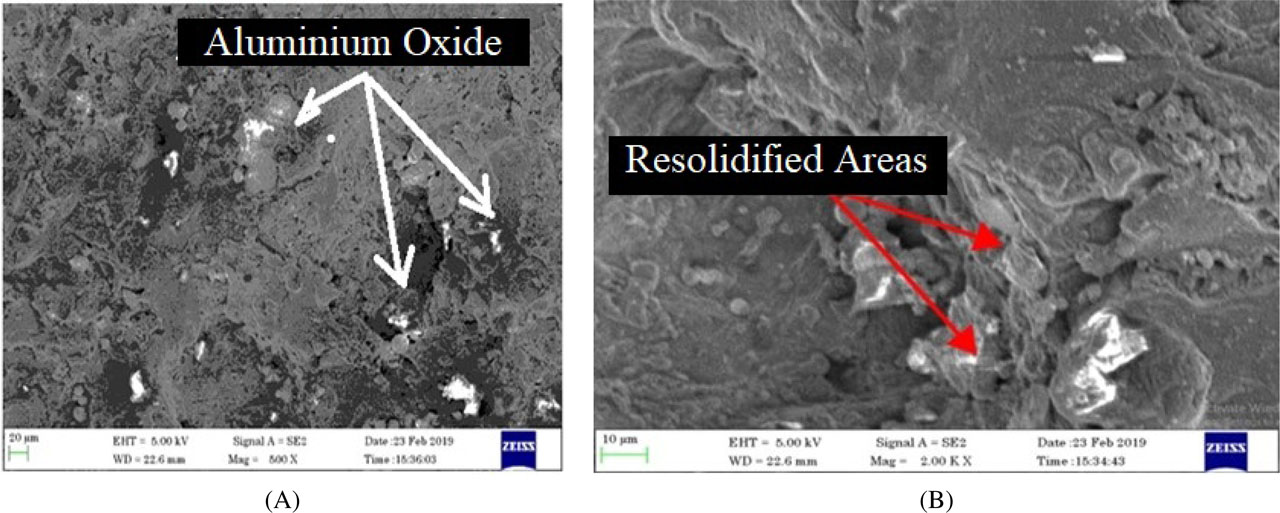
Fig. 4
(A, B) SEM image of machined surface at 30 V, 7 mm/min, 30 A, 120 μs and 70 μs. SEM, scanning electron microscopy
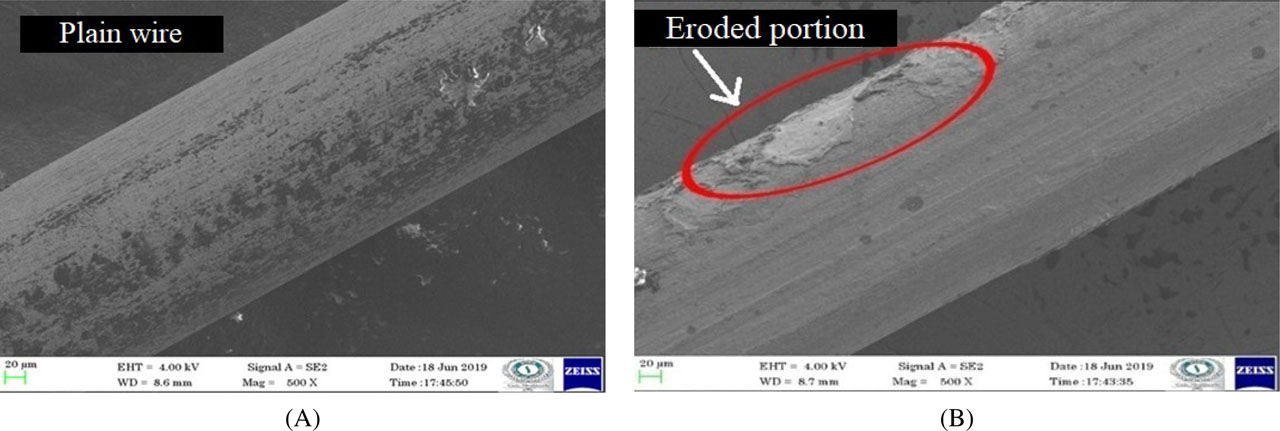
Fig. 5
(A, B) SEM images of wire electrode surface after completing machining of the slot at conditions of 70 V, 3 mm/min, 30 A, 120 μs (ONT) and 70 μs. SEM, scanning electron microscopy
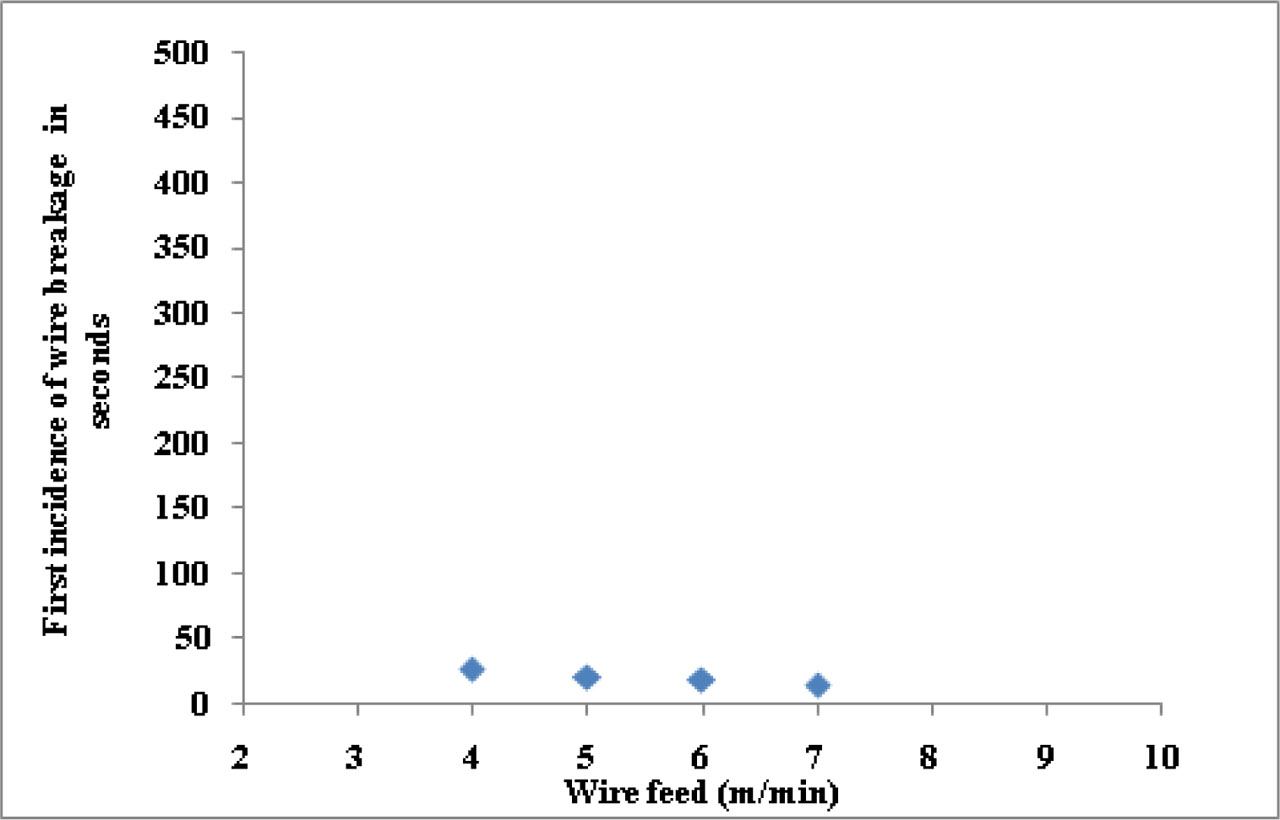
Fig. 6
Wire behaviour effect between wire feed and first incidence of wire breakage
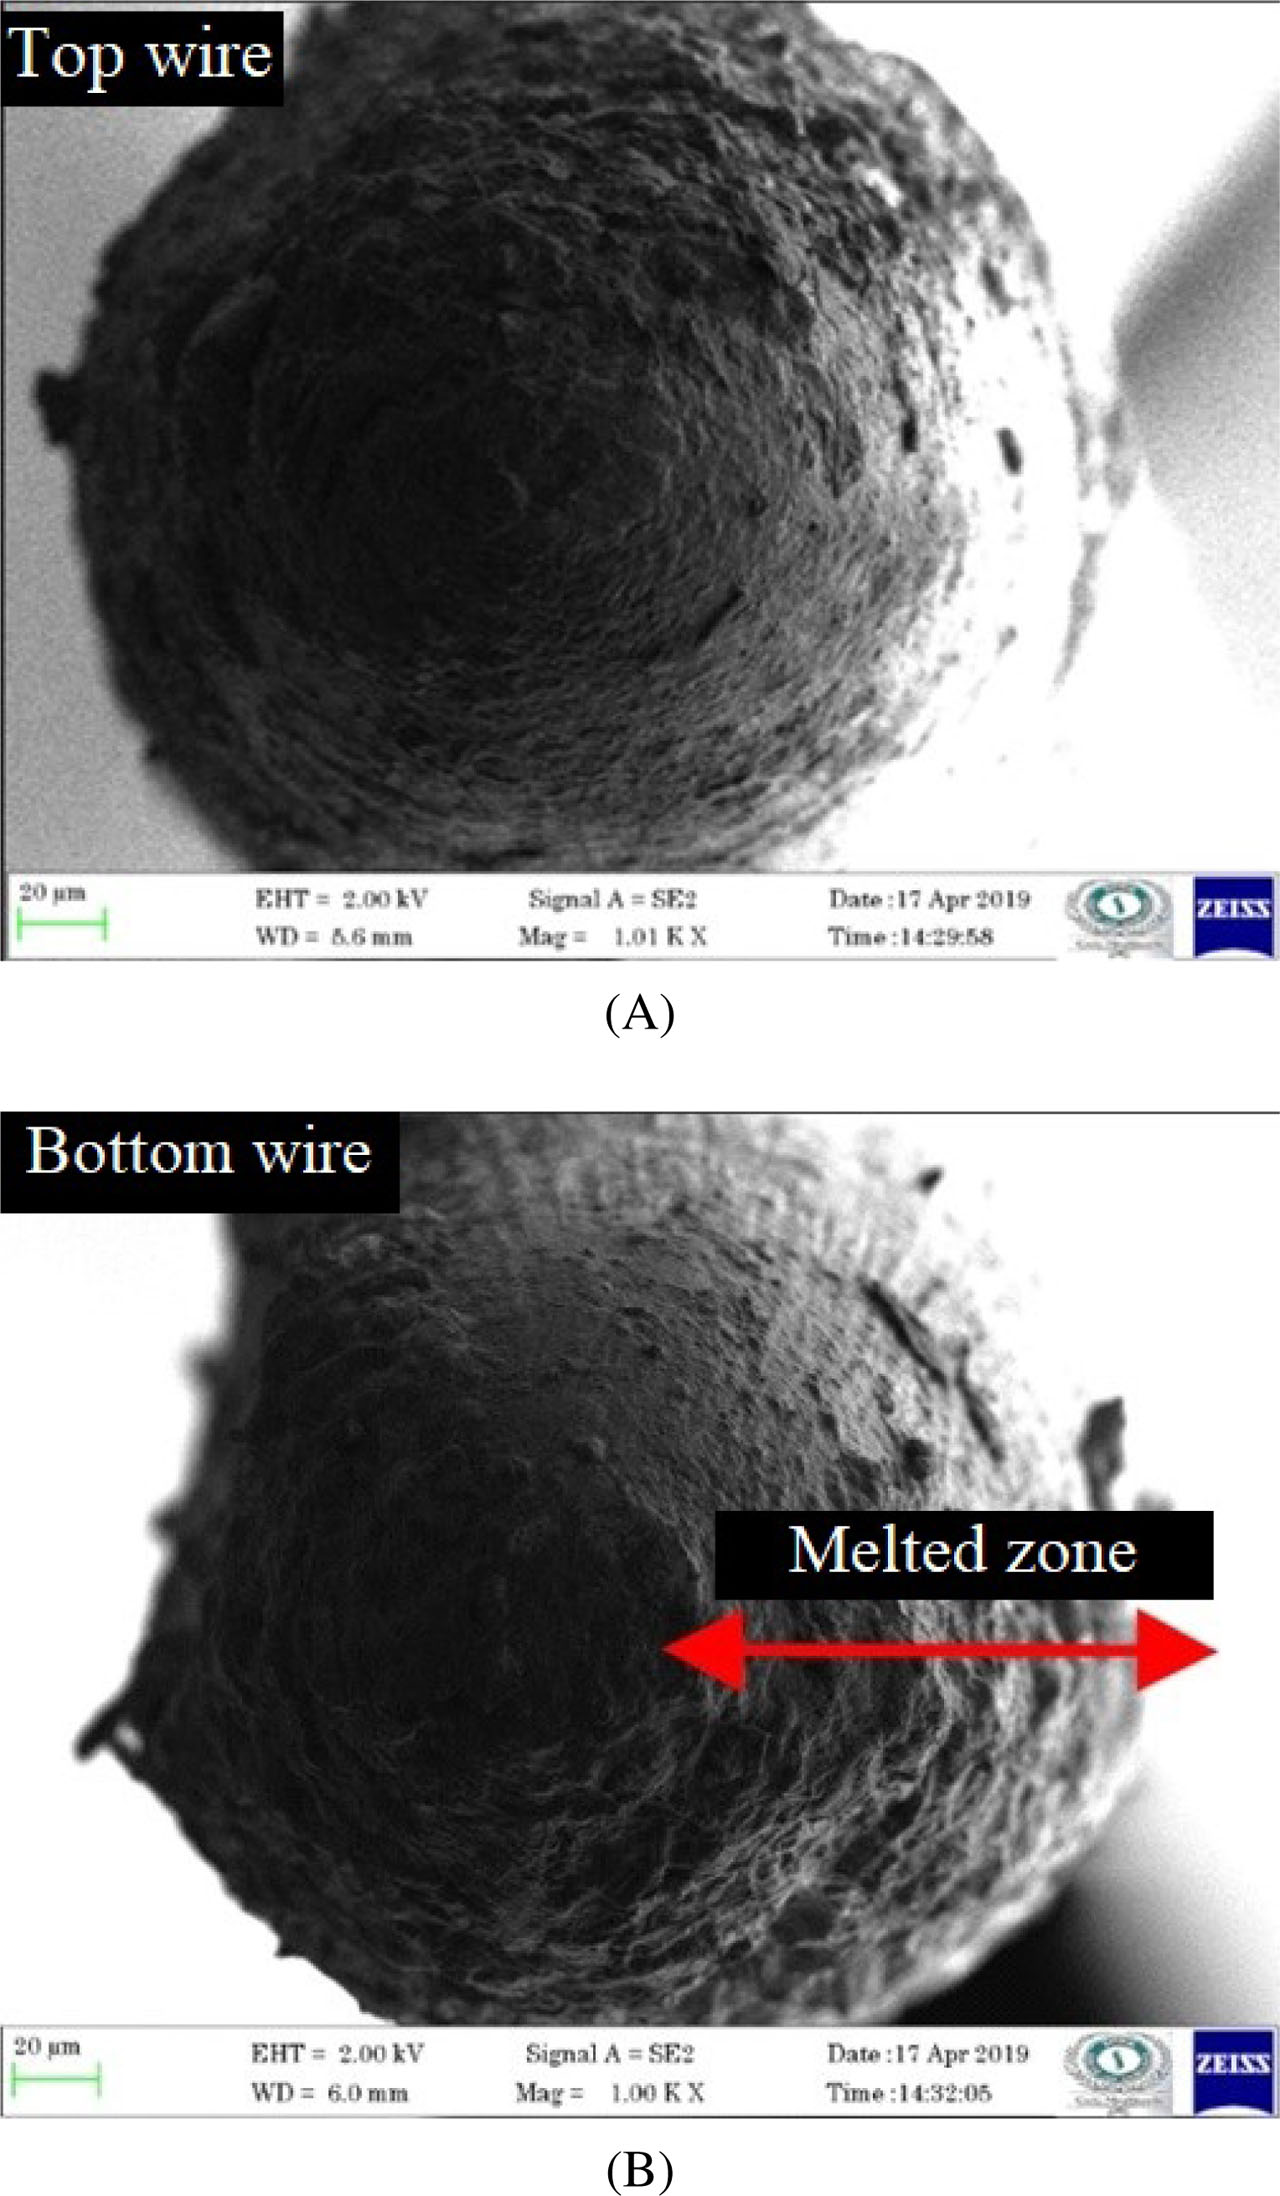
Fig. 7
Cross-sectional view of the eroded and broken wire: (A) top portion and (B) bottom portion at 70 V, 7 mm/min, 30 A, 120 μs (ONT) and 70 μs
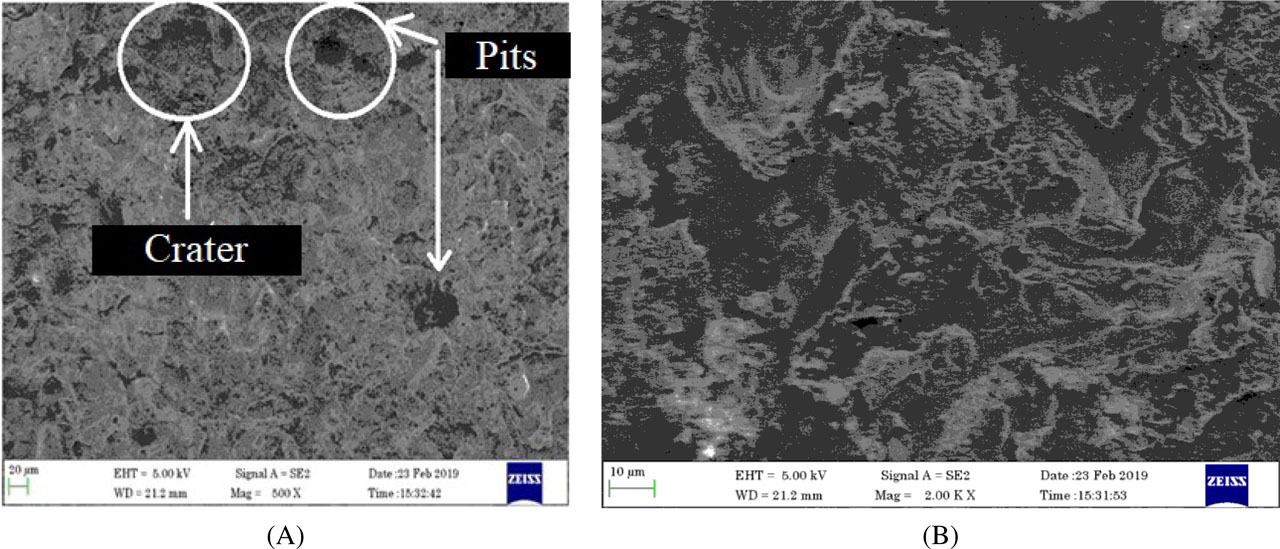
Fig. 8
(A,B) SEM image of machined surface at the parametric combination of 70 V, 3 mm/min, 30 A, 120 μs (ONT) and 70 μs. SEM, scanning electron microscopy
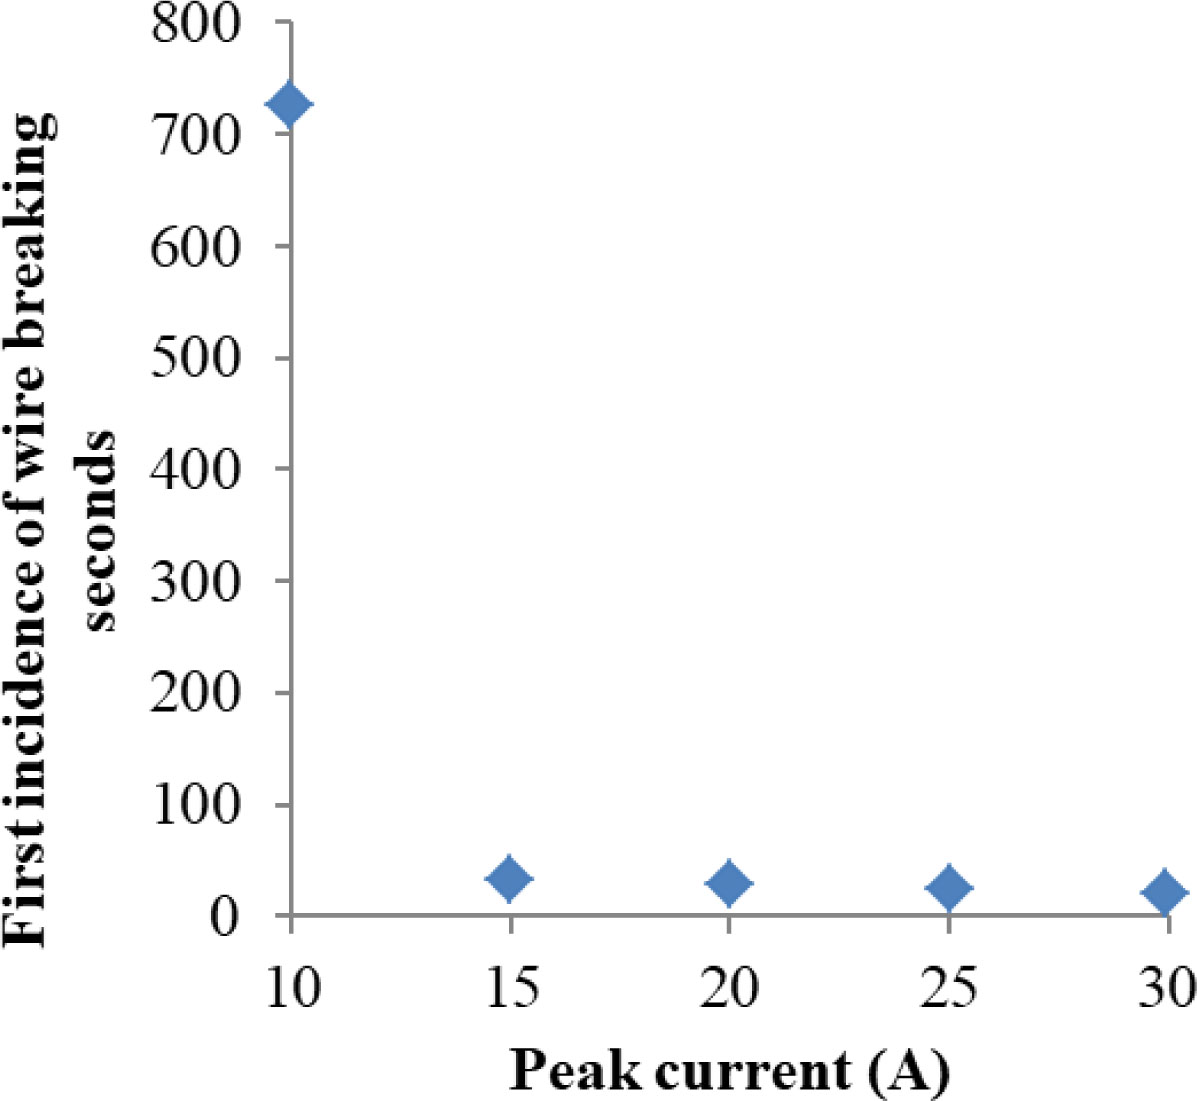
Fig. 9
Effect of peak current on the first occurrence of wire breakage
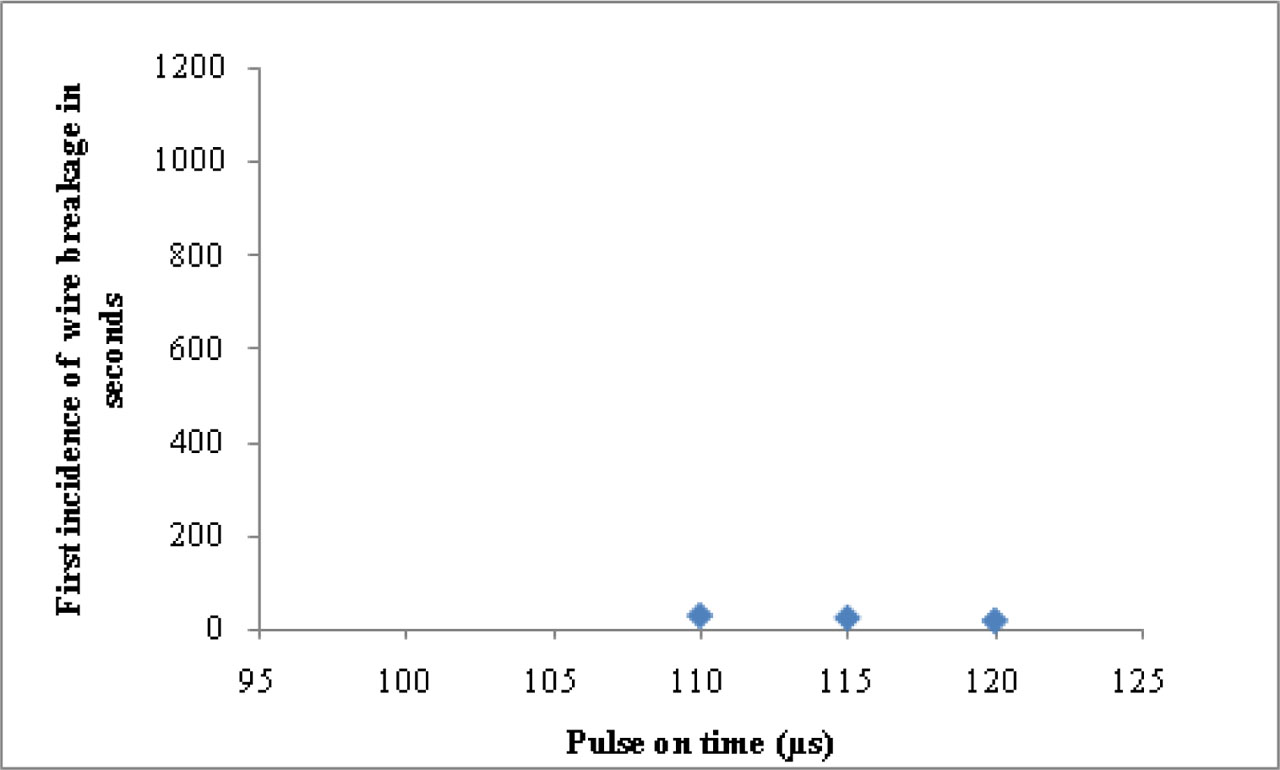
Fig. 10
Wire behaviour effect for various pulse on time
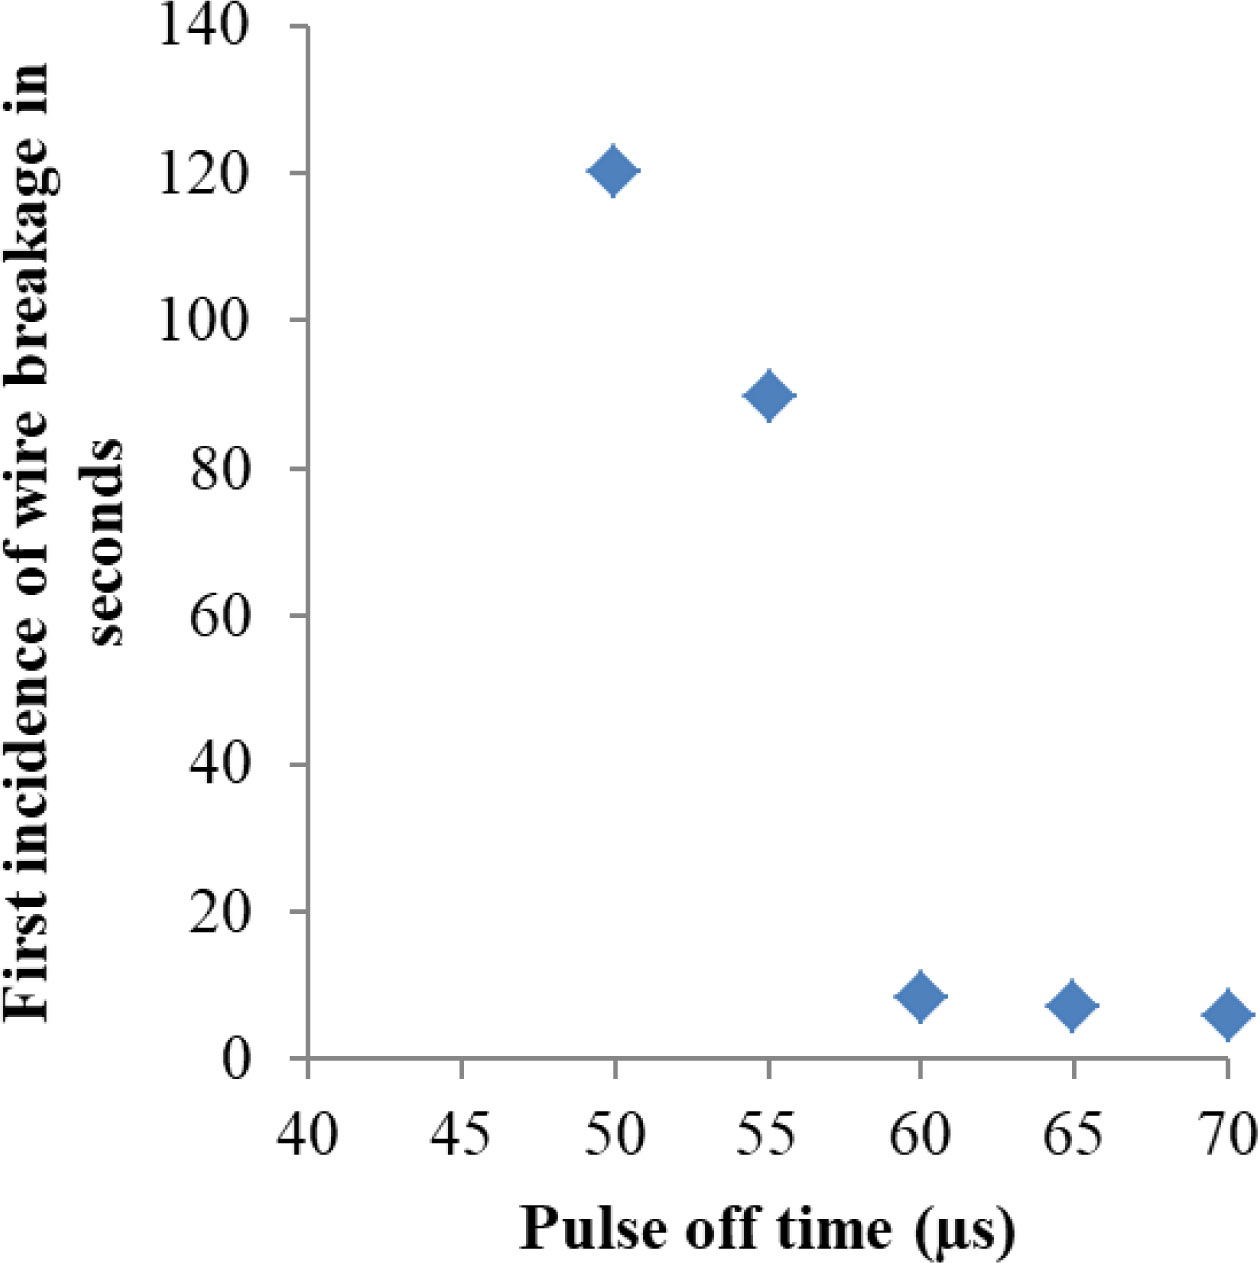
Fig. 11
Effect of pulse off time on the wire behaviour (70 V, 7 mm/min, 310 A and 120 μs [ONT ])
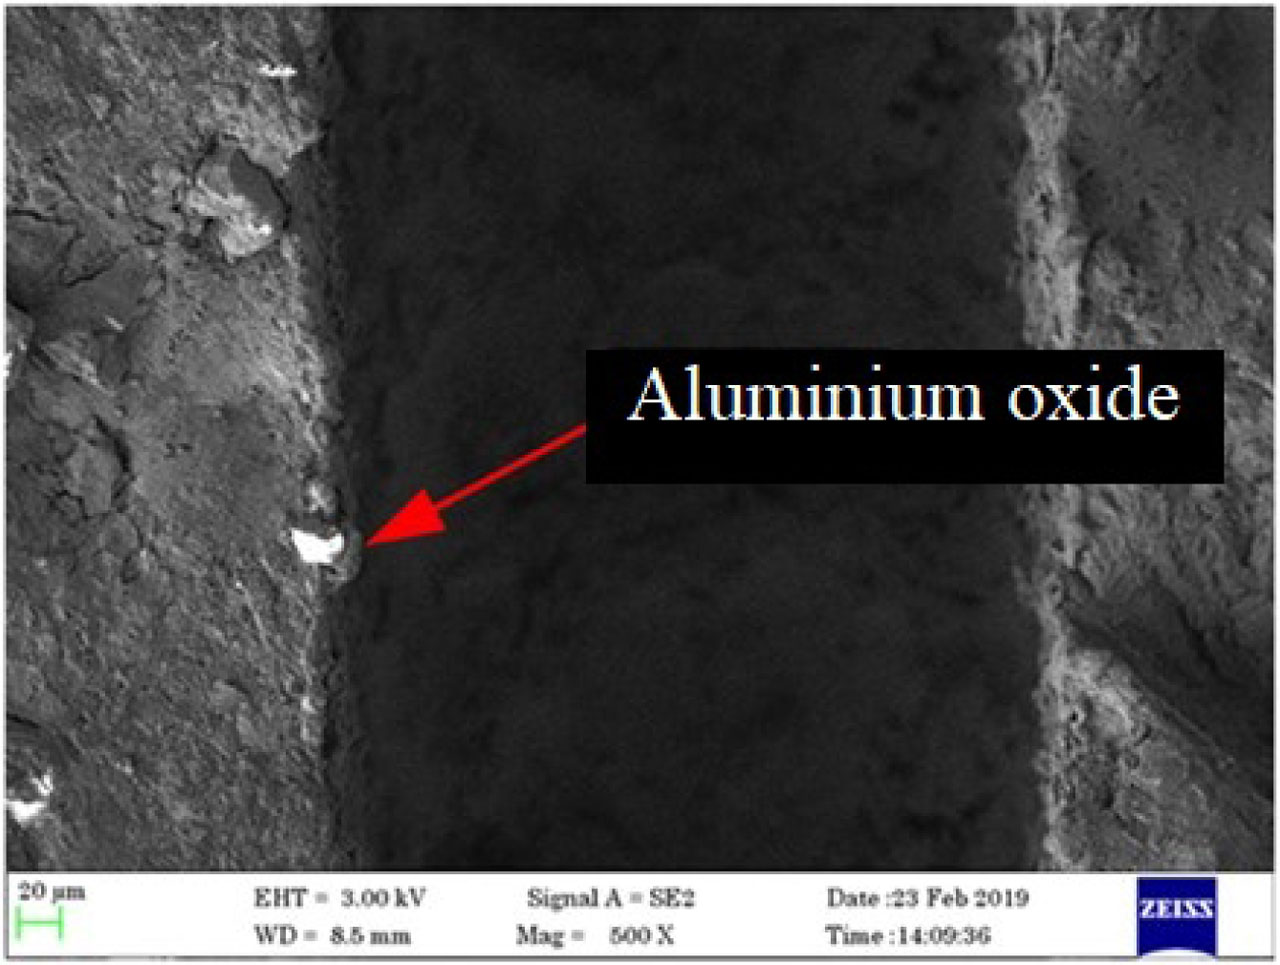
Fig. 12
SEM graph of the machined slot at an experimental condition of 70 V, 7 mm/min, 310 A, 120 μs (ONT) and 50 μs. SEM, scanning electron microscopy
Table 7
Standard deviation, criterion value and weighted value
| Criteria | Standard deviation, σ | Quantity of information, dq | Weight value, Wq |
|---|---|---|---|
| MR | 0.2779 | 0.3200 | 0.4549 |
| Surface roughness, Ra | 0.3329 | 0.3833 | 0.5450 |
[i] MR, machining rate
Table 8
Normalised decision matrix for the CRITIC and SAW methods
| Normalised values by the CRITIC method | Normalised values by the SAW method | Bp | Ranking | ||
|---|---|---|---|---|---|
| 0.3421 | 0.3379 | 0.2230 | 0.2385 | 0.7925 | 10 |
| 0.3421 | 0 | 0.2230 | 0.2514 | 0.7675 | 14 |
| 1 | 0.0814 | 0.3323 | 0.2483 | 0.9229 | 1 |
| 0.1842 | 1 | 0.1967 | 0.2131 | 0.8144 | 9 |
| 0.6447 | 0.0104 | 0.2733 | 0.2510 | 0.8370 | 6 |
| 0.6315 | 0.026 | 0.2711 | 0.2504 | 0.8351 | 7 |
| 0.3684 | 0.6984 | 0.2273 | 0.2247 | 0.8284 | 8 |
| 0.1184 | 0.6984 | 0.1858 | 0.2247 | 0.7715 | 13 |
| 0.3947 | 0.1265 | 0.2317 | 0.2465 | 0.7885 | 11 |
| 0.1184 | 0.3899 | 0.1858 | 0.2365 | 0.7457 | 15 |
| 0.6842 | 0.3812 | 0.2798 | 0.2368 | 0.8737 | 4 |
| 0.7763 | 0.6759 | 0.2951 | 0.2255 | 0.9192 | 2 |
| 0.0789 | 0.4558 | 0.1792 | 0.234 | 0.7420 | 16 |
| 0.2105 | 0.6499 | 0.2011 | 0.2265 | 0.7882 | 12 |
| 0.6184 | 0.9826 | 0.2689 | 0.2138 | 0.9115 | 3 |
| 0 | 0.1143 | 0.1661 | 0.2470 | 0.6978 | 18 |
| 0.1578 | 0.1889 | 0.1924 | 0.2442 | 0.7392 | 17 |
| 0.3947 | 0.7365 | 0.2317 | 0.2232 | 0.8377 | 5 |
[i] CRITIC, CRiteria Importance Through Intercriteria Correlation; SAW, simple additive weighting
Table 9
ANOVA results for MR and Ra
| Source of variation | Degree of freedom | Sum of squares | Mean sum of squares | F value | p value | % of Contribution |
|---|---|---|---|---|---|---|
| Surface roughness | ||||||
| Voltage (V) | 2 | 0.04409 | 0.022046 | 0.43 | 0.669 | 7.03 |
| Wire feed rate | 2 | 0.03265 | 0.016323 | 0.32 | 0.739 | 5.21 |
| Current | 2 | 0.03130 | 0.015649 | 0.30 | 0.748 | 4.99 |
| Pulse on time | 2 | 0.14463 | 0.072317 | 1.40 | 0.308 | 23.06 |
| Pulse off time | 2 | 0.01268 | 0.006342 | 0.12 | 0.886 | 2.02 |
| Error | 7 | 0.36188 | 0.051698 | 57.69 | ||
| Total | 17 | 0.62724 | 100 | |||
| MR | ||||||
| Voltage (V) | 2 | 0.16103 | 0.080517 | 9.28 | 0.011 | 21.23 |
| Wire feed rate | 2 | 0.36270 | 0.181350 | 20.90 | 0.001 | 47.82 |
| Current | 2 | 0.01343 | 0.006717 | 0.77 | 0.497 | 1.77 |
| Pulse on time | 2 | 0.01710 | 0.008550 | 0.99 | 0.420 | 2.25 |
| Pulse off time | 2 | 0.14343 | 0.071717 | 8.26 | 0.014 | 18.91 |
| Error | 10 | 0.06075 | 0.008679 | 8.01 | ||
| Total | 17 | 0.75845 | 100.00 | |||
[i] ANOVA, analysis of variance; MR, machining rate