
Pistachio (Pistacia vera L.), a member of the Anacardiaceae family, represents one of the most economically significant nut crops globally, with cultivation spanning semi-arid regions across multiple continents. The global production of pistachios has increased dramatically over the past few decades, from around 50 thousand tons in 1970 to more than 1 million tons in 2020 (FAOSTAT, 2023). Based on FAOSTAT data, the most significant increases in area of cultivation occurred in Jordan, Madagascar, Kyrgyzstan, California, Turkey, Uzbekistan, Azerbaijan, and Mexico (FAOSTAT, 2023). However, Iran, Turkey, and the USA continue to maintain the highest pistachio production globally. The edible seed is fixed within a drupe, protected by a thin endocarp, and has attracted human attention for millennia (Eshankulov, 2017). The pistachio is sometimes called the golden tree in Turkey, Iran, and Syria, referencing its economic value (Eshankulov, 2017). Pistacia vera is a diploid (2n = 30), xerophytic, subtropical woody perennial; it is wind-pollinated, avian-dispersed, deciduous, and dioecious (Hormaza and Wünsch, 2007; Khanazarov et al., 2009). The species lineage dates back to between 1.82 and 3.38 million years ago (Xie et al., 2014). It is both heat tolerant and cold resistant (Khanazarov et al., 2009), growing in semi-arid deserts and dry mountain slopes (Vavilov, 1967). Its deeply penetrating roots allow it to weather arid periods (Whitehouse, 1957), and jasmonic acid production provides salt tolerance (Zeng et al., 2019). Studies conclude that the crop originated in Central Asia, where the only extant wild populations occur (Whitehouse, 1957; Zohary, 1952; Khanazarov et al., 2009). The current wild range covers foothill zones in Turkmenistan, Uzbekistan, Tajikistan, Kyrgyzstan, southeastern Kazakhstan, northern Afghanistan, and northeastern Iran (Zohary, 1952; Khanazarov et al., 2009). Wild pistachios grow along a narrow ecoline between 500 and 800 masl in Central Asia (Khanazarov et al., 2009), though they may be found at extremes of 450 or 2000 masl (Zhukovsky, 1971). The northern Tian-Shan Region, covering around 30,000 ha, is mainly distributed in northwestern Kyrgyzstan on foothills (800–1600 masl) of the Fergana and Chingir-Tash mountains (Kayimov et al., 2011). Talebi et al. (2012) linked high genetic diversity among P. vera to different geographic distribution zones, highlighting the importance of these natural populations as genetic resources.
The domestication and breeding history of pistachio differs fundamentally from that of annual grain crops, as it illustrates very different concepts of land tenure, trans-generational forethought, and complex cultivation practices, including grafting and artificial pollination (Miller, 2008). Historically, pistachio cultivation has primarily relied on grafting, suggesting that, as with many Eurasian tree crops, domestication resulted from genetically locking hybrids or favored individuals in place (Zohary and Spiegel-Roy, 1975). The most commercially available pistachio cultivars worldwide are the result of the selection of chance seedlings (Parfitt et al., 1995), with prominent varieties such as Kerman, Ohadi, and Siirt obtained through selection breeding programs in their respective countries. The delay in dispersal of pistachios may be due to its reproductive biology, notably a need for mating pairs, large closely clustered populations to facilitate wind pollination, and knowledge of grafting and artificial propagation for maintaining clonal variants (Vargas et al., 2008). As a dioecious and wind-pollinated plant, early pistachio cultivators would have had to transplant a full population of multiple male and female plants into a suitable new area rather than simply collect a few seeds. Today, only 300,000 ha of Central Asia is covered with wild P. vera (Chernova, 2004), but a few centuries ago, much larger territories were populated with pistachio groves. In the 1950s, Whitehouse (1957) reported that "the pistachio is seen everywhere from mountainous Bokhara through the region of Samarkand and the whole of Fergana up to the western Tian-Shan", indicating the historical abundance of these genetic resources in the region.
Kyrgyzstan possesses substantial pistachio genetic resources within its natural wild populations, yet these remain largely unexploited for systematic improvement. Despite ranking tenth globally in pistachio production with approximately 921 tonnes in 2023 (FAOSTAT, 2023), Kyrgyzstan does not have any registered improved pistachio varieties. Approximately 40,000 hectares of pistachio trees grow from seed without grafting across the mountainous regions of the country, representing a vast untapped genetic resource. Selection breeding, being the oldest and most straightforward breeding method, offers a practical approach for genetic improvement in countries where sophisticated breeding infrastructure may be limited. The natural populations in Kyrgyzstan's Tian-Shan region provide an ideal setting for selection programs, as they harbor significant phenotypic and genetic variation shaped by diverse environmental conditions. Therefore, the aim of this study was to evaluate the morphological and pomological diversity among naturally growing pistachio genotypes in the mountainous regions near Kuduk-Sai village, Nooken district, Jalal-Abad region, Kyrgyzstan, and to identify promising superior genotypes using multivariate statistical approaches including a Composite Performance Index (CPI) based on key traits such as nut size, inshell weight, split ratio, shell thickness, and kernel yield.
This research was conducted during 2021 and 2024, with a two-year periodicity observed between the study years. The study site is located at coordinates 41.217889°N, 72.238854°E, at an elevation ranging from 634 to 685 meters above sea level, encompassing a total area of 80 hectares (Fig. 1). The research was carried out in a naturally established pistachio (Pistacia vera L.) forest, where trees originated from spontaneously dispersed seeds through natural vectors including birds and grazing animals such as goats. Trees of varying ages (5–150 years) were sampled to maximize genetic diversity across natural regeneration cohorts. Age estimation was based on trunk diameter and stand history records. While tree age and microsite conditions may influence phenotypic expression, this study focused on preliminary screening of genetic variability rather than isolating age or environmental effects. The region is characterized by arid climatic conditions with annual precipitation ranging from 300 to 350 mm. The soil exhibits high calcium carbonate content, typical of calcareous substrates in semi-arid regions. No other tree species naturally coexist in this monospecific pistachio forest ecosystem. The irregular spatial distribution of trees, with inter-tree distances varying from 1.0 to 30 meters, reflects the stochastic nature of seed dispersal and establishment, resulting in an average stand density of approximately 200 trees per hectare.
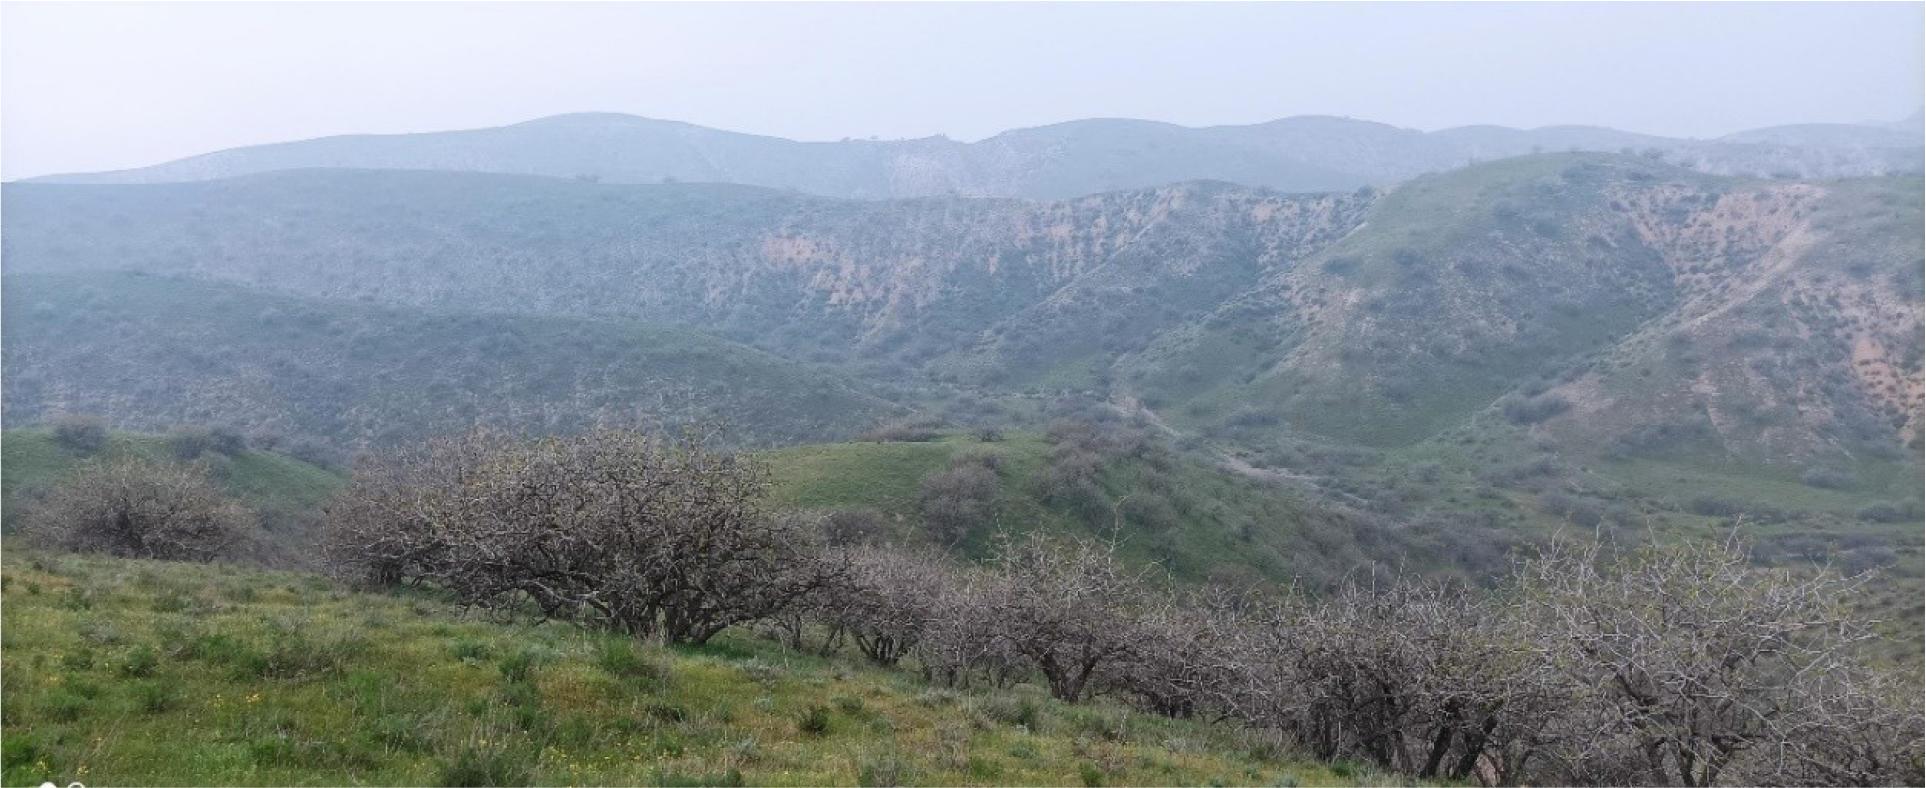
An image from the area under investigation (original)
The forest contains approximately 17,500 pistachio trees, with a sex ratio of approximately 60% female and 40% male trees. Among the female population, 80-90% exhibited fruit-bearing capacity during the study period. The trees receive no anthropogenic management interventions and develop entirely under natural conditions without supplementary irrigation, fertilization, pruning, or pest management practices. The forest serves dual ecological and socioeconomic functions, providing erosion control on steep slopes while supporting local livelihoods through fruit harvest.
A comprehensive field survey was conducted across the entire 80-hectare study area to identify superior genotypes based on fruit-bearing performance and preliminary visual assessment. Male trees were systematically excluded from the selection process. Among fruit-bearing female trees, 169 promising genotypes were identified and marked in the initial year (2021) based on apparent fruit quality characteristics. From these marked genotypes, 50 representative fruit samples were collected for detailed laboratory analysis. Pomological evaluation included comprehensive morphometric and quality assessments of the following parameters: fruit length, thickness, and width (mm); in-shell weight (g); 100-nuts weight (g); kernel color characteristics; splitting percentage (%); shell thickness (mm); kernel weight (g); and kernel ratio (%). These quantitative and qualitative evaluations were designed to identify genotypes with superior characteristics suitable for potential domestication or germplasm conservation, thereby contributing to the genetic improvement of pistachio cultivation in the region while preserving valuable genetic diversity present in this naturally evolved population (Fig. 2).
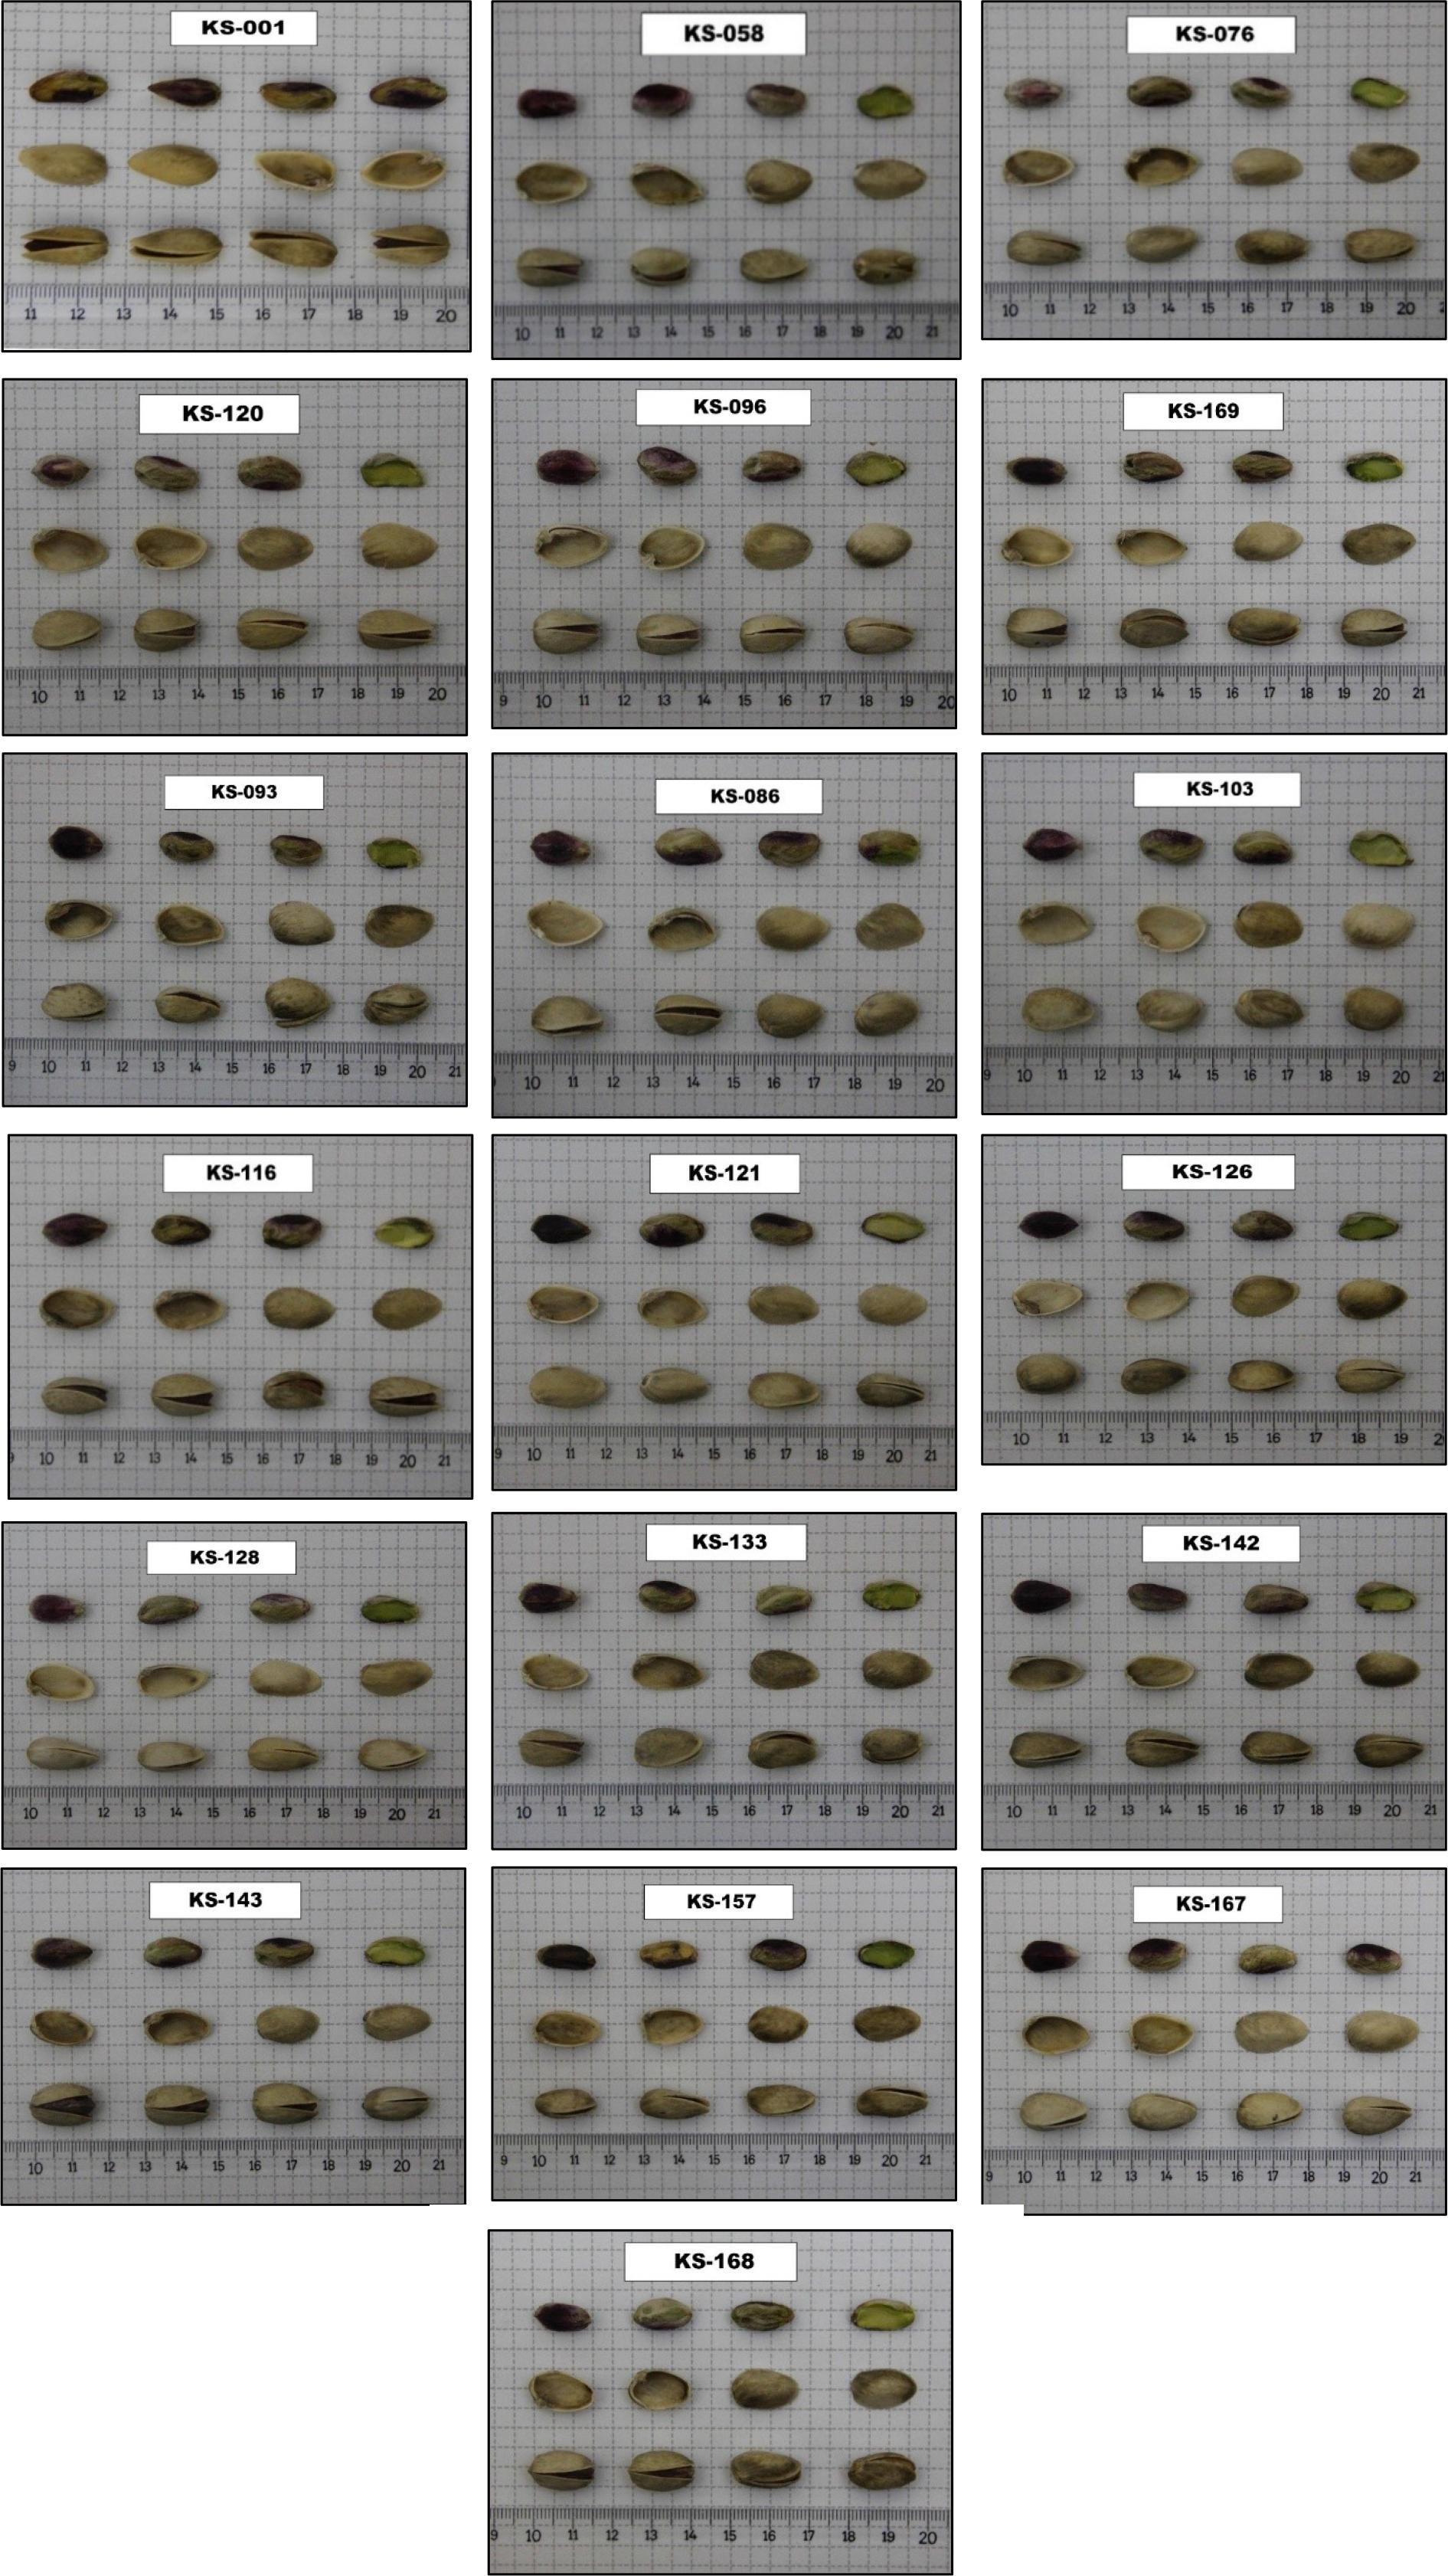
Appearances of 19 promising pistachio genotypes (original images)
A total of 169 pistachio (Pistacia vera L.) genotypes were evaluated based on five morphological and pomological traits: nut size (mm), in-shell weight (g), split ratio (%), shell thickness (mm), and kernel yield (%). Prior to multivariate analysis, all quantitative data were standardized using the z-score transformation to eliminate the effects of differing measurement scales and units:
This standardization ensured that each variable contributed equally to the subsequent multivariate analyses.
A Composite Performance Index (CPI) was developed to integrate multiple trait dimensions into a single quantitative score for ranking genotypes. The CPI was calculated as a weighted linear combination of standardized trait values, expressed as follows:
Data collected from pomological evaluations were subjected to comprehensive statistical analysis to assess genetic variability and identify superior genotypes. Descriptive statistics including mean, standard deviation, and standard error were calculated for all measured traits. Analysis of variance (ANOVA) was performed to determine significant differences among genotypes for size, in-shell weight, split ratio, shell thickness, kernel yield, and kernel weight, with statistical significance determined at p<0.05 level. Duncan's Multiple Range Test was employed as post-hoc analysis to distinguish statistically different genotypes at α = 0.05 significance level, with each genotype evaluated using three replications to ensure data reliability. To facilitate multi-trait selection, z-score standardization was applied to normalize all traits using the formula Z = (X - μ) / σ where X represents individual observation, μ is the population mean, and σ is the standard deviation. Genotypes were ranked according to their CPI values, with higher positive values indicating superior overall performance. Pearson's correlation network analysis was performed using R software, and all graphical outputs were prepared using Origin software version 2021.
The Composite Performance Index (CPI) effectively integrated multiple trait dimensions into a single quantitative metric, enabling comprehensive evaluation and ranking of all 169 genotypes (Tab. 1). CPI values ranged from -1.91 (KS-011) to 1.40 (KS-168), with a mean of 0.00 and standard deviation of 0.58. Based on CPI rankings, 19 superior genotypes representing the top 11.2% of the evaluated germplasm were systematically identified for advanced evaluation and potential cultivar development. Genotype KS-168 emerged as the highest-ranking selection (CPI = 1.40, Rank 1), distinguished by exceptional kernel yield (58.80%, z-score = 2.65), moderate nut size (1.56 cm), remarkably thin shell (0.53 mm, z-score = -1.65), and acceptable split ratio (87.50%). KS-103 ranked second (CPI = 1.32, Rank 2) with outstanding kernel yield (56.48%, z-score = 2.01), thin shell (0.53 mm), and impressive nut size (1.77 cm, z-score = 1.46), despite a moderately lower split ratio (77.40%). KS-132 held the third position (CPI = 1.19, Rank 3) with the highest kernel yield among top performers (57.00%, z-score = 2.15), exceptionally thin shell (0.50 mm, z-score = -2.01), and excellent split ratio (93.50%). The CPI scores theoretically range from negative to positive values depending on the distribution of standardized traits, with higher positive values indicating superior overall performance. In this study, observed CPI values ranged from –1.48 to 1.40, with the top-performing genotypes exceeding 0.88. The top ten geno-types consistently demonstrated CPI values exceeding 0.88, indicating substantial deviation above the population mean across weighted traits. KS-076 (Rank 4), KS-142 (Rank 5), and KS-143 (Rank 6) exhibited kernel yields above 54% with thin shells and excellent split ratios. KS-120 (CPI = 1.00, Rank 7) was particularly noteworthy for its extraordinarily large nut size (2.12 cm, z-score = 2.81), the highest among all 169 genotypes, combined with perfect split ratio (100%). KS-126 (Rank 8) demonstrated exceptional kernel yield (55.34%) paired with the thinnest shell among top performers (0.52 mm, z-score = -1.77). KS-157 (Rank 9) achieved the second-highest kernel yield overall (56.52%, z-score = 2.02), while KS-128 (Rank 10) displayed impressive kernel yield (52.57%) with outstanding split ratio (96.70%). Among genotypes ranked 11-19, KS-096, KS-141, KS-138, and KS-058 demonstrated high kernel yields exceeding 50% with favorable split characteristics. KS-058 (Rank 13) was particularly remarkable for achieving kernel yield of 55.45% despite compact size (1.46 cm), representing exceptional kernel-to-shell efficiency. KS-088 (Rank 17) possessed the thinnest shell among all genotypes (0.46 mm, z-score = -2.50), representing a critical genetic resource for shell thickness reduction. KS-133 (Rank 18) and KS-167 (Rank 19) offered balanced commercial attributes with large nut sizes (1.76 cm and 1.86 cm, respectively) and solid kernel yields above 51%. Standardized z-scores provided critical insights into trait performance. Shell thickness z-scores ranged from -2.50 to 2.71, with 16 of the 19 selected genotypes exhibiting negative values, confirming effective selection for thin-shelled characteristics. Kernel yield z-scores spanned from -3.13 (KS-110) to 2.65 (KS-168), representing a 20.92 percentage point difference. A total of 48 genotypes achieved perfect split ratios (100%).
Physical and chemical characteristics, Z-score values, and rankings of pistachio (Pistacia vera L.) genotypes
| Genotypes | Size | In-shell Weight | Split Ratio | Shell Thickness | Kernel Yield | CPI | Rank | Z_Size | Z_In-shell Weight | Z_Split Ratio | Z_Shell Thickness | Z_Kernel Yield |
|---|---|---|---|---|---|---|---|---|---|---|---|---|
| KS-001 | 1.9 | 0.9 | 100.0 | 0.8 | 44.7 | -0.2 | 106.0 | 1.8 | 2.1 | 0.8 | 2.0 | -1.3 |
| KS-002 | 1.5 | 0.7 | 78.0 | 0.7 | 51.2 | 0.1 | 78.0 | 0.5 | 0.7 | -0.2 | 0.8 | 0.6 |
| KS-003 | 1.3 | 0.6 | 6.6 | 0.7 | 51.6 | -0.7 | 144.0 | -0.5 | -0.4 | -3.3 | 0.3 | 0.7 |
| KS-004 | 1.0 | 0.5 | 53.3 | 0.7 | 47.7 | -0.8 | 151.0 | -1.5 | -1.4 | -1.3 | 0.4 | -0.4 |
| KS-005 | 2.0 | 0.6 | 43.7 | 0.8 | 45.1 | -0.7 | 145.0 | 2.3 | 0.0 | -1.7 | 1.0 | -1.1 |
| KS-006 | 0.9 | 0.4 | 100.0 | 0.6 | 52.1 | 0.0 | 93.0 | -2.1 | -2.2 | 0.8 | -0.4 | 0.8 |
| KS-007 | 1.2 | 0.6 | 63.6 | 0.8 | 40.3 | -1.7 | 168.0 | -0.9 | -0.9 | -0.8 | 2.1 | -2.5 |
| KS-008 | 1.3 | 0.6 | 67.7 | 0.6 | 51.1 | 0.0 | 85.0 | -0.5 | -0.5 | -0.6 | -0.6 | 0.5 |
| KS-009 | 1.1 | 0.5 | 100.0 | 0.7 | 46.9 | -0.4 | 135.0 | -1.3 | -1.2 | 0.8 | 0.3 | -0.7 |
| KS-010 | 1.4 | 0.6 | 82.3 | 0.7 | 51.6 | 0.2 | 75.0 | 0.1 | -0.2 | 0.0 | 0.0 | 0.7 |
| KS-011 | 1.2 | 0.6 | 57.5 | 0.9 | 39.0 | -1.9 | 169.0 | -0.8 | -0.6 | -1.1 | 2.7 | -2.8 |
| KS-012 | 0.8 | 0.4 | 100.0 | 0.6 | 44.5 | -0.7 | 147.0 | -2.4 | -2.5 | 0.8 | -0.4 | -1.3 |
| KS-013 | 1.0 | 0.5 | 97.0 | 0.6 | 48.1 | -0.2 | 107.0 | -1.4 | -1.5 | 0.6 | -0.4 | -0.3 |
| KS-014 | 1.0 | 0.5 | 96.8 | 0.6 | 47.9 | -0.3 | 112.0 | -1.5 | -1.6 | 0.6 | -0.4 | -0.4 |
| KS-015 | 1.2 | 0.5 | 83.8 | 0.7 | 43.2 | -0.8 | 148.0 | -1.0 | -1.0 | 0.1 | 0.0 | -1.7 |
| KS-016 | 1.2 | 0.6 | 97.0 | 0.7 | 46.6 | -0.3 | 125.0 | -0.8 | -0.8 | 0.6 | 0.2 | -0.7 |
| KS-017 | 1.2 | 0.6 | 100.0 | 0.6 | 49.2 | 0.1 | 76.0 | -0.7 | -0.8 | 0.8 | -0.7 | 0.0 |
| KS-018 | 1.0 | 0.4 | 96.8 | 0.6 | 47.5 | -0.3 | 127.0 | -1.7 | -2.0 | 0.6 | -0.6 | -0.5 |
| KS-019 | 1.4 | 0.6 | 94.2 | 0.7 | 49.6 | -0.1 | 99.0 | -0.2 | -0.5 | 0.5 | 0.7 | 0.1 |
| KS-020 | 1.2 | 0.5 | 95.0 | 0.7 | 46.6 | -0.6 | 140.0 | -0.9 | -1.1 | 0.6 | 0.8 | -0.7 |
| KS-021 | 1.0 | 0.4 | 100.0 | 0.6 | 47.3 | -0.3 | 116.0 | -1.6 | -2.0 | 0.8 | -0.7 | -0.5 |
| KS-022 | 1.3 | 0.6 | 93.7 | 0.7 | 46.6 | -0.4 | 132.0 | -0.6 | -0.8 | 0.5 | 0.4 | -0.7 |
| KS-023 | 1.2 | 0.6 | 68.7 | 0.7 | 42.8 | -1.1 | 158.0 | -0.8 | -0.8 | -0.6 | 0.8 | -1.8 |
| KS-024 | 1.0 | 0.5 | 75.0 | 0.7 | 41.0 | -1.3 | 163.0 | -1.8 | -1.9 | -0.3 | 0.3 | -2.3 |
| KS-025 | 1.4 | 0.7 | 97.0 | 0.7 | 45.7 | -0.3 | 120.0 | 0.2 | 0.1 | 0.6 | 0.7 | -1.0 |
| KS-026 | 1.4 | 0.6 | 96.0 | 0.6 | 52.9 | 0.5 | 40.0 | 0.0 | -0.3 | 0.6 | -0.6 | 1.0 |
| KS-027 | 1.4 | 0.6 | 78.0 | 0.6 | 51.9 | 0.3 | 61.0 | 0.0 | -0.2 | -0.2 | -0.6 | 0.8 |
| KS-028 | 1.3 | 0.6 | 93.7 | 0.8 | 43.8 | -0.9 | 152.0 | -0.3 | -0.5 | 0.5 | 1.6 | -1.5 |
| KS-029 | 1.3 | 0.6 | 90.3 | 0.7 | 50.7 | 0.1 | 79.0 | -0.5 | -0.7 | 0.4 | -0.2 | 0.4 |
| KS-030 | 1.4 | 0.6 | 100.0 | 0.7 | 47.7 | -0.2 | 102.0 | 0.0 | 0.0 | 0.8 | 0.8 | -0.4 |
| KS-031 | 1.2 | 0.6 | 39.3 | 0.8 | 42.0 | -1.4 | 165.0 | -0.8 | -0.4 | -1.9 | 1.3 | -2.0 |
| KS-032 | 0.9 | 0.4 | 81.0 | 0.6 | 49.9 | -0.4 | 131.0 | -2.0 | -2.2 | -0.1 | -0.3 | 0.2 |
| KS-033 | 1.1 | 0.5 | 90.6 | 0.7 | 46.4 | -0.6 | 143.0 | -1.0 | -1.2 | 0.4 | 0.5 | -0.8 |
| KS-034 | 1.4 | 0.6 | 90.9 | 0.7 | 47.5 | -0.3 | 113.0 | -0.2 | -0.1 | 0.4 | 0.7 | -0.5 |
| KS-035 | 1.5 | 0.7 | 93.7 | 0.7 | 49.3 | 0.0 | 89.0 | 0.6 | 0.4 | 0.5 | 0.9 | 0.0 |
| KS-036 | 1.1 | 0.6 | 93.5 | 0.7 | 49.0 | -0.3 | 124.0 | -1.3 | -0.9 | 0.5 | 0.5 | -0.1 |
| KS-037 | 1.4 | 0.6 | 65.6 | 0.7 | 49.3 | -0.3 | 114.0 | -0.1 | -0.7 | -0.7 | 0.0 | 0.0 |
| KS-038 | 1.3 | 0.6 | 95.0 | 0.7 | 45.4 | -0.5 | 139.0 | -0.6 | -0.3 | 0.6 | 0.9 | -1.1 |
| KS-039 | 1.3 | 0.6 | 100.0 | 0.7 | 47.1 | -0.2 | 105.0 | -0.5 | -0.4 | 0.8 | 0.3 | -0.6 |
| KS-040 | 1.2 | 0.6 | 97.0 | 0.8 | 41.0 | -1.2 | 162.0 | -0.9 | -0.9 | 0.6 | 1.5 | -2.3 |
| KS-041 | 1.2 | 0.5 | 97.0 | 0.7 | 46.7 | -0.4 | 134.0 | -1.0 | -1.3 | 0.6 | 0.2 | -0.7 |
| KS-042 | 1.3 | 0.6 | 93.5 | 0.7 | 50.1 | 0.0 | 90.0 | -0.3 | -0.7 | 0.5 | 0.2 | 0.3 |
| KS-043 | 1.0 | 0.5 | 100.0 | 0.7 | 50.0 | -0.3 | 119.0 | -1.7 | -1.9 | 0.8 | 0.3 | 0.2 |
| KS-044 | 1.0 | 0.5 | 88.2 | 0.8 | 43.2 | -1.1 | 160.0 | -1.4 | -1.5 | 0.3 | 1.0 | -1.7 |
| KS-045 | 1.4 | 0.7 | 5.0 | 0.8 | 48.5 | -1.1 | 161.0 | 0.1 | 0.6 | -3.4 | 2.0 | -0.2 |
| KS-046 | 1.1 | 0.5 | 90.3 | 0.7 | 44.6 | -0.8 | 150.0 | -1.1 | -1.2 | 0.4 | 0.8 | -1.3 |
| KS-047 | 1.0 | 0.5 | 100.0 | 0.6 | 53.5 | 0.4 | 48.0 | -1.7 | -1.9 | 0.8 | -1.4 | 1.2 |
| KS-048 | 1.0 | 0.5 | 100.0 | 0.6 | 54.6 | 0.4 | 55.0 | -1.7 | -1.9 | 0.8 | -0.8 | 1.5 |
| KS-049 | 1.3 | 0.6 | 97.0 | 0.8 | 50.6 | -0.2 | 108.0 | -0.3 | -0.5 | 0.6 | 1.5 | 0.4 |
| KS-050 | 0.8 | 0.4 | 95.0 | 0.7 | 49.8 | -0.4 | 133.0 | -2.2 | -2.2 | 0.6 | 0.0 | 0.2 |
| KS-051 | 2.2 | 0.9 | 15.0 | 0.7 | 50.2 | 0.1 | 83.0 | 3.3 | 2.2 | -2.9 | 0.4 | 0.3 |
| KS-052 | 1.3 | 0.6 | 100.0 | 0.7 | 51.4 | 0.2 | 68.0 | -0.5 | -0.4 | 0.8 | 0.0 | 0.6 |
| KS-053 | 1.5 | 0.6 | 97.0 | 0.7 | 46.6 | -0.3 | 109.0 | 0.2 | -0.3 | 0.6 | 0.5 | -0.7 |
| KS-054 | 1.5 | 0.7 | 91.0 | 0.7 | 50.3 | 0.2 | 70.0 | 0.4 | 0.2 | 0.4 | 0.2 | 0.3 |
| KS-055 | 1.6 | 0.8 | 52.0 | 0.8 | 47.4 | -0.6 | 141.0 | 0.8 | 1.0 | -1.3 | 1.5 | -0.5 |
| KS-056 | 1.3 | 0.6 | 43.7 | 0.7 | 45.3 | -0.9 | 153.0 | -0.4 | -0.3 | -1.7 | 0.7 | -1.1 |
| KS-057 | 1.3 | 0.6 | 97.0 | 0.6 | 49.8 | 0.2 | 69.0 | -0.4 | -0.4 | 0.6 | -0.6 | 0.2 |
| KS-058 | 1.5 | 0.6 | 90.3 | 0.6 | 55.5 | 0.8 | 13.0 | 0.2 | 0.0 | 0.4 | -0.9 | 1.7 |
| KS-059 | 1.0 | 0.5 | 84.3 | 0.7 | 43.2 | -1.1 | 159.0 | -1.7 | -1.9 | 0.1 | 0.5 | -1.7 |
| KS-060 | 1.3 | 0.6 | 81.8 | 0.7 | 48.4 | -0.4 | 128.0 | -0.4 | -0.2 | 0.0 | 0.9 | -0.2 |
| KS-061 | 0.9 | 0.5 | 96.8 | 0.8 | 45.2 | -1.0 | 156.0 | -1.9 | -1.8 | 0.6 | 1.3 | -1.1 |
| KS-062 | 1.8 | 0.8 | 93.5 | 0.8 | 45.2 | -0.3 | 121.0 | 1.4 | 1.3 | 0.5 | 1.6 | -1.1 |
| KS-063 | 1.5 | 0.7 | 97.0 | 0.8 | 44.0 | -0.7 | 146.0 | 0.4 | 0.4 | 0.6 | 2.1 | -1.5 |
| KS-064 | 1.3 | 0.7 | 95.0 | 0.7 | 47.1 | -0.2 | 103.0 | -0.3 | 0.2 | 0.6 | 0.5 | -0.6 |
| KS-065 | 1.4 | 0.6 | 60.0 | 0.7 | 47.2 | -0.6 | 142.0 | 0.2 | -0.2 | -1.0 | 0.8 | -0.6 |
| KS-066 | 1.0 | 0.5 | 96.8 | 0.7 | 51.9 | -0.1 | 96.0 | -1.8 | -1.6 | 0.6 | -0.1 | 0.8 |
| KS-067 | 1.0 | 0.5 | 100.0 | 0.7 | 48.0 | -0.5 | 137.0 | -1.7 | -1.4 | 0.8 | 0.5 | -0.3 |
| KS-068 | 1.3 | 0.6 | 50.0 | 0.7 | 45.6 | -0.9 | 154.0 | -0.5 | -0.8 | -1.4 | 0.7 | -1.0 |
| KS-069 | 1.2 | 0.6 | 48.4 | 0.7 | 50.8 | -0.4 | 130.0 | -0.7 | -0.3 | -1.5 | 0.4 | 0.4 |
| KS-070 | 1.2 | 0.6 | 70.0 | 0.8 | 42.2 | -1.4 | 164.0 | -0.7 | -0.4 | -0.5 | 2.1 | -1.9 |
| KS-071 | 1.1 | 0.5 | 90.3 | 0.8 | 46.1 | -0.8 | 149.0 | -1.3 | -1.0 | 0.4 | 1.1 | -0.9 |
| KS-072 | 1.4 | 0.6 | 94.0 | 0.7 | 44.7 | -0.5 | 138.0 | -0.1 | -0.3 | 0.5 | 0.7 | -1.2 |
| KS-073 | 1.1 | 0.5 | 83.8 | 0.6 | 48.5 | -0.3 | 123.0 | -1.3 | -1.5 | 0.1 | -0.3 | -0.2 |
| KS-074 | 1.2 | 0.6 | 40.0 | 0.7 | 46.4 | -0.9 | 155.0 | -0.9 | -0.2 | -1.9 | 0.8 | -0.8 |
| KS-075 | 1.3 | 0.6 | 48.3 | 0.8 | 42.0 | -1.5 | 167.0 | -0.4 | -0.1 | -1.5 | 2.1 | -2.0 |
| KS-076 | 1.6 | 0.7 | 93.5 | 0.5 | 54.9 | 1.1 | 4.0 | 0.6 | 0.4 | 0.5 | -1.5 | 1.6 |
| KS-077 | 1.4 | 0.6 | 93.7 | 0.7 | 50.3 | 0.2 | 74.0 | 0.1 | -0.1 | 0.5 | 0.0 | 0.3 |
| KS-078 | 1.7 | 0.7 | 16.0 | 0.5 | 46.4 | -0.2 | 101.0 | 1.1 | 0.8 | -2.9 | -1.7 | -0.8 |
| KS-079 | 1.2 | 0.6 | 50.0 | 0.6 | 47.2 | -0.3 | 126.0 | -0.9 | -0.6 | -1.4 | -1.2 | -0.6 |
| KS-080 | 1.6 | 0.7 | 75.0 | 0.6 | 54.4 | 0.7 | 20.0 | 0.6 | 0.4 | -0.3 | -1.0 | 1.4 |
| KS-081 | 1.5 | 0.7 | 97.0 | 0.6 | 50.5 | 0.4 | 53.0 | 0.3 | 0.1 | 0.6 | -0.3 | 0.4 |
| KS-082 | 1.6 | 0.7 | 7.0 | 0.7 | 51.9 | -0.3 | 110.0 | 0.8 | 0.7 | -3.3 | 0.0 | 0.8 |
| KS-083 | 1.4 | 0.7 | 13.0 | 0.8 | 47.0 | -1.0 | 157.0 | -0.2 | 0.4 | -3.0 | 1.0 | -0.6 |
| KS-084 | 1.5 | 0.7 | 91.7 | 0.6 | 50.9 | 0.4 | 46.0 | 0.2 | 0.4 | 0.4 | -0.4 | 0.5 |
| KS-085 | 1.6 | 0.7 | 84.0 | 0.7 | 46.6 | -0.1 | 97.0 | 0.6 | 0.7 | 0.1 | 0.3 | -0.7 |
| KS-086 | 1.8 | 0.8 | 97.0 | 0.8 | 54.3 | 0.7 | 22.0 | 1.7 | 1.7 | 0.6 | 1.0 | 1.4 |
| KS-087 | 1.5 | 0.7 | 59.0 | 0.7 | 49.2 | 0.0 | 95.0 | 0.4 | 0.6 | -1.0 | -0.1 | 0.0 |
| KS-088 | 1.2 | 0.5 | 95.0 | 0.5 | 52.6 | 0.8 | 17.0 | -0.9 | -1.0 | 0.6 | -2.5 | 0.9 |
| KS-089 | 1.6 | 0.7 | 90.6 | 0.6 | 46.7 | 0.3 | 58.0 | 0.8 | 0.7 | 0.4 | -1.2 | -0.7 |
| KS-090 | 1.4 | 0.7 | 96.9 | 0.6 | 52.3 | 0.7 | 21.0 | 0.1 | 0.2 | 0.6 | -1.3 | 0.9 |
| KS-091 | 1.4 | 0.7 | 100.0 | 0.5 | 48.5 | 0.5 | 34.0 | 0.2 | 0.2 | 0.8 | -1.7 | -0.2 |
| KS-092 | 1.7 | 0.8 | 100.0 | 0.7 | 44.2 | 0.0 | 88.0 | 1.3 | 1.4 | 0.8 | 0.3 | -1.4 |
| KS-093 | 1.8 | 0.8 | 84.3 | 0.6 | 48.2 | 0.4 | 49.0 | 1.5 | 1.6 | 0.1 | -0.3 | -0.3 |
| KS-094 | 1.5 | 0.7 | 81.2 | 0.7 | 46.5 | 0.0 | 94.0 | 0.2 | 0.8 | -0.1 | -0.2 | -0.8 |
| KS-095 | 1.5 | 0.7 | 90.9 | 0.6 | 47.6 | 0.4 | 51.0 | 0.2 | 0.6 | 0.4 | -1.3 | -0.5 |
| KS-096 | 1.7 | 0.8 | 93.7 | 0.5 | 50.6 | 0.9 | 11.0 | 1.0 | 1.2 | 0.5 | -1.5 | 0.4 |
| KS-097 | 1.8 | 0.8 | 68.7 | 0.7 | 47.6 | 0.1 | 84.0 | 1.5 | 1.3 | -0.6 | 0.2 | -0.5 |
| KS-098 | 1.6 | 0.7 | 93.3 | 0.5 | 49.0 | 0.7 | 24.0 | 0.6 | 0.3 | 0.5 | -2.0 | -0.1 |
| KS-099 | 1.5 | 0.7 | 75.0 | 0.6 | 52.9 | 0.7 | 23.0 | 0.3 | 0.4 | -0.3 | -1.4 | 1.0 |
| KS-100 | 1.4 | 0.7 | 96.0 | 0.7 | 43.5 | -0.3 | 122.0 | -0.1 | 0.4 | 0.6 | 0.0 | -1.6 |
| KS-101 | 1.6 | 0.7 | 80.6 | 0.5 | 52.1 | 0.8 | 16.0 | 0.7 | 0.7 | -0.1 | -1.5 | 0.8 |
| KS-102 | 1.4 | 0.6 | 96.8 | 0.5 | 51.0 | 0.7 | 25.0 | 0.0 | 0.0 | 0.6 | -1.5 | 0.5 |
| KS-103 | 1.8 | 0.8 | 77.4 | 0.5 | 56.5 | 1.3 | 2.0 | 1.5 | 1.3 | -0.2 | -1.7 | 2.0 |
| KS-104 | 1.5 | 0.7 | 30.3 | 0.6 | 50.1 | 0.1 | 77.0 | 0.5 | 0.8 | -2.3 | -1.3 | 0.3 |
| KS-105 | 1.5 | 0.7 | 93.3 | 0.8 | 46.9 | -0.3 | 118.0 | 0.5 | 0.4 | 0.5 | 1.3 | -0.6 |
| KS-106 | 1.9 | 0.9 | 73.3 | 0.7 | 49.8 | 0.5 | 35.0 | 1.9 | 2.2 | -0.4 | -0.2 | 0.2 |
| KS-107 | 1.6 | 0.7 | 51.5 | 0.7 | 52.2 | 0.2 | 72.0 | 0.6 | 0.9 | -1.3 | 0.0 | 0.8 |
| KS-108 | 1.7 | 0.7 | 10.0 | 0.6 | 53.3 | 0.1 | 81.0 | 1.2 | 0.6 | -3.2 | -0.6 | 1.1 |
| KS-109 | 1.3 | 0.6 | 80.6 | 0.7 | 49.8 | 0.0 | 91.0 | -0.3 | -0.2 | -0.1 | -0.1 | 0.2 |
| KS-110 | 1.3 | 0.6 | 100.0 | 0.9 | 37.9 | -1.5 | 166.0 | -0.4 | -0.4 | 0.8 | 2.3 | -3.1 |
| KS-111 | 1.5 | 0.7 | 56.6 | 0.7 | 51.1 | 0.0 | 87.0 | 0.2 | 0.3 | -1.1 | -0.1 | 0.5 |
| KS-112 | 1.6 | 0.7 | 93.5 | 0.7 | 52.6 | 0.6 | 28.0 | 0.8 | 0.5 | 0.5 | -0.2 | 1.0 |
| KS-113 | 1.4 | 0.7 | 96.8 | 0.6 | 51.2 | 0.5 | 38.0 | 0.1 | 0.2 | 0.6 | -0.8 | 0.6 |
| KS-114 | 1.4 | 0.7 | 100.0 | 0.6 | 52.8 | 0.6 | 29.0 | 0.1 | 0.4 | 0.8 | -0.3 | 1.0 |
| KS-115 | 1.6 | 0.7 | 96.7 | 0.6 | 49.2 | 0.5 | 39.0 | 0.6 | 0.5 | 0.6 | -1.0 | 0.0 |
| KS-116 | 1.7 | 0.8 | 93.7 | 0.6 | 48.7 | 0.5 | 43.0 | 1.2 | 1.2 | 0.5 | -0.6 | -0.1 |
| KS-117 | 1.5 | 0.7 | 100.0 | 0.7 | 49.5 | 0.3 | 64.0 | 0.5 | 0.5 | 0.8 | 0.2 | 0.1 |
| KS-118 | 1.7 | 0.8 | 78.0 | 0.6 | 48.6 | 0.3 | 62.0 | 1.0 | 1.1 | -0.2 | -0.4 | -0.2 |
| KS-119 | 1.6 | 0.7 | 97.0 | 0.6 | 48.2 | 0.4 | 54.0 | 0.7 | 0.6 | 0.6 | -0.6 | -0.3 |
| KS-120 | 2.1 | 0.9 | 100.0 | 0.6 | 49.9 | 1.0 | 7.0 | 2.8 | 2.1 | 0.8 | -0.8 | 0.2 |
| KS-121 | 1.7 | 0.8 | 83.8 | 0.6 | 51.1 | 0.7 | 26.0 | 1.3 | 1.4 | 0.1 | -0.6 | 0.5 |
| KS-122 | 1.7 | 0.8 | 94.0 | 0.7 | 48.8 | 0.4 | 57.0 | 1.0 | 1.5 | 0.5 | 0.2 | -0.1 |
| KS-123 | 1.4 | 0.7 | 69.6 | 0.6 | 52.2 | 0.5 | 36.0 | 0.1 | 0.8 | -0.6 | -1.0 | 0.8 |
| KS-124 | 1.4 | 0.7 | 100.0 | 0.7 | 49.7 | 0.3 | 65.0 | 0.1 | 0.2 | 0.8 | -0.1 | 0.1 |
| KS-125 | 1.3 | 0.6 | 100.0 | 0.6 | 50.6 | 0.5 | 44.0 | -0.5 | -0.7 | 0.8 | -1.4 | 0.4 |
| KS-126 | 1.4 | 0.6 | 90.0 | 0.5 | 55.3 | 1.0 | 8.0 | 0.1 | -0.2 | 0.3 | -1.8 | 1.7 |
| KS-127 | 1.4 | 0.7 | 100.0 | 0.7 | 50.1 | 0.2 | 71.0 | 0.0 | 0.2 | 0.8 | 0.3 | 0.3 |
| KS-128 | 1.6 | 0.7 | 96.7 | 0.6 | 52.6 | 0.9 | 10.0 | 0.6 | 0.7 | 0.6 | -1.4 | 0.9 |
| KS-129 | 1.6 | 0.7 | 41.9 | 0.6 | 50.7 | 0.2 | 73.0 | 0.9 | 0.9 | -1.8 | -0.7 | 0.4 |
| KS-130 | 1.3 | 0.6 | 100.0 | 0.6 | 52.3 | 0.5 | 41.0 | -0.4 | -0.4 | 0.8 | -0.8 | 0.9 |
| KS-131 | 1.3 | 0.6 | 100.0 | 0.6 | 51.4 | 0.5 | 37.0 | -0.4 | -0.3 | 0.8 | -1.2 | 0.6 |
| KS-132 | 1.4 | 0.6 | 93.5 | 0.5 | 57.0 | 1.2 | 3.0 | -0.2 | -0.2 | 0.5 | -2.0 | 2.2 |
| KS-133 | 1.8 | 0.8 | 100.0 | 0.6 | 51.2 | 0.8 | 18.0 | 1.4 | 1.5 | 0.8 | -0.3 | 0.5 |
| KS-134 | 1.6 | 0.8 | 96.7 | 0.7 | 52.5 | 0.7 | 27.0 | 0.8 | 1.0 | 0.6 | -0.1 | 0.9 |
| KS-135 | 1.3 | 0.6 | 96.6 | 0.6 | 51.0 | 0.4 | 56.0 | -0.2 | 0.0 | 0.6 | -0.4 | 0.5 |
| KS-136 | 1.6 | 0.7 | 97.0 | 0.6 | 51.4 | 0.5 | 42.0 | 0.7 | 0.4 | 0.6 | -0.3 | 0.6 |
| KS-137 | 1.7 | 0.8 | 100.0 | 0.8 | 50.1 | 0.2 | 67.0 | 1.0 | 1.4 | 0.8 | 1.3 | 0.2 |
| KS-138 | 1.6 | 0.7 | 91.1 | 0.6 | 53.9 | 0.8 | 14.0 | 0.8 | 0.4 | 0.4 | -0.9 | 1.3 |
| KS-139 | 1.7 | 0.8 | 100.0 | 0.8 | 44.3 | -0.4 | 136.0 | 1.2 | 1.2 | 0.8 | 2.0 | -1.4 |
| KS-140 | 1.4 | 0.7 | 93.9 | 0.7 | 51.1 | 0.3 | 63.0 | -0.1 | 0.3 | 0.5 | 0.0 | 0.5 |
| KS-141 | 1.4 | 0.7 | 94.0 | 0.6 | 53.8 | 0.9 | 12.0 | 0.0 | 0.2 | 0.5 | -1.4 | 1.3 |
| KS-142 | 1.7 | 0.8 | 94.0 | 0.6 | 54.6 | 1.0 | 5.0 | 1.0 | 1.1 | 0.5 | -0.8 | 1.5 |
| KS-143 | 1.6 | 0.7 | 91.6 | 0.6 | 54.4 | 1.0 | 6.0 | 0.6 | 0.7 | 0.4 | -1.3 | 1.4 |
| KS-144 | 1.8 | 0.9 | 15.6 | 0.7 | 48.3 | -0.3 | 117.0 | 1.7 | 2.4 | -2.9 | 0.7 | -0.3 |
| KS-145 | 1.2 | 0.6 | 96.6 | 0.7 | 47.7 | -0.3 | 111.0 | -0.7 | -0.3 | 0.6 | 0.5 | -0.4 |
| KS-146 | 1.4 | 0.7 | 62.5 | 0.6 | 49.6 | 0.0 | 86.0 | 0.0 | 0.4 | -0.9 | -0.4 | 0.1 |
| KS-147 | 1.4 | 0.7 | 78.0 | 0.7 | 48.5 | 0.0 | 92.0 | 0.1 | 0.2 | -0.2 | -0.2 | -0.2 |
| KS-148 | 1.6 | 0.7 | 100.0 | 0.7 | 50.3 | 0.4 | 45.0 | 0.7 | 0.7 | 0.8 | 0.0 | 0.3 |
| KS-149 | 1.5 | 0.7 | 100.0 | 0.7 | 48.6 | 0.2 | 66.0 | 0.3 | 0.7 | 0.8 | 0.0 | -0.2 |
| KS-150 | 1.9 | 0.7 | 100.0 | 0.7 | 49.9 | 0.3 | 60.0 | 1.9 | 0.4 | 0.8 | 0.7 | 0.2 |
| KS-151 | 1.4 | 0.6 | 87.5 | 0.6 | 53.4 | 0.4 | 47.0 | -0.2 | -0.2 | 0.2 | -0.3 | 1.2 |
| KS-152 | 1.2 | 0.6 | 100.0 | 0.6 | 52.1 | 0.6 | 33.0 | -0.7 | -0.4 | 0.8 | -1.2 | 0.8 |
| KS-153 | 1.4 | 0.6 | 97.0 | 0.6 | 51.6 | 0.6 | 32.0 | -0.2 | 0.0 | 0.6 | -1.0 | 0.7 |
| KS-154 | 1.3 | 0.6 | 93.3 | 0.6 | 50.4 | 0.4 | 52.0 | -0.5 | 0.0 | 0.5 | -0.9 | 0.3 |
| KS-155 | 1.4 | 0.6 | 93.7 | 0.6 | 51.4 | 0.6 | 30.0 | -0.2 | -0.2 | 0.5 | -1.4 | 0.6 |
| KS-156 | 1.3 | 0.6 | 83.8 | 0.6 | 49.1 | 0.1 | 82.0 | -0.5 | -0.4 | 0.1 | -0.7 | 0.0 |
| KS-157 | 1.5 | 0.7 | 94.0 | 0.6 | 56.5 | 1.0 | 9.0 | 0.4 | 0.3 | 0.5 | -0.7 | 2.0 |
| KS-158 | 1.8 | 0.7 | 62.5 | 0.7 | 51.4 | 0.1 | 80.0 | 1.6 | 0.4 | -0.9 | 0.7 | 0.6 |
| KS-159 | 1.4 | 0.7 | 90.6 | 0.8 | 49.0 | -0.2 | 100.0 | 0.2 | 0.8 | 0.4 | 1.4 | -0.1 |
| KS-160 | 1.5 | 0.7 | 45.2 | 0.7 | 55.9 | 0.4 | 50.0 | 0.5 | 0.5 | -1.6 | -0.1 | 1.9 |
| KS-161 | 1.5 | 0.8 | 37.5 | 0.7 | 49.2 | -0.4 | 129.0 | 0.4 | 1.3 | -2.0 | 0.9 | 0.0 |
| KS-162 | 1.2 | 0.6 | 100.0 | 0.8 | 51.4 | -0.2 | 104.0 | -0.7 | -0.8 | 0.8 | 1.4 | 0.6 |
| KS-163 | 1.6 | 0.7 | 100.0 | 0.8 | 52.1 | 0.3 | 59.0 | 0.7 | 0.9 | 0.8 | 1.1 | 0.8 |
| KS-164 | 1.6 | 0.8 | 62.5 | 0.7 | 49.1 | -0.1 | 98.0 | 0.7 | 1.1 | -0.9 | 0.7 | 0.0 |
| KS-165 | 1.5 | 0.8 | 80.0 | 0.7 | 53.7 | 0.6 | 31.0 | 0.5 | 1.0 | -0.1 | -0.1 | 1.2 |
| KS-166 | 1.3 | 0.7 | 74.1 | 0.8 | 51.4 | -0.3 | 115.0 | -0.2 | 0.3 | -0.4 | 1.6 | 0.6 |
| KS-167 | 1.9 | 0.8 | 74.1 | 0.6 | 52.5 | 0.8 | 19.0 | 1.8 | 1.8 | -0.4 | -0.4 | 0.9 |
| KS-168 | 1.6 | 0.7 | 87.5 | 0.5 | 58.8 | 1.4 | 1.0 | 0.6 | 0.5 | 0.2 | -1.7 | 2.7 |
| KS-169 | 1.6 | 0.7 | 96.8 | 0.6 | 52.4 | 0.8 | 15.0 | 0.8 | 0.8 | 0.6 | -0.8 | 0.9 |
The 19 selected genotypes were classified into three distinct performance groups based on their phenotypic profiles and selection criteria (Tab. 2). The high-performing group comprised 11 genotypes (KS-076, KS-096, KS-103, KS-116, KS-121, KS-126, KS-133, KS-142, KS-143, KS-168, KS-169) characterized by superior kernel yield, balanced morphological traits, and excellent overall performance. These genotypes exhibited CPI values ranging from 0.50 to 1.40 and kernel yields from 48.68% to 58.80%. The efficient shell type group included four genotypes (KS-058, KS-086, KS-120, KS-128) distinguished by thin shells, compact dimensions, and high kernel-to-shell ratios, with CPI values between 0.73 and 1.06. The balanced type group contained four genotypes (KS-001, KS-128, KS-142, KS-157, KS-167) demonstrating uniform performance across multiple traits without extreme values in any single parameter, with CPI values ranging from -0.22 to 1.01. Notably, genotype KS-001, despite ranking 106th overall (CPI = -0.22), was selected for its exceptional size (1.86 cm, z-score = 1.82) and in-shell weight (0.86 g, z-score = 2.09), combined with perfect split ratio (100%), representing a valuable genetic resource for improving nut size in breeding programs. Conversely, genotype KS-093 (CPI = 0.40, Rank 49) was classified as an elite performer due to its consistently above-average performance across all evaluated traits, demonstrating balanced genetic potential without extreme deficiencies.
Pistachio (Pistacia vera L.) genotypes: Comprehesive evaluation of CPI, rankings, physical traits, selection reasons, and classification groups
| Genotypes | CPI | Rank | Size | In-shell Weight | Split Ratio | Shell-Thickness | Kernel Yield | Selection Reason | Group |
|---|---|---|---|---|---|---|---|---|---|
| KS-001 | -0.2 | 106.0 | 1.9 | 0.9 | 100.0 | 0.8 | 44.7 | High kernel yield and shell balance | Balanced type |
| KS-058 | 0.8 | 13.0 | 1.5 | 0.6 | 90.3 | 0.6 | 55.5 | Compact size and efficient yield | Efficient shell type |
| KS-076 | 1.1 | 4.0 | 1.6 | 0.7 | 93.5 | 0.5 | 54.9 | Excellent split ratio | High-performing |
| KS-086 | 0.7 | 22.0 | 1.8 | 0.8 | 97.0 | 0.8 | 54.3 | Thin shell and high kernel percentage | Efficient shell type |
| KS-093 | 0.4 | 49.0 | 1.8 | 0.8 | 84.3 | 0.6 | 48.2 | Top performer across traits | Elite performer |
| KS-096 | 0.9 | 11.0 | 1.7 | 0.8 | 93.7 | 0.5 | 50.6 | Excellent kernel yield | High-performing |
| KS-103 | 1.3 | 2.0 | 1.8 | 0.8 | 77.4 | 0.5 | 56.5 | Thin shell and high kernel yield | High-performing |
| KS-116 | 0.5 | 43.0 | 1.7 | 0.8 | 93.7 | 0.6 | 48.7 | High in-shell weight and kernel yield | High-performing |
| KS-120 | 1.0 | 7.0 | 2.1 | 0.9 | 100.0 | 0.6 | 49.9 | Thin shell and large kernel | Efficient shell type |
| KS-121 | 0.7 | 26.0 | 1.7 | 0.8 | 83.8 | 0.6 | 51.1 | High kernel yield with acceptable shell | High-performing |
| KS-126 | 1.0 | 8.0 | 1.4 | 0.6 | 90.0 | 0.5 | 55.3 | High split ratio and kernel yield | High-performing |
| KS-128 | 0.9 | 10.0 | 1.6 | 0.7 | 96.7 | 0.6 | 52.6 | Thin shell with balanced kernel ratio | Balanced type |
| KS-133 | 0.8 | 18.0 | 1.8 | 0.8 | 100.0 | 0.6 | 51.2 | High yield and kernel ratio | High-performing |
| KS-142 | 1.0 | 5.0 | 1.7 | 0.8 | 94.0 | 0.6 | 54.6 | Balanced performance across all traits | Balanced type |
| KS-143 | 1.0 | 6.0 | 1.6 | 0.7 | 91.6 | 0.6 | 54.4 | High in-shell weight and kernel yield | High-performing |
| KS-157 | 1.0 | 9.0 | 1.5 | 0.7 | 94.0 | 0.6 | 56.5 | Large nut size and good yield | Balanced type |
| KS-167 | 0.8 | 19.0 | 1.9 | 0.8 | 74.1 | 0.6 | 52.5 | Large nut and uniform morphology | Balanced type |
| KS-168 | 1.4 | 1.0 | 1.6 | 0.7 | 87.5 | 0.5 | 58.8 | High kernel yield and large size | High-performing |
| KS-169 | 0.8 | 15.0 | 1.6 | 0.7 | 96.8 | 0.6 | 52.4 | High split ratio and light shell | High-performing |
Analysis of variance revealed highly significant differences (p < 0.05) among the 169 pistachio genotypes for all evaluated pomological traits, confirming substantial genetic diversity within the natural population (Tab. 3). Kernel yield exhibited the highest F-value (292.82), followed by shell thickness (80.72), split ratio (78.02), size (37.82), in-shell weight (29.12), and kernel weight (14.40). Duncan's Multiple Range Test identified statistically significant differences among the 19 selected genotypes for all evaluated traits (Tab. 4). Kernel yield ranged from 35.36% (KS-116) to 61.18% (KS-121). Genotypes KS-121 (61.18%) and KS-128 (57.14%) comprised the highest performing group, significantly superior to all others. The second group included 11 genotypes with kernel yields ranging from 41.31% to 49.66%, while groups and represented genotypes with progressively lower kernel percentages. Interestingly, KS-076 exhibited an anomalous kernel yield value (0.50%). Nut size measurements revealed three distinct groups. Genotype KS-001 (1.49 cm) formed a unique group, significantly larger than all other selections. The majority of genotypes (17 selections) clustered in group with sizes ranging from 0.99 to 1.37 cm, while KS-142 (0.85 cm) constituted the smallest group. In-shell weight showed limited variation, with 18 genotypes forming a homogeneous group ranging from 0.483 to 0.670 g, and only KS-001 (0.730 g) significantly heavier. Split ratio demonstrated remarkable uniformity among selected genotypes, with 18 selections forming a single homogeneous group ranging from 74.67 to 88.67%, while only KS-096 (54.67 %) exhibited significantly lower splitting percentage. Shell thickness measurements produced three distinct groups: KS-167 demonstrated the thickest shell (0.943 mm), 14 genotypes showed intermediate thickness (0.6470.840 mm), and KS-103 possessed the thinnest shell (0.593 mm). Kernel weight ranged from 0.203 to 0.337 g, with KS-168 (0.203_g) significantly lighter than the remaining 18 genotypes (0.2270.337 g).
Analysis of variance (ANOVA) for physical and yield-related traits of pistachio (Pistacia vera L.) genotypes.
| Trait | Source | DF | SS | MS | F-value | Significance |
|---|---|---|---|---|---|---|
| Size | Between Genotypes | 18 | 1.42 | 0.0787 | 37.82 | < 0.05** |
| Within Genotypes (Error) | 38 | 0.08 | 0.0021 | - | - | |
| In-shell weight | Between Genotypes | 18 | 0.21 | 0.0116 | 29.12 | < 0.05** |
| Within Genotypes (Error) | 38 | 0.02 | 0.0004 | - | - | |
| Split Ratio | Between Genotypes | 18 | 2661.05 | 147.8363 | 78.02 | < 0.05** |
| Within Genotypes (Error) | 38 | 72.00 | 1.8947 | - | - | |
| Shell thickness | Between Genotypes | 18 | 0.42 | 0.0235 | 80.72 | < 0.05** |
| Within Genotypes (Error) | 38 | 0.01 | 0.0003 | - | - | |
| Kernel yield | Between Genotypes | 18 | 8054.66 | 447.4812 | 292.82 | < 0.05** |
| Within Genotypes (Error) | 38 | 58.07 | 1.5282 | - | - | |
| Kernel Weight | Between Genotypes | 18 | 0.06 | 0.0033 | 14.40 | < 0.05** |
| Within Genotypes (Error) | 38 | 0.01 | 0.0002 | - | - |
DF: Degrees of freedom; SS: Sum of squares; MS: Mean square; Error: Residual variation within genotypes (experimental error representing unexplained variance after accounting for genotype effects);
Significant at p < 0.05.
Physical and yield-related traits of pistachio (Pistacia vera L.) genotypes with mean ± standard error (SE)
| Genotype | Size (cm) | In-shell Weight (g) | Split Ratio (%) | Shell Thickness (mm) | Kernel Yield (%) | Kernel Weight (g) |
|---|---|---|---|---|---|---|
| KS-121 | 1.27b± 0.00 | 0.527b± 0.006 | 81.33a± 0.66 | 0.800b± 0.015 | 61.18a± 0.60 | 0.300a± 0.011 |
| KS-128 | 1.25b± 0.01 | 0.547b± 0.006 | 84.67a± 0.60 | 0.663b± 0.006 | 57.14a± 0.59 | 0.320a± 0.015 |
| KS-120 | 1.14b± 0.01 | 0.483b± 0.014 | 76.67a± 0.63 | 0.660b± 0.011 | 49.66b± 0.87 | 0.273a± 0.006 |
| KS-167 | 1.35b± 0.00 | 0.513b± 0.006 | 82.67a± 0.66 | 0.943a± 0.006 | 49.33b± 0.66 | 0.257a± 0.003 |
| KS-093 | 1.37b± 0.01 | 0.640b± 0.015 | 76.67a± 0.69 | 0.793b± 0.017 | 48.83b± 0.44 | 0.303a± 0.006 |
| KS-103 | 1.37b± 0.01 | 0.600b± 0.011 | 74.67a± 0.66 | 0.593c± 0.006 | 48.51b± 0.51 | 0.303a± 0.003 |
| KS-096 | 1.28b± 0.01 | 0.613b± 0.006 | 54.67b± 0.65 | 0.760b± 0.010 | 47.40b± 0.70 | 0.293a± 0.006 |
| KS-086 | 0.99b± 0.00 | 0.563b± 0.006 | 77.33a± 0.60 | 0.840b± 0.005 | 46.79b± 0.91 | 0.283a± 0.006 |
| KS-157 | 1.23b± 0.01 | 0.547b± 0.003 | 79.33a± 0.63 | 0.687b± 0.006 | 46.76b± 0.90 | 0.257a± 0.003 |
| KS-001 | 1.49a± 0.08 | 0.730a± 0.028 | 80.67a± 1.76 | 0.813b± 0.017 | 44.67b± 0.88 | 0.337a± 0.008 |
| KS-169 | 1.13b± 0.01 | 0.573b± 0.006 | 76.00a± 1.15 | 0.660b± 0.011 | 43.67b± 0.66 | 0.260a± 0.000 |
| KS-058 | 1.30b± 0.01 | 0.647b± 0.008 | 84.67a± 0.66 | 0.820b± 0.011 | 43.31b± 0.65 | 0.293a± 0.003 |
| KS-142 | 0.85c± 0.01 | 0.633b± 0.006 | 85.33a± 0.67 | 0.777b± 0.008 | 42.40b± 0.87 | 0.277a± 0.012 |
| KS-143 | 1.13b± 0.01 | 0.647b± 0.008 | 82.67a± 0.64 | 0.647b± 0.006 | 42.00b± 1.15 | 0.250a± 0.010 |
| KS-133 | 1.10b± 0.05 | 0.613b± 0.006 | 82.67a± 0.63 | 0.663b± 0.006 | 41.31b± 0.65 | 0.250a± 0.010 |
| KS-126 | 1.19b± 0.01 | 0.670b± 0.011 | 78.67a± 0.67 | 0.717b± 0.006 | 37.10c± 0.58 | 0.237a± 0.006 |
| KS-168 | 1.07b± 0.00 | 0.543b± 0.006 | 81.33a± 0.63 | 0.683b± 0.008 | 35.79c± 0.40 | 0.203b± 0.003 |
| KS-116 | 1.04b± 0.02 | 0.613b± 0.020 | 88.67a± 0.61 | 0.663b± 0.006 | 35.36c± 0.67 | 0.227a± 0.017 |
| KS-076 | 0.97b± 0.01 | 0.533b± 0.003 | 77.33a± 0.62 | 0.793b± 0.006 | 0.50d± 0.00 | 0.273a± 0.008 |
Duncan's Multiple Range Test was performed at a = 0.05 significance level
Means followed by the same letter (superscript) are not significantly different
Different letters indicate statistically significant differences between genotypes
Each value represents the mean of 3 replications
The phenological assessment of the 19 pistachio genotypes revealed considerable variation in the timing of bud burst, flowering stages, and harvest dates (Tab. 5). Bud burst occurred between 25 March (KS-103 and KS-126) and 3 April (KS-116 and KS-157), indicating early to late vegetative initiation among genotypes. The first bloom was observed between 31 March (KS-103) and 10 April (KS-157), while full bloom occurred from 3 April (KS-103) to 14 April (KS-157). The end of bloom ranged from 7 April (KS-103) to 20 April (KS-157), resulting in flowering durations of 6 to 10 days, reflecting differences in flowering intensity and synchronization. Harvest dates varied notably, spanning from 1 August (KS-093) to 15 August (KS-116 and KS-168), demonstrating genotype-dependent variation in fruit maturation. Overall, KS-103 consistently exhibited the earliest phenological stages, whereas KS-116 and KS-168 represented the latest genotypes in terms of harvest.
Phenological stages and harvest dates of pistachio (Pistacia vera L.) genotypes in 2024
| Genotypes | Bud Burst | First Bloom | Full Bloom | End of Bloom | Flowering Duration | Harvest Date |
|---|---|---|---|---|---|---|
| KS-001 | 27-Mar-24 | 3-Apr-24 | 8-Apr-24 | 14-Apr-24 | 9 days | 8-Aug-24 |
| KS-058 | 29-Mar-24 | 4-Apr-24 | 8-Apr-24 | 12-Apr-24 | 8 days | 3-Aug-24 |
| KS-076 | 26-Mar-24 | 2-Apr-24 | 5-Apr-24 | 8-Apr-24 | 6 days | 14-Aug-24 |
| KS-086 | 2-Apr-24 | 8-Apr-24 | 12-Apr-24 | 16-Apr-24 | 8 days | 9-Aug-24 |
| KS-093 | 28-Mar-24 | 5-Apr-24 | 9-Apr-24 | 14-Apr-24 | 9 days | 1-Aug-24 |
| KS-096 | 31-Mar-24 | 6-Apr-24 | 10-Apr-24 | 16-Apr-24 | 10 days | 11-Aug-24 |
| KS-103 | 25-Mar-24 | 31-Mar-24 | 3-Apr-24 | 7-Apr-24 | 7 days | 6-Aug-24 |
| KS-116 | 3-Apr-24 | 9-Apr-24 | 13-Apr-24 | 19-Apr-24 | 10 days | 15-Aug-24 |
| KS-120 | 27-Mar-24 | 3-Apr-24 | 6-Apr-24 | 10-Apr-24 | 7 days | 4-Aug-24 |
| KS-121 | 30-Mar-24 | 5-Apr-24 | 9-Apr-24 | 15-Apr-24 | 10 days | 13-Aug-24 |
| KS-126 | 25-Mar-24 | 1-Apr-24 | 4-Apr-24 | 9-Apr-24 | 8 days | 7-Aug-24 |
| KS-128 | 1-Apr-24 | 7-Apr-24 | 11-Apr-24 | 17-Apr-24 | 10 days | 10-Aug-24 |
| KS-133 | 26-Mar-24 | 1-Apr-24 | 5-Apr-24 | 10-Apr-24 | 9 days | 2-Aug-24 |
| KS-142 | 30-Mar-24 | 6-Apr-24 | 9-Apr-24 | 15-Apr-24 | 9 days | 12-Aug-24 |
| KS-143 | 28-Mar-24 | 4-Apr-24 | 7-Apr-24 | 11-Apr-24 | 7 days | 5-Aug-24 |
| KS-157 | 3-Apr-24 | 10-Apr-24 | 14-Apr-24 | 20-Apr-24 | 10 days | 11-Aug-24 |
| KS-167 | 29-Mar-24 | 5-Apr-24 | 8-Apr-24 | 11-Apr-24 | 6 days | 8-Aug-24 |
| KS-168 | 27-Mar-24 | 4-Apr-24 | 7-Apr-24 | 12-Apr-24 | 9 days | 15-Aug-24 |
| KS-169 | 1-Apr-24 | 8-Apr-24 | 11-Apr-24 | 16-Apr-24 | 8 days | 9-Aug-24 |
Hierarchical cluster analysis based on standardized trait values grouped the 19 selected genotypes into distinct clusters according to their phenotypic similarity (Fig. 3). The heatmap visualization revealed clear patterns of trait performance across genotypes, with color intensity indicating standardized z-score values ranging from -4 (dark blue) to +4 (dark red). One cluster was characterized by high kernel yield and kernel weight (red coloration), including genotypes KS-126, KS-058, and KS-001. Another cluster exhibited strong performance in split ratio (yellow coloration) while maintaining moderate values for other traits. Shell thickness showed considerable variation across genotypes, with KS-076, KS-096, and KS-143 displaying notably thin shells (dark blue coloration). Pearson correlation analysis revealed significant relationships among evaluated traits (Fig. 4). Size exhibited a moderate positive correlation with kernel yield (r = 0.48), indicating that larger nuts tended to have higher kernel percentages. Size showed a weak positive correlation with in-shell weight (r = 0.27) and weak negative correlation with split ratio (r = -0.22). In-shell weight demonstrated a positive correlation with kernel weight (r = 0.26) but showed negligible correlations with split ratio (r = 0.04), shell thickness (r = 0.00), and kernel yield (r = -0.02). Shell thickness exhibited a weak negative correlation with kernel weight (r = -0.20). Kernel yield showed near-zero correlations with split ratio (r = -0.03), shell thickness (r = -0.01), and kernel weight (r = 0.03).
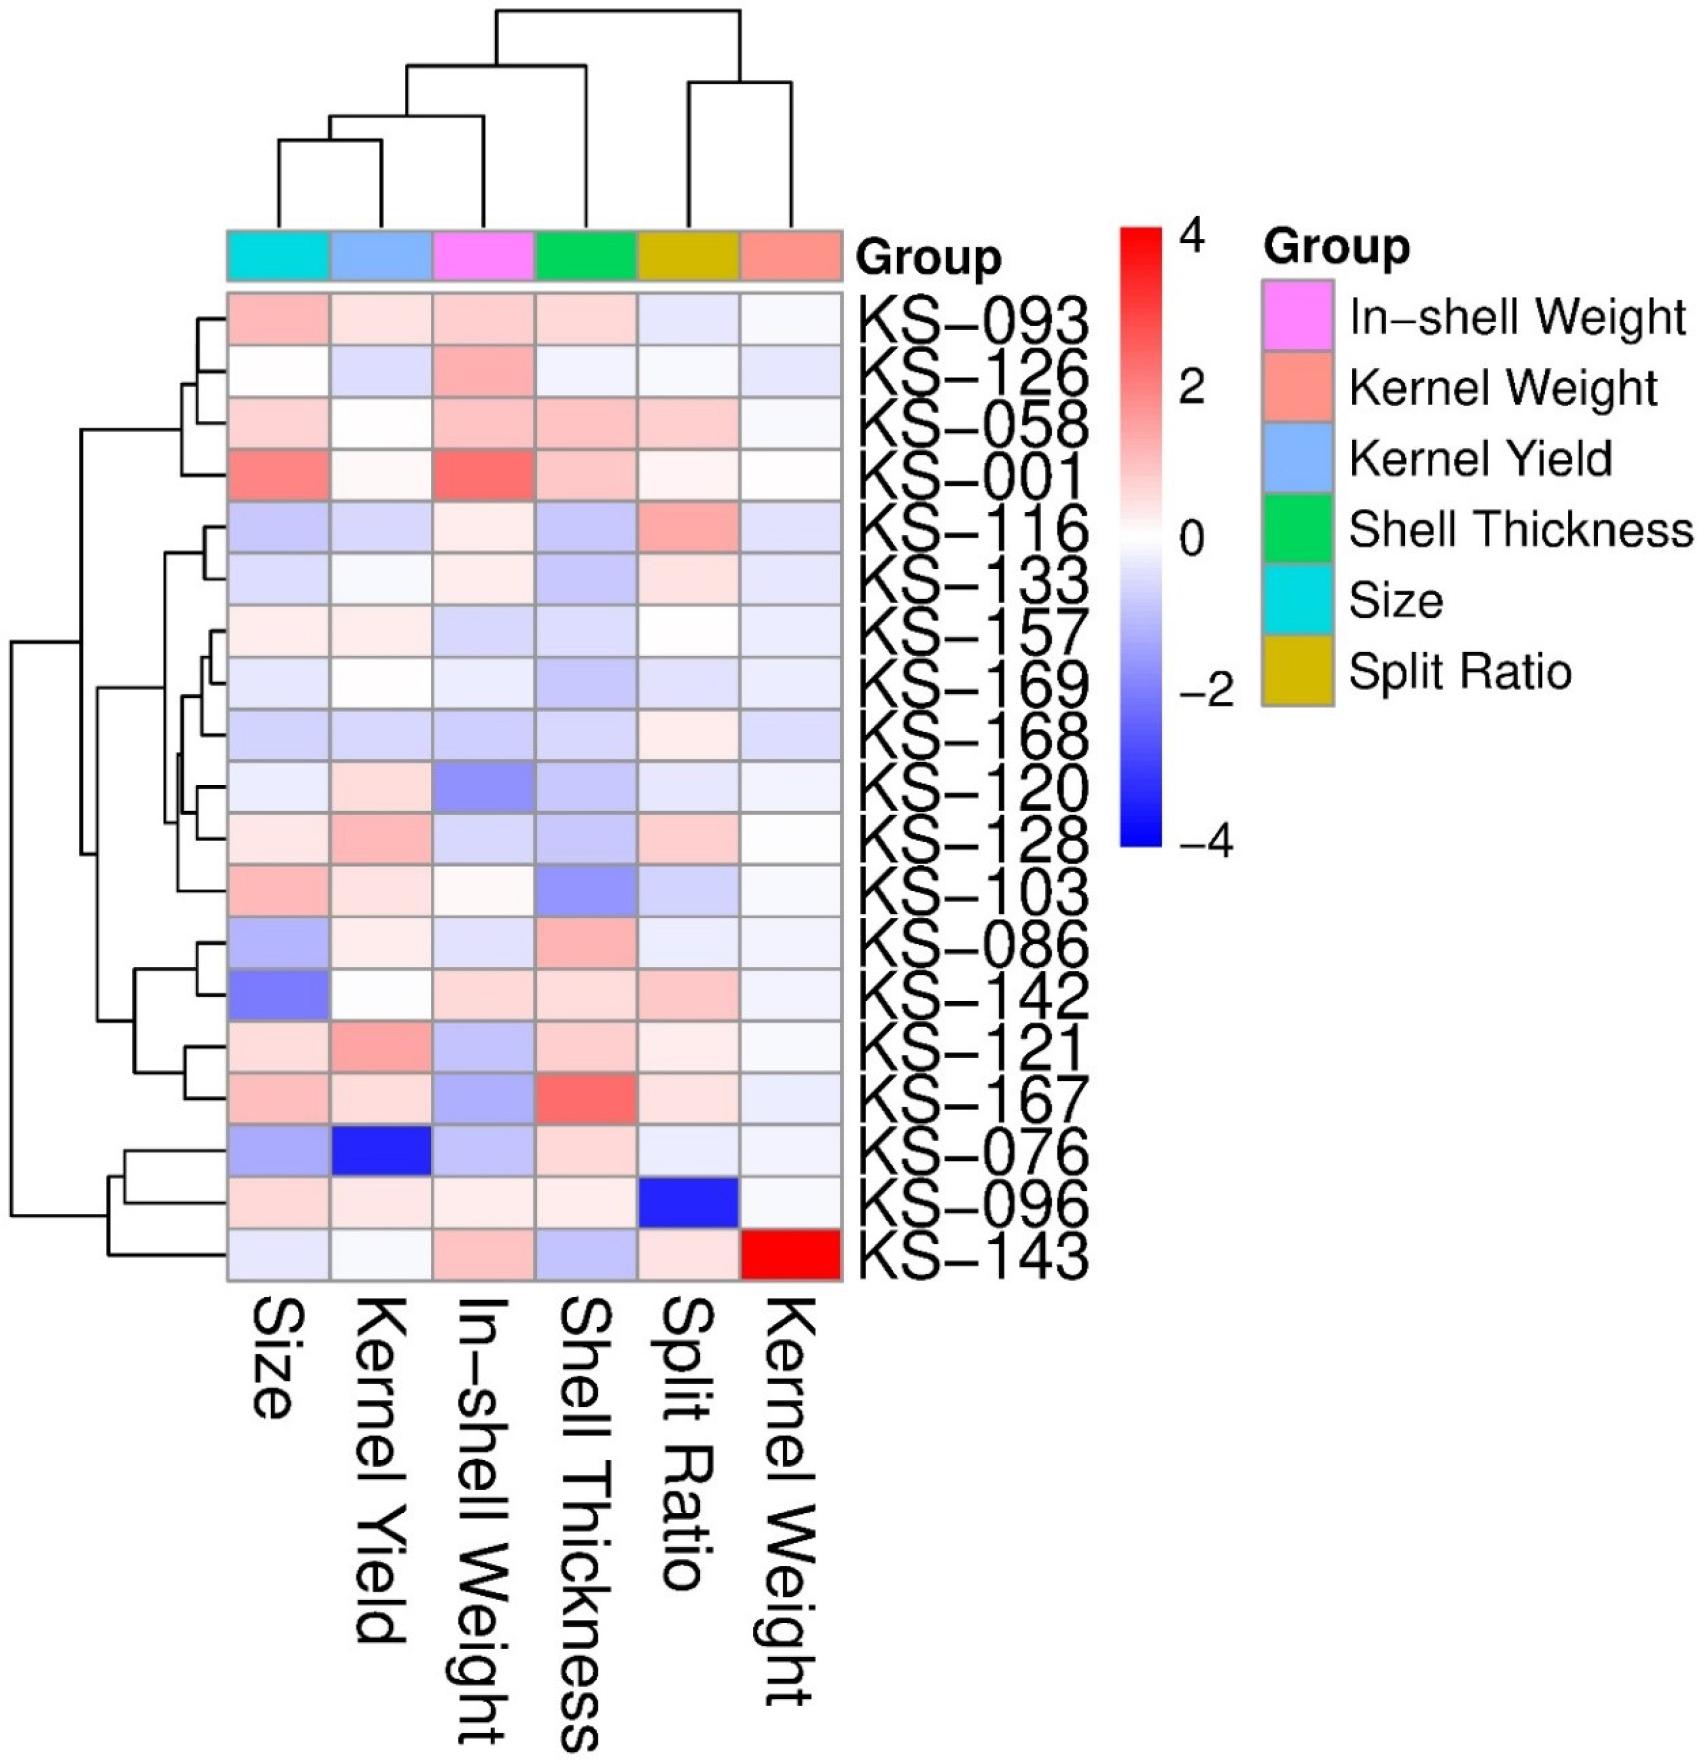
Hierarchical clustering heatmap of kernel-related traits in pistachio genotypes. Traits include size, kernel yield, in-shell weight, shell thickness, split ratio, and kernel weight. The color scale represents standardized values (Z-scores), with red indicating higher and blue indicating lower trait values. Groups were classified based on similarity among genotypes.
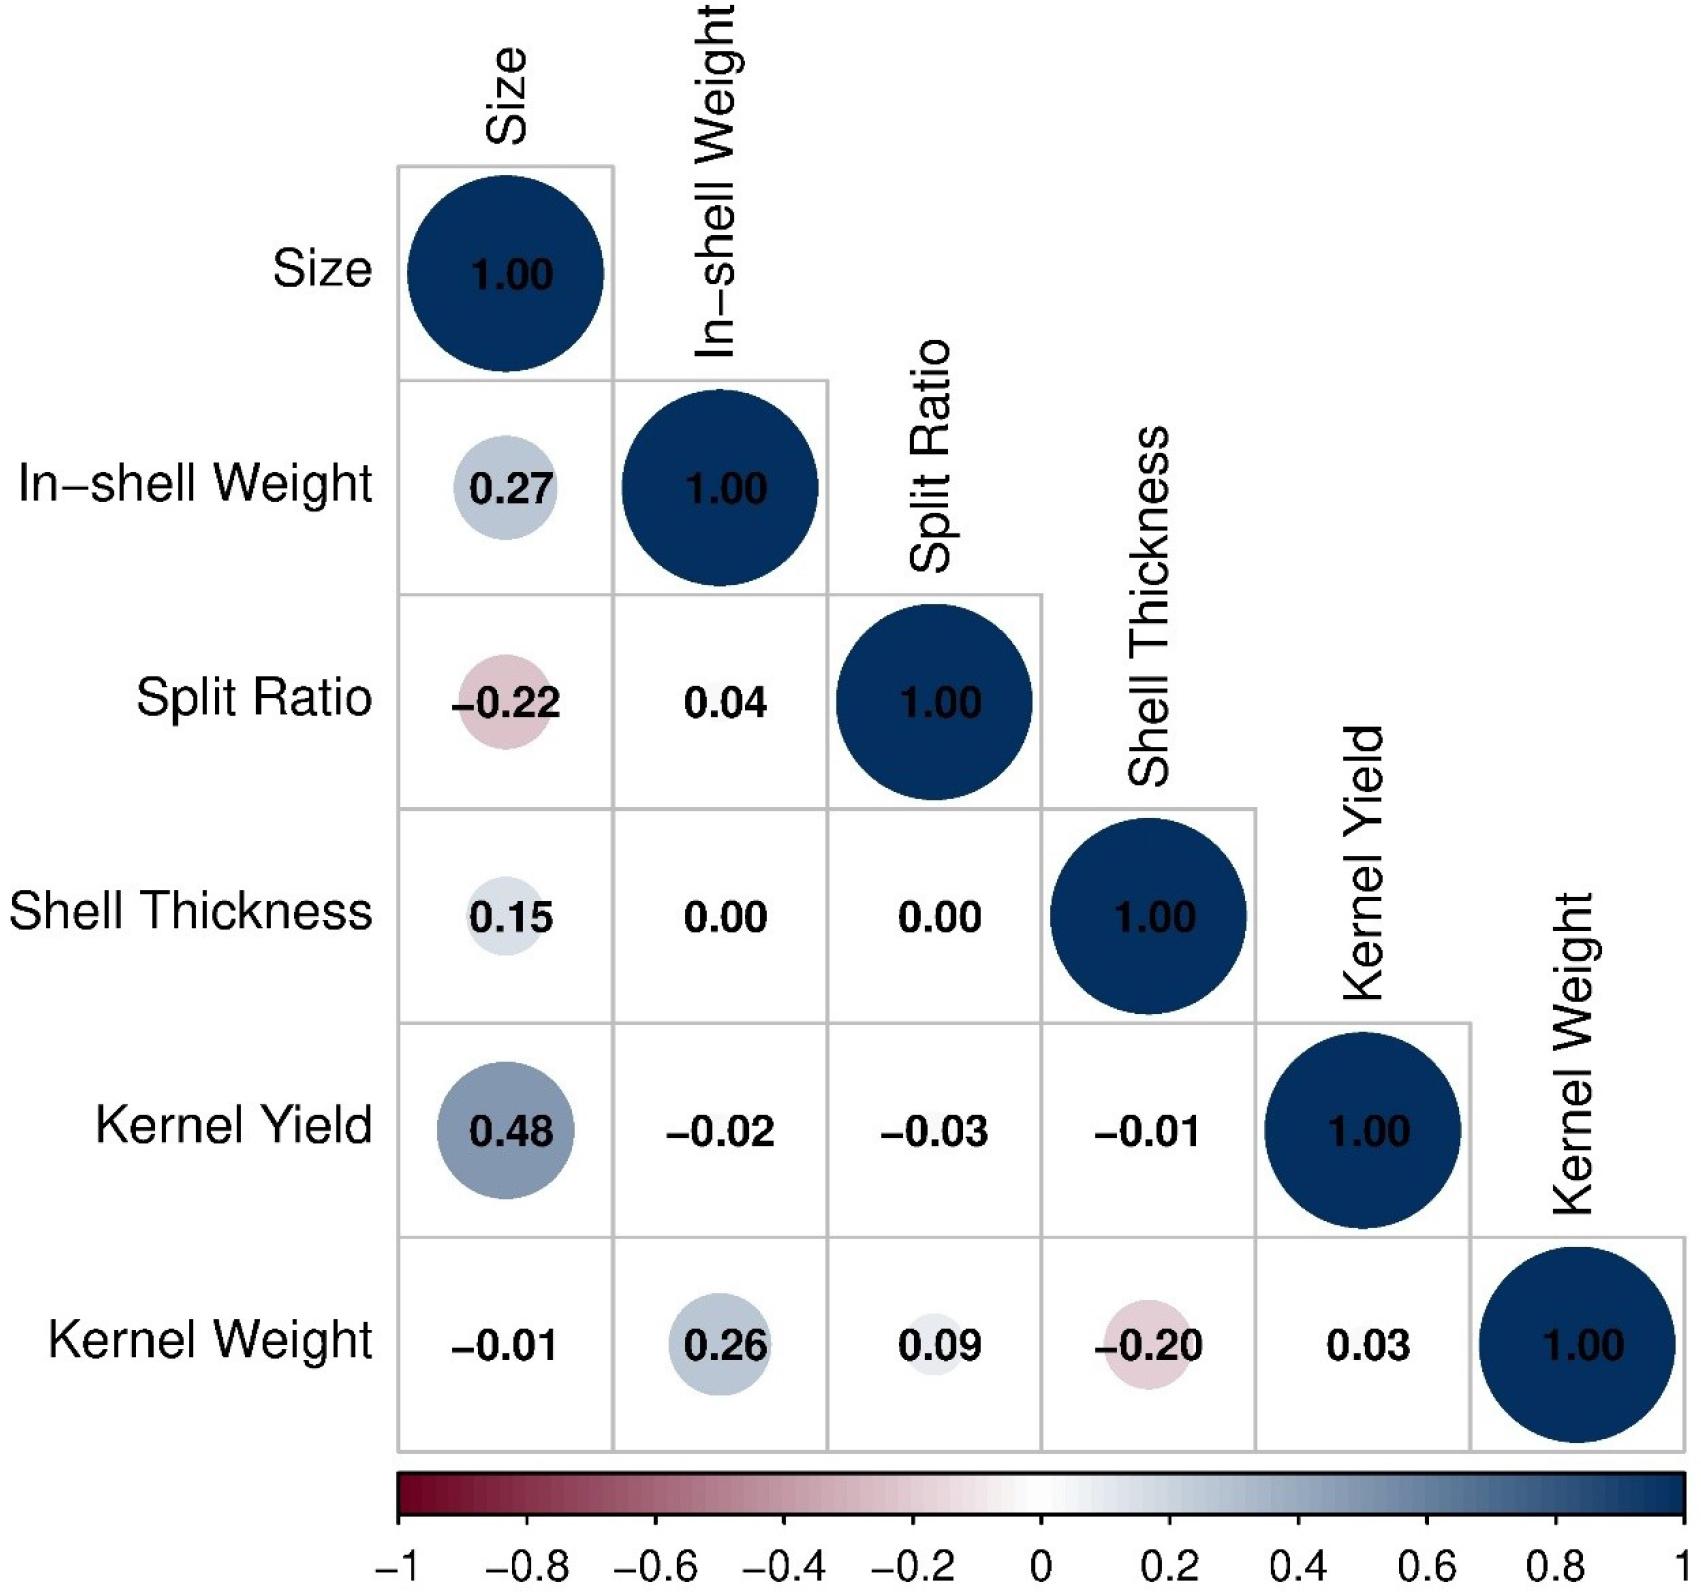
Correlation matrix of nut and kernel traits in pistachio genotypes. The color and size of the circles represent the strength and direction of Pearson’s correlation coefficients among traits, including size, in-shell weight, split ratio, shell thickness, kernel yield, and kernel weight. Positive correlations are shown in blue and negative correlations in red.
The comprehensive evaluation of 169 pistachio genotypes revealed substantial genetic diversity across all pomological traits, with CPI values ranging from -1.91 to 1.40 (Tab. 1). This remarkable variation demonstrates the rich genetic reservoir present within the germplasm collection and confirms the effectiveness of multi-trait selection approaches in pistachio improvement programs. The highly significant differences (p < 0.05) detected through analysis of variance, particularly for kernel yield (F-value = 292.82) and shell thickness (F-value = 80.72), indicate the strong genetic control of these commercially critical traits. Similar levels of genetic diversity have been documented in wild and cultivated pistachio populations across Central Asia, where studies of the wild range of P. vera have led most scholars to conclude that the crop originated in this region (though the exact location remains unclear), with the only extant wild populations occurring in Turkmenistan, Uzbekistan, Tajikistan, Kyrgyzstan, southeastern Kazakhstan, northern Afghanistan, and northeastern Iran (Whitehouse, 1957; Zohary, 1952; Khanazarov et al., 2009). The substantial phenotypic variation observed in this study parallels findings from molecular diversity studies, where Talebi et al. (2012) linked a high level of genetic diversity among P. vera to the different geographic distribution zones of analyzed accessions. Although wild pistachio drupes are smaller than domesticated ones (Zeng et al., 2019), it is impossible to confidently differentiate individual specimens of the morphotypes, due to the wide reaction norm of developmental plasticity in the species. Even nuts collected from the same tree may vary considerably in shape and size, as one recent morphological study showed that domesticated pistachio endocarps range from 9.91 to 19.15 mm in length and between 6.5411.65 mm in width (Rousou et al., 2021). This genetic richness provides a robust foundation for selective breeding, as maintaining diverse genetic resources is crucial for developing cultivars adapted to varying environmental conditions and evolving market demands. The identification of 19 elite genotypes representing the top 11.2% of evaluated germplasm demonstrates the efficiency of the Composite Performance Index in capturing superior trait combinations while maintaining genetic diversity for long-term breeding objectives.
The elite genotypes identified in this study exhibited exceptional combinations of commercially valuable traits that directly address market preferences and processing efficiency requirements. Genotype KS-168 emerged as the highest-ranking selection with exceptional kernel yield (58.80%, z-score = 2.65) and remarkably thin shell (0.53 mm, z-score = -1.65), representing a significant advancement in combining productivity with processing efficiency. Similarly, KS-103 demonstrated outstanding performance with kernel yield of 56.48% and impressive nut size (1.77 cm, z-score = 1.46), illustrating that simultaneous improvement in multiple quality parameters is genetically feasible. The identification of KS 088 possessing the thinnest shell among all genotypes (0.46 mm, z-score = -2.50) represents a critical genetic resource, as shell thickness directly impacts kernel recovery efficiency and commercial value. This trait, combined with appropriate rootstock selection, is essential for optimizing pistachio production. P. vera rootstocks express sensitivity to specific climatic and environmental conditions and have varying levels of tolerance to fungus, which influences cultivation success and, consequently, the expression of desirable kernel characteristics (Ferguson, 2008; Tekin et al., 2020). The remarkable uniformity in split ratio among selected genotypes, with 48 genotypes achieving perfect splitting (100%), demonstrates that natural dehiscence is a well-established trait in this germplasm pool. Given the immense phenotypic diversity among specimens, clear evidence for morphological change through domestication remains challenging for archaeobotanical documentation, therefore further research with more focus on the dehiscence trait is necessary (Mir-Makhamad et al., 2022). The presence of genotypes like KS-120, combining extraordinarily large nut size (2.12 cm, z-score = 2.81) with perfect split ratio, provides valuable breeding material for developing cultivars that satisfy premium market segments demanding both size and processing quality.
The correlation analysis revealed complex trait relationships that have profound implications for breeding strategy formulation and parent selection. The moderate positive correlation between size and kernel yield (r = 0.48) indicates that larger nuts tended to produce higher kernel percentages, suggesting that simultaneous improvement of these commercially important traits is achievable without antagonistic genetic effects. However, the near-zero correlations between kernel yield and split ratio (r = -0.03), shell thickness (r = -0.01), and kernel weight (r = 0.03) indicate that these characteristics are largely independent and require separate selection attention. The genetic independence of these traits is consistent with observations that pistachios can be sexually propagated, and their wild forms are not significantly different from their domesticated forms, suggesting that the landraces of pistachios observed around the world today were recently developed (Mir-Makhamad et al., 2022). As a dioecious and wind-pollinated plant, it is necessary to have enough male trees in close proximity to a female for sufficient pollination, and suitable ratios of male and female trees with appropriate distribution in an orchard are important factors taken into consideration by farmers today (Abu-Zahra and Al-Abbadi, 2007; Hormaza and Wünsch, 2007). The complex pollination requirements may have been one of the reasons for the delayed dispersal of the crop historically (Vargas et al., 2008). Despite its tolerance to numerous environmental factors, productive pistachio cultivation requires special environmental conditions, with experts suggesting that one of the most important variables in pistachio production is a hot and long summer (25–35°C) with low humidity (Everest, 2021; Tekin et al., 2020). The weak correlation between in-shell weight and kernel weight (r = 0.26) suggests that increasing nut size does not necessarily result in proportional increases in kernel mass, highlighting the importance of shell thickness management. These findings underscore the need for multi-trait selection indices that can simultaneously optimize multiple quality parameters while accounting for trait independence.
Our findings reveal significant variability in the phenological stages and harvest dates among the pistachio genotypes evaluated. KS-103 exhibited the earliest bud burst and full bloom, whereas KS-116 and KS-168 were the latest to reach harvest, aligning with findings from Burgos-Miranda et al. (2025), who reported that 'Golden Hills' pistachios bloomed approximately one week earlier than 'Kerman' and were harvested four weeks earlier, indicating genotype-dependent differences in flowering and maturation timelines. Furthermore, the flowering duration varied from 6 to 10 days among the genotypes, which is consistent with the study by Neyshaburi et al. (2021), where the flowering period of male pistachio genotypes ranged from 4 to 12 days. This variation can influence pollination efficiency and nut set, suggesting that selecting a mix of early and late-flowering genotypes could optimize yield and extend the harvest window. These findings highlight the importance of genotype selection for optimized flowering management, pollination strategies, and staggered harvesting in pistachio orchards, providing opportunities to extend the harvest period and improve overall yield management.
The classification of elite genotypes into three distinct performance groups, high-performing, efficient shell type, and balanced type, provides a practical framework for matching germplasm to specific breeding objectives and production systems. The high-performing group, characterized by superior kernel yields ranging from 48.68% to 58.80%, is particularly suitable for intensive commercial orchards where maximum productivity is prioritized. The global production of pistachios has increased dramatically over the past few decades, from around 50 thousand tons in 1970, to 500 thousand tons produced globally in 2000, to more than 1 million tons in 2020, with Iran, Turkey, and the USA continuing to maintain the highest pistachio production (FAOSTAT, 2025). The inclusion of genotype KS-001, despite its relatively low overall ranking (106th), exemplifies the importance of considering specific trait excellence rather than relying solely on composite indices. This selection philosophy aligns with historical domestication patterns, as domestication for many long-generation perennials is characterized by a shift from sexual reproduction to vegetative propagation (Zohary and Spiegel-Roy, 1975). In the case of the pistachio, the acquisition of grafting techniques would have been essential for domestication, as the tree does not lend itself to simple vegetative propagation (Zohary et al., 2012). Today, grafting is used to improve resistance to diseases, pests, and other biotic and abiotic stress, and can also lend to the creation of unusual growth forms and reduce overall plant size (Mudge et al., 2009; Wang et al., 2017). The 19 elite genotypes identified in this study represent immediate resources for cultivar release following regional trial evaluation, with their greatest value potentially lying in their use as parental material for breeding programs targeting specific trait combinations. Future research should focus on multi-location trials to assess genotype × environment interactions and stability of performance across diverse growing conditions, as P. vera grows in both semi-arid deserts and dry slopes of low mountains and foothills due to its tolerance of harsh environmental conditions (Vavilov, 1967; Whitehouse, 1957).
Based on our results, the use of a Composite Performance Index proved highly effective in distinguishing superior pistachio genotypes with desirable commercial and breeding attributes. 19 elite genotypes were identified, representing highly efficient phenotypes with contrasting strengths, including high kernel yield, thin shells, and excellent splitting ability. KS-168, KS-132, and KS-103 emerged as outstanding performers with consistently high CPI scores, while KS-058 and KS-088 demonstrated unique efficiency traits such as compact nut size combined with high kernel-to-shell ratios and ultra-thin shells. The clustering of superior genotypes into three phenotypic classes, high-yielding, efficient-shell, and balanced types, highlights the potential for targeted parental selection according to breeding objectives. Weak correlations among certain traits, such as shell thickness and kernel yield, indicate the possibility of simultaneous improvement without strong tradeoffs. The significant genetic variation observed across pomological traits confirms the richness of the evaluated germplasm and its suitability for structured improvement programs. The identified genotypes, especially those combining high kernel yield with reduced shell thickness, should be prioritized in advanced breeding and regional adaptability trials. Integrating CPI-based ranking with phenotypic clustering provides a strategic roadmap for accelerating development of pistachio cultivars with improved processing efficiency and market value. Overall, the identified elite genotypes, especially those combining high kernel yield with thin shells, should be prioritized in future hybridization, regional adaptation trials, and cultivar registration initiatives to accelerate pistachio improvement.