
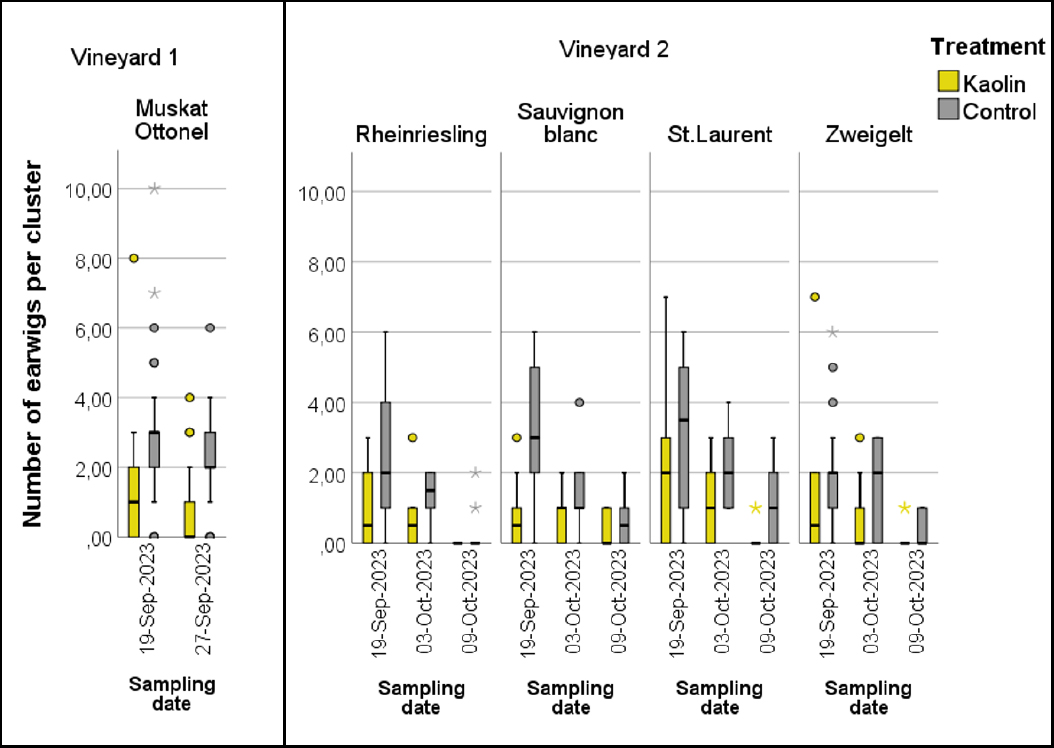
Fig. 1:
Numbers of earwigs per cluster in kaolin treated and untreated control plots. Vineyard 1: N = 100 (25/per treatment/sampling date). Vineyard 2: N = 240 (10/treatment/variety/sampling date). Each boxplot shows a median value, and the box boundaries indicate the 25th and 75th percentiles of each distribution. Outliers (values between 1.5 and three times the interquartile range) are identified with an O. Extreme values (more than three times the interquartile range) are marked with a *.