
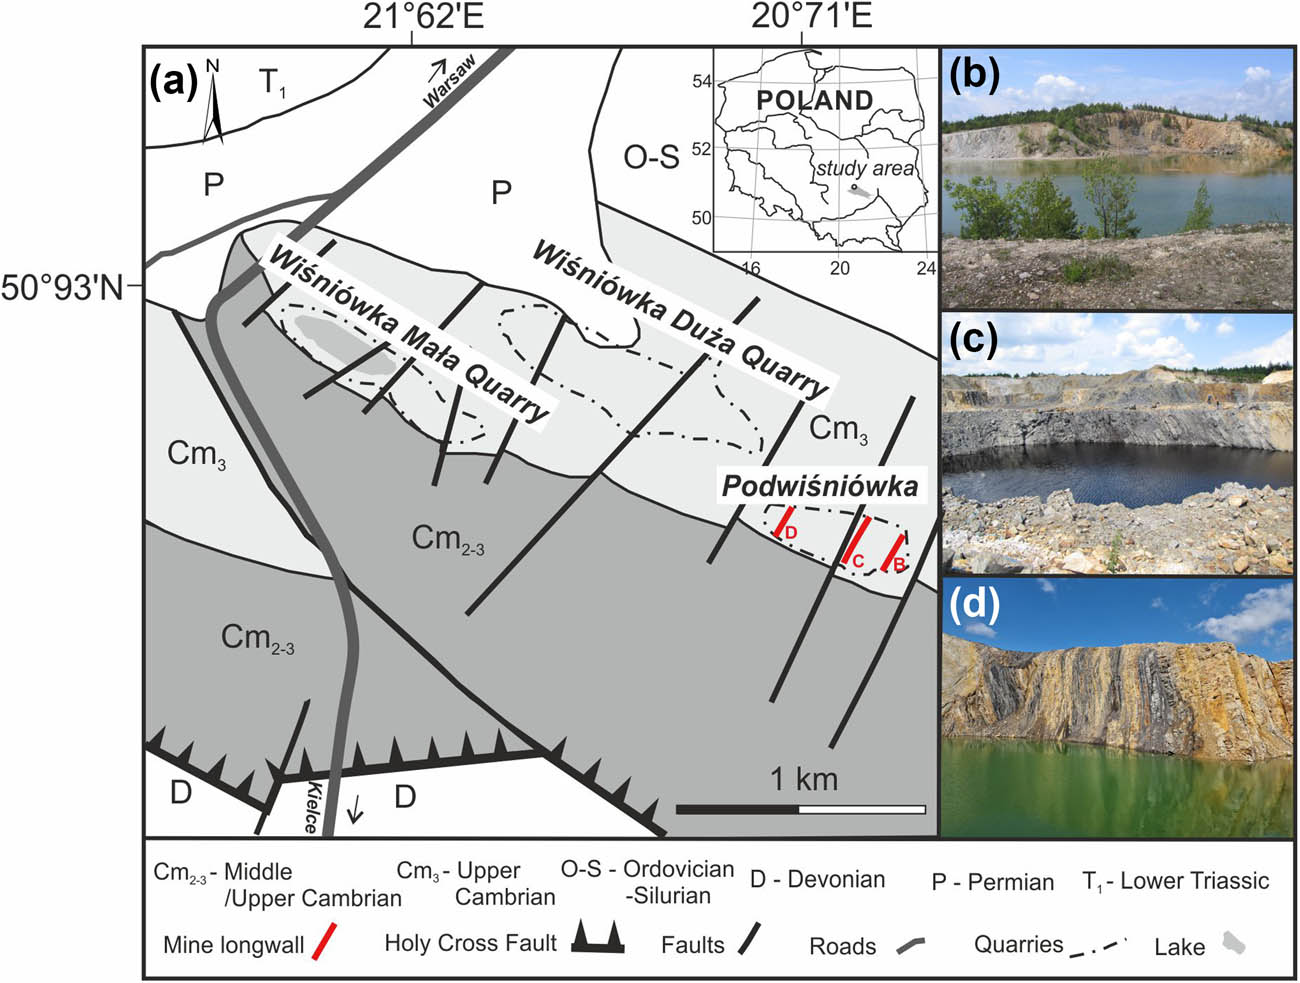
Figure 1
(a) Geologic sketch map of the Wiśniówka mine area: photos of the Podwiśniówka sampled mining longwalls in different periods of time: (b) 2004, (c) 2016, and (d) 2025.
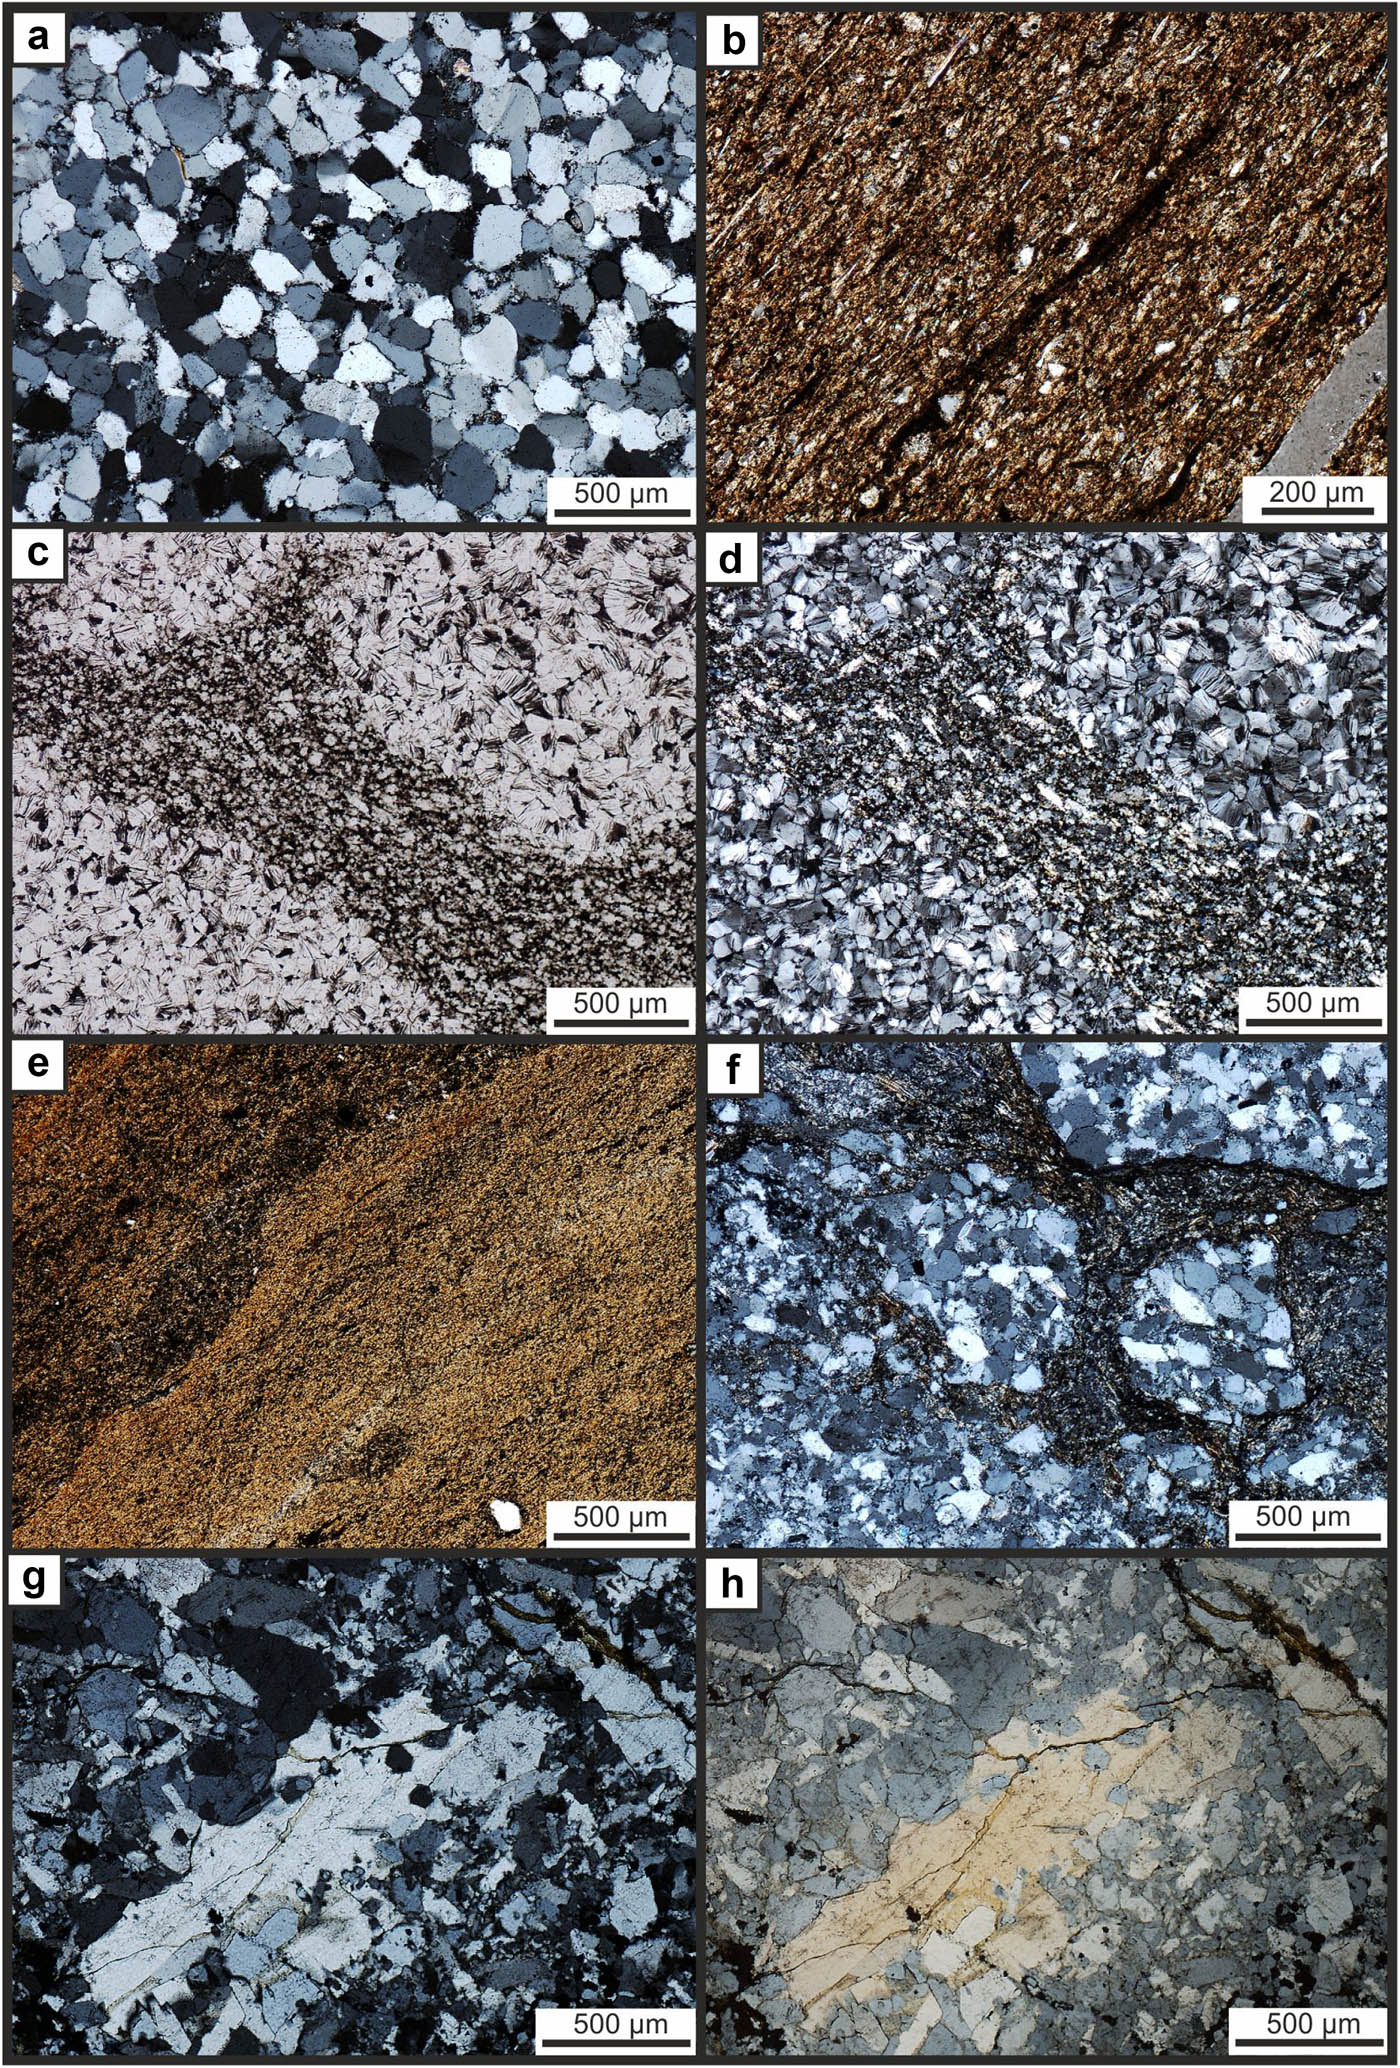
Figure 2
Optical polarized photomicrographs of characteristic rock types from the Podwiśniówka quarry in transmitted- and cross-polarized light (a–e, g) and reflected- and cross-polarized light (f, h): (a) quartzite composed of interlocked quartz grains (sample I-22), (b) clayey-silty shale made of muscovite-illite (sample borehole Pw3), (c, d) composite clay mineral aggregation composed of nacrite (dickite?) fragments cemented by muscovite-illite (sample I-25), (e) hydrothermal bentonite consisted of illite-smectite (sample Pw40), (f) a fragment of sedimentary breccia composed of pieces of quartzite cemented by clay minerals (sample Pw11B), (g, h) metaquartzite made of interlocked quartz blasts (sample V-12).
Table 1
Major and trace element concentrations and Nb/Ta ratios in rocks, pyrite and pond sediments of Podwiśniówka quarry (samples 1–22) and pond sediments of Wiśniówka Mała acid pit lake (samples 23–24)
| No. | Sample description | Al2O3 | Fe2O3 | K2O | TiO2 | Cr | Nb | Rb | Ta | V | Zr | ∑REE | Nb/Ta |
|---|---|---|---|---|---|---|---|---|---|---|---|---|---|
| % | mg/kg (ppm) | ||||||||||||
| 1. | Tuffite/bentonite | 9.56 | 0.36 | 1.50 | 0.723 | 61 | 8.62 | 47.1 | 0.63 | 57 | 172.8 | 188.93 | 13.7 |
| 2. | Tuffite/bentonite | 23.77 | 0.98 | 5.27 | 1.208 | 120 | 18.10 | 160.7 | 1.29 | 133 | 181.4 | 332.85 | 14.0 |
| 3. | Silty-clayey shale, brown | 13.79 | 30.50 | 2.88 | 0.740 | 133 | 7.52 | 63.1 | 0.54 | 105 | 188.5 | 250.54 | 13.9 |
| 4. | Clayey-silty shale, dark gray | 24.48 | 2.77 | 6.25 | 1.940 | 156 | 24.12 | 158.1 | 1.59 | 179 | 294.7 | 454.66 | 15.2 |
| 5. | Quartzite, gray | 1.69 | 0.50 | 0.33 | 0.217 | 31 | 1.02 | 7.8 | <0.01 | 11 | 57.8 | 255.52 | — |
| 6. | Clayey-silty shale, black | 19.50 | 1.26 | 4.26 | 1.178 | 118 | 16.16 | 129.2 | 1.06 | 121 | 180.1 | 320.44 | 15.2 |
| 7. | Clayey-silty shale, black | 14.88 | 8.94 | 3.18 | 0.932 | 126 | 17.06 | 118.2 | 1.16 | 91 | 267.1 | 313.20 | 14.7 |
| 8. | Clayey-silty shale, black | 18.58 | 1.57 | 4.53 | 1.275 | 136 | 20.12 | 184.2 | 1.25 | 134 | 278.2 | 455.09 | 16.1 |
| 9. | Clayey-silty shale, black | 21.84 | 2.05 | 5.29 | 1.477 | 245 | 28.99 | 202.5 | 1.84 | 173 | 326.7 | 392.44 | 15.8 |
| 10. | Pyritiferous quartzite, gray | 1.74 | 2.32 | 0.30 | 0.198 | 41 | 1.62 | 8.7 | 0.09 | 16 | 53.0 | 349.08 | 18.0 |
| 11. | Clayey-silty shale, black | 26.17 | 2.23 | 5.83 | 1.690 | 160 | 23.95 | 237.0 | 1.62 | 173 | 330.2 | 336.86 | 14.8 |
| 12. | Clayey-silty shale, black | 31.24 | 1.80 | 6.73 | 1.370 | 159 | 22.97 | 190.4 | 1.47 | 174 | 191.1 | 77.49 | 15.6 |
| 13. | Clayey-silty shale, black | 25.18 | 0.99 | 5.31 | 1.298 | 125 | 23.72 | 168.9 | 1.49 | 137 | 236.8 | 80.25 | 15.9 |
| 14. | Quartzite, gray | 3.17 | 0.67 | 0.80 | 0.235 | 32 | 2.63 | 22.5 | 0.12 | 23 | 52.7 | 95.89 | 21.9 |
| 15. | Ferruginous quartzite, brown | 1.11 | 7.74 | 0.17 | 0.313 | 58 | 1.61 | 4.8 | 0.10 | 20 | 70.4 | 112.86 | 16.1 |
| 16. | Metaquartzite, white | 0.22 | 0.12 | 0.06 | <0.010 | 34 | 0.10 | 0.6 | <0.01 | 6 | 1.8 | 2.81 | — |
| 17. | Pyrite A (with quartz) | 0.85 | 5.14 | 0.08 | 0.066 | 59 | 0.38 | 2.3 | <0.01 | 8 | 26.6 | 22.04 | — |
| 18. | Pyrite B (with quartz) | 0.12 | 16.78 | 0.01 | 0.138 | 36 | 1.03 | 1.8 | 0.07 | <5 | 60.6 | 50.82 | 14.7 |
| 19. | Pyrite C (with quartz) | 4.13 | 15.77 | 0.71 | 0.270 | 113 | 3.45 | 25.1 | 0.22 | 32 | 85.7 | 90.65 | 15.7 |
| 20. | Pyrite D (with quartz) | 0.99 | 12.66 | 0.13 | 0.112 | 49 | 1.04 | 5.0 | 0.07 | 10 | 45.2 | 40.2 | 14.9 |
| 21. | Pond sediment 1/Pw (west) | 17.61 | 6.26 | 4.19 | 1.079 | 180 | 19.05 | 158.4 | 1.20 | 144 | 216.1 | 329.57 | 15.9 |
| 22. | Pond sediment 2/Pw (east) | 6.79 | 1.57 | 1.34 | 0.369 | 33 | 4.78 | 49.3 | 0.20 | 34 | 127.1 | 98.29 | 23.9 |
| 23. | Pond sediment 1/WM (west) | 14.42 | 2.08 | 2.89 | 0.973 | 101 | 13.28 | 103.6 | 0.83 | 89 | 190.8 | 308.22 | 16.0 |
| 24. | Pond sediment 2/WM (east) | 18.65 | 2.26 | 3.74 | 1.153 | 128 | 17.91 | 128.6 | 1.19 | 121 | 203.8 | 373.21 | 15.0 |
| Mean concentration | 12.52 | 5.30 | 2.74 | 0.824 | 101 | 11.6 | 90.7 | 0.752 | 87 | 160.0 | 222.16 | 16.0** | |
| Upper continental crust* | 15.4 | 5.04 | 2.80 | 0.64 | 92 | 12 | 84 | 0.9 | 97 | 193 | 148.14 | 13.3 | |
NOTE: * derived from Rudnick and Gao (2014), **15.0 for carbonaceous clayey-silty shales, tuffites/bentonites and pyrite.
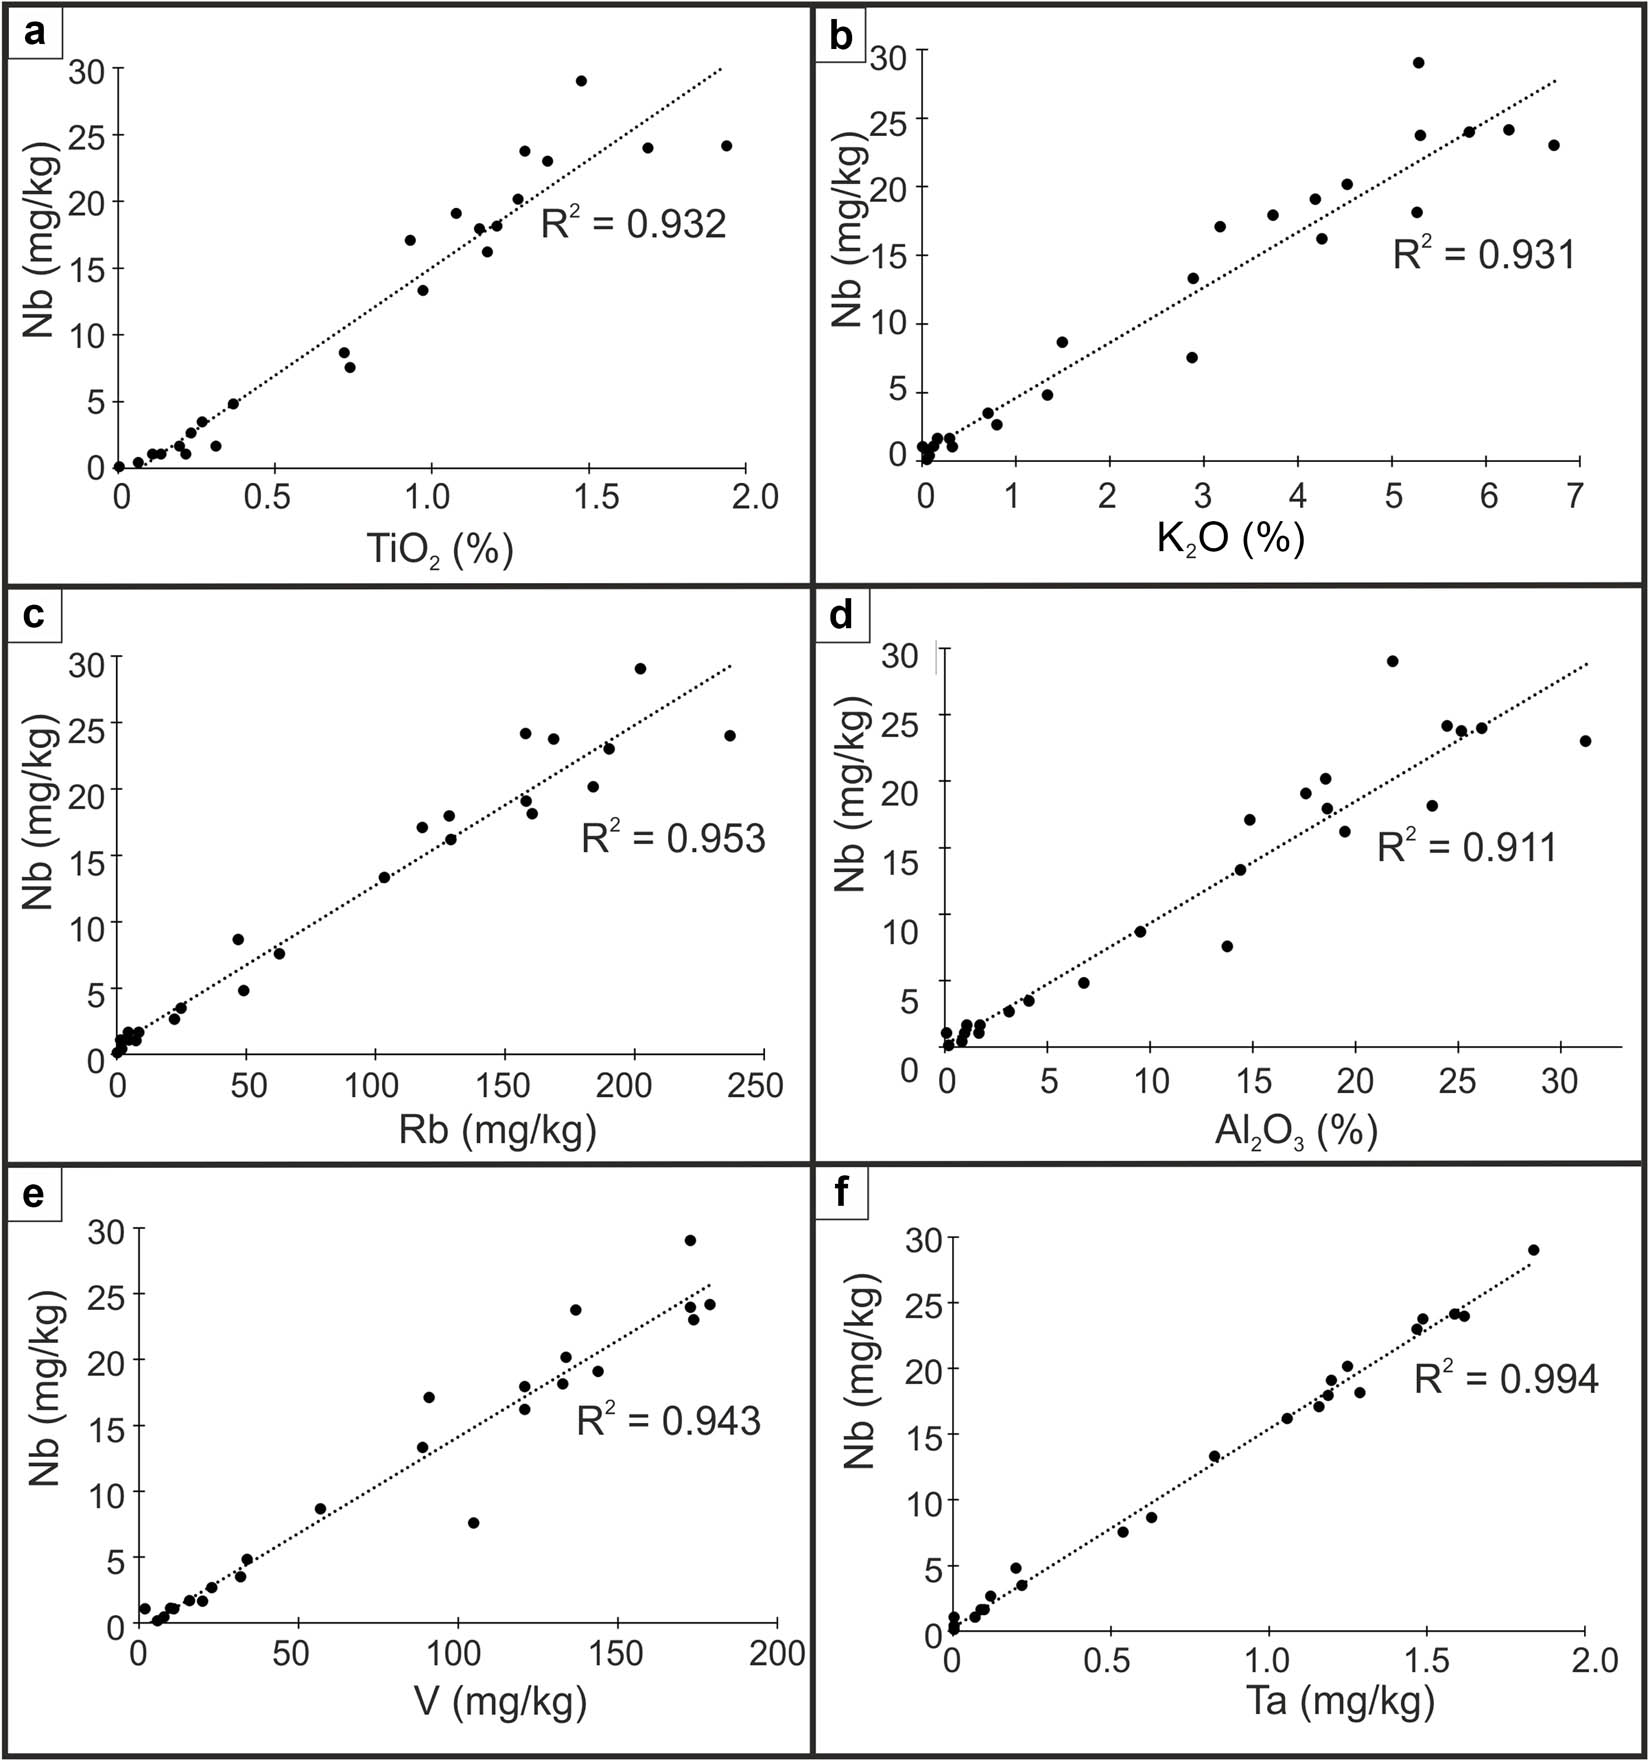
Figure 3
Selected determination coefficients (R 2) between the following element pairs: Nb–TiO2, Nb–K2O, Nb–Rb, Nb–Al2O3, Nb–V, and Nb–Ta in rocks, pyrite, and pond sediments of Podwiśniówka active quarry and pond sediments of Wiśniówka Mała historic acid pit lake (Table 1 for chemical analysis).
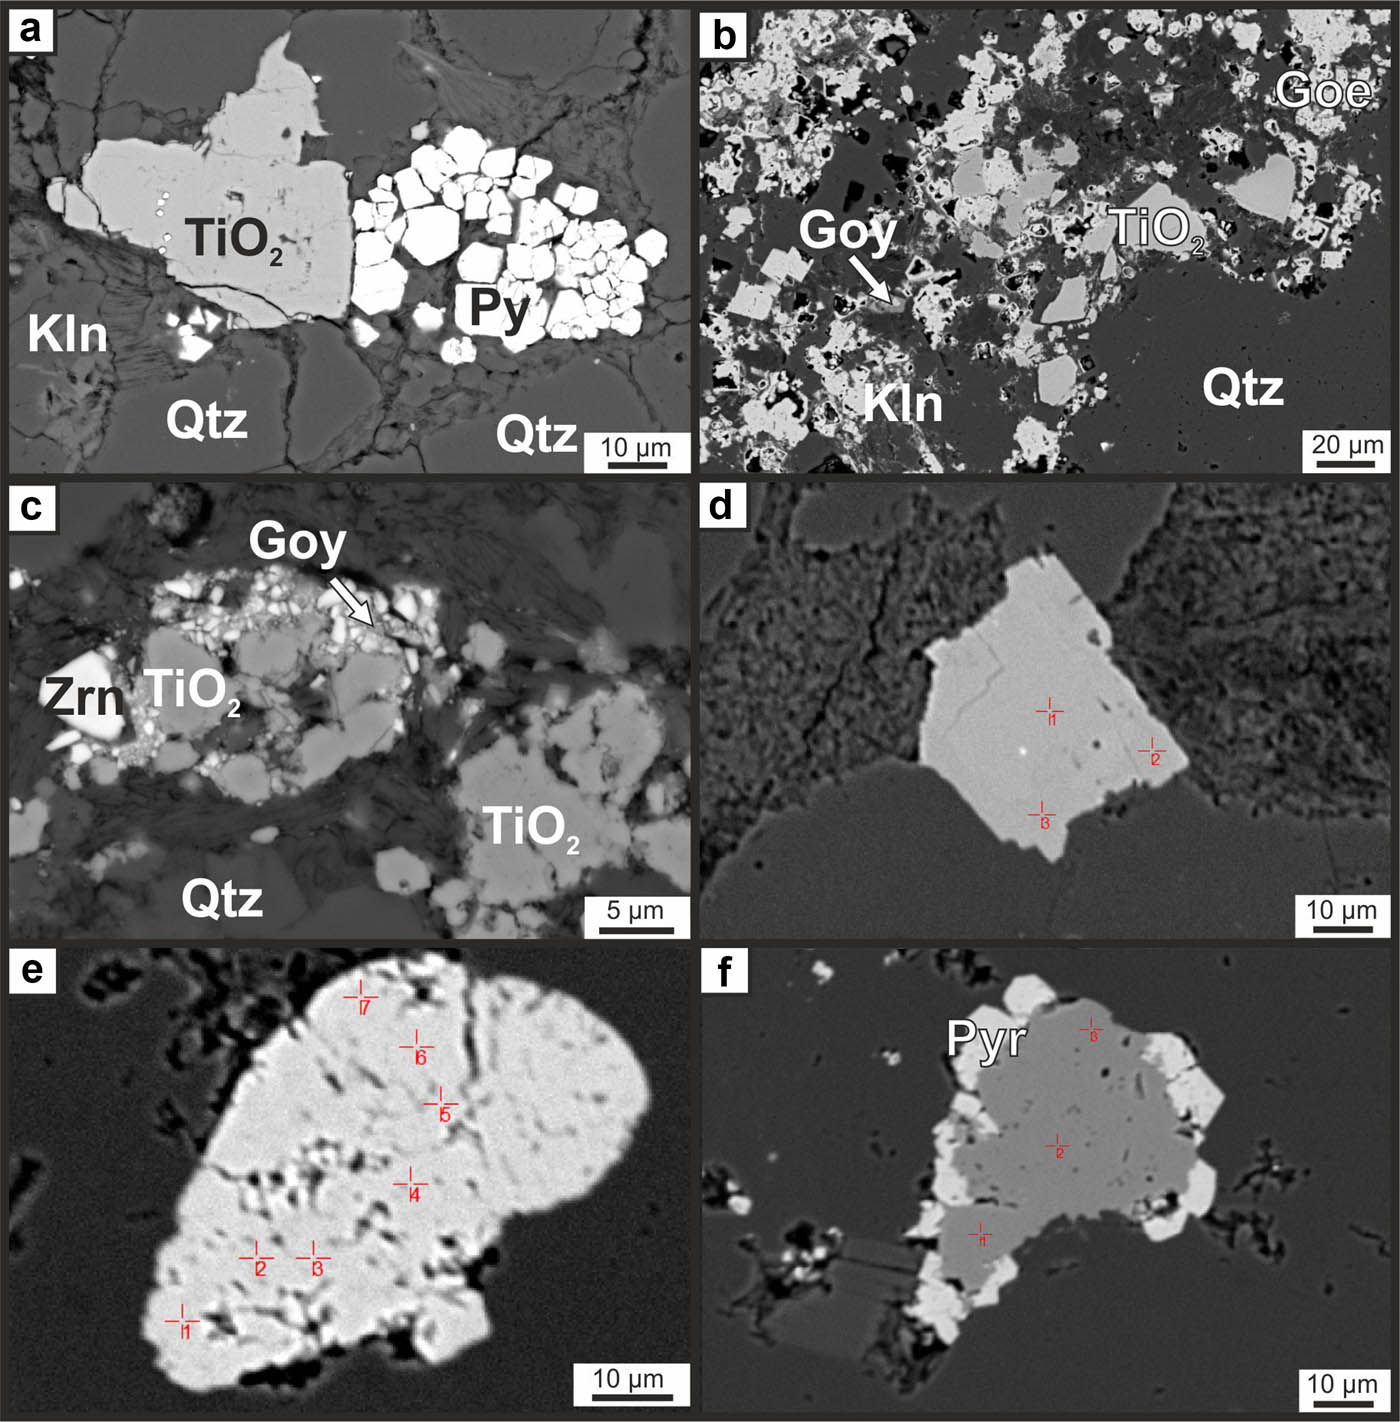
Figure 4
Back-scattered SEM photomicrographs: (a) TiO2 polymorph agglomeration with tiny pyrite inclusions (closely infilling a microvoid) associated with low-temperature kaolinite and pyrite aggregations (sample Pw38), (b) accumulation of TiO2 polymorphs, goethite, goyazite and kaolinite (sample Pw3), (c) TiO2 polymorph agglomeration with accumulations of goyazite and hydrothermal zircon (sample Pw3); Back-scattered EMP photomicrographs of TiO2 polymorphs with measuring points in samples: (d) Pw6 – rutile, (e) Pw-33 – anatase and (f) Pw39 – anatase-rutile (results derived from microanalysis of raster points are given in Table 3). Mineral abbreviations for Figure 4: Kln – kaolinite (nacrite, dickite?), Py – pyrite, Qtz – quartz, and Zrn – zircon.
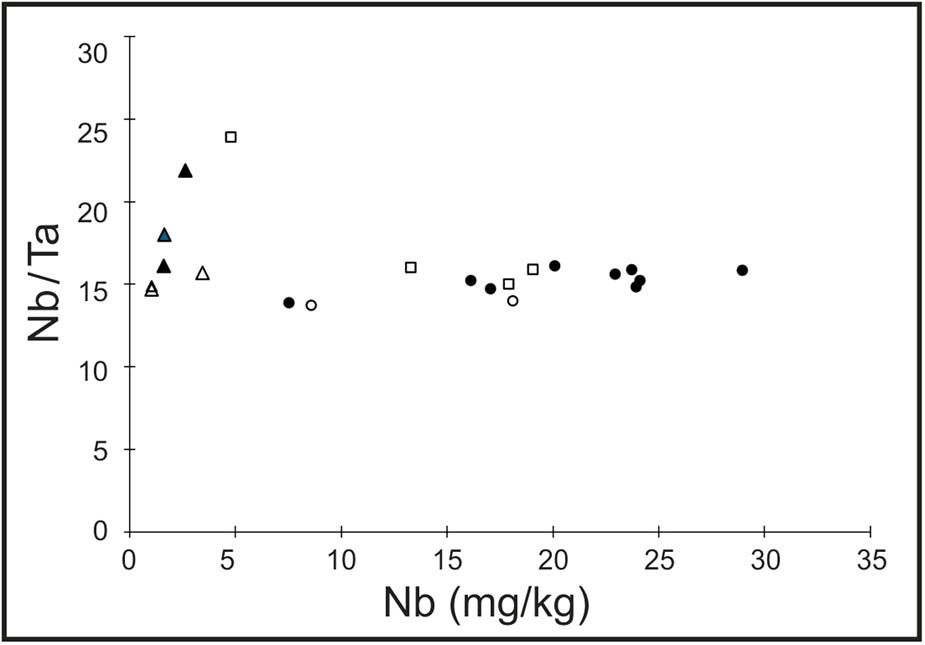
Figure 5
Variations of Nb/Ta ratio versus Nb concentrations in examined rocks, pyrite, and sediments. Note: ● organic-rich clayey-silty shale, ○ tuffite/bentonite, ∆ pyrite, ▲ quartzite/quartzitic sandstone, □ pond sediment.
Table 2
Contents of Ti, Nb, Ta, Ce, Cr, and Zr in TiO2 polymorphs of the Wiśniówka study area based on EMP measurements
| Element (N = 101) | Mean ± SD | Range |
|---|---|---|
| wt% | ||
| Ti | 58.7 ± 0.789 | 55.2–59.7 |
| Nb | 0.18 ± 0.16 | <0.01–0.96 |
| Ta | 0.02 ± 0.02 | <0.01–0.07 |
| Ce | 0.14± 0.06 | <0.01–0.27 |
| Cr | 0.04 ± 0.04 | <0.01–0.26 |
| Zr | 0.09 ± 0.10 | <0.01–0.58 |
NOTE: TiO2 polymorphs included anatase, rutile, mixed rutile-anatase and rutile-brookite phases, and brookite, which cannot be identified by optical and electron microscopy or EMP (discussed in Migaszewski & Gałuszka, 2023); V contents were below detection limits.
Table 3
Contents of Ti, Nb, Ta, Ce, Cr, and Zr (wt%) in TiO2 polymorph phases in selected samples based on EMPA measurements
| Sample | Ti | Nb | Ta | Ce | Cr | Zr | Nb/Ta | Nb/Zr |
|---|---|---|---|---|---|---|---|---|
| Pw6/06 Rutile | 58.80 | 0.29 | 0.03 | 0.20 | 0.09 | <0.01 | 9.7 | — |
| 58.86 | 0.13 | <0.01 | 0.08 | 0.02 | 0.14 | — | 0.9 | |
| 58.81 | 0.13 | 0.01 | 0.15 | 0.02 | 0.12 | 13.0 | 1.1 | |
| Pw33/03 Anatase | 57.92 | 0.40 | 0.04 | 0.08 | 0.03 | 0.02 | 10.0 | 20.0 |
| 57.22 | 0.18 | 0.04 | 0.14 | 0.03 | 0.08 | 4.5 | 2.2 | |
| 59.13 | 0.12 | <0.01 | 0.15 | 0.04 | 0.03 | — | 4.0 | |
| 58.80 | 0.21 | 0.04 | 0.16 | 0.01 | 0.18 | 5.2 | 1.2 | |
| 56.99 | 0.18 | 0.04 | 0.11 | <0.01 | 0.07 | 4.5 | 2.6 | |
| 59.02 | 0.16 | 0.04 | 0.20 | 0.01 | 0.07 | 4.0 | 2.3 | |
| 58.38 | 0.27 | 0.04 | 0.12 | 0.02 | 0.10 | 6.8 | 2.7 | |
| Pw39/10 Anatase-rutile | 58.19 | 0.34 | 0.03 | 0.19 | 0.03 | 0.08 | 11.3 | 4.2 |
| 59.27 | 0.04 | 0.03 | 0.12 | <0.01 | <0.01 | 1.3 | — | |
| 58.55 | 0.20 | <0.01 | 0.17 | <0.01 | <0.01 | — | — |
NOTE: Measuring points are given in Figure 4; V contents were below detection limits.
Table 4
Nb and Ta contents and Nb/Ta ratios in TiO2 polymorph types of individual samples based on EMPA measurements
| Sample | Nb | Ta | Nb/Ta | Sample | Nb | Ta | Nb/Ta |
|---|---|---|---|---|---|---|---|
| Pw6 | 0.02 | 0.03 | 0.7 | Pw34 | 0.06 | 0.03 | 2.0 |
| 0.34 | 0.02 | 17.0 | 0.10 | 0.03 | 3.3 | ||
| 0.29 | 0.03 | 9.7 | 0.19 | 0.02 | 9.5 | ||
| 0.13 | 0.01 | 13.0 | 0.18 | 0.04 | 4.5 | ||
| 0.29 | 0.02 | 14.5 | 0.14 | 0.03 | 4.7 | ||
| 0.17 | 0.02 | 8.5 | 0.96 | 0.02 | 48.0 | ||
| 0.22 | 0.03 | 7.3 | 0.11 | 0.02 | 5.5 | ||
| 0.28 | 0.02 | 14.0 | 0.69 | 0.02 | 34.5 | ||
| 0.51 | 0.03 | 17.0 | 0.25 | 0.02 | 12.5 | ||
| 0.28 | 0.02 | 14.0 | 0.27 | 0.02 | 13.5 | ||
| Pw10 | 0.04 | 0.04 | 1.0 | 0.18 | 0.05 | 3.6 | |
| 0.09 | 0.02 | 4.5 | 0.18 | 0.03 | 6.0 | ||
| 0.11 | 0.04 | 2.8 | Pw39 | 0.07 | 0.04 | 1.8 | |
| 0.10 | 0.04 | 2.5 | 0.14 | 0.02 | 7.0 | ||
| 0.08 | 0.03 | 2.7 | 0.14 | 0.02 | 7.0 | ||
| 0.14 | 0.01 | 14.0 | 0.28 | 0.02 | 14.0 | ||
| 0.08 | 0.02 | 4.0 | 0.41 | 0.03 | 13.7 | ||
| 0.11 | 0.02 | 5.5 | 0.44 | 0.07 | 6.3 | ||
| 0.11 | 0.02 | 5.5 | 0.65 | 0.05 | 13.0 | ||
| 0.09 | 0.04 | 2.2 | 0.09 | 0.05 | 1.8 | ||
| 0.01 | 0.01 | 1.0 | 0.12 | 0.05 | 2.4 | ||
| 0.08 | 0.03 | 2.7 | 0.34 | 0.03 | 11.3 | ||
| Pw33 | 0.10 | 0.04 | 2.5 | 0.04 | 0.03 | 1.3 | |
| 0.06 | 0.02 | 3.0 | 0.26 | 0.02 | 13.0 | ||
| 0.06 | 0.01 | 6.0 | 0.04 | 0.04 | 1.0 | ||
| 0.11 | 0.02 | 5.5 | Pw3/81.1-81.2 | 0.22 | 0.02 | 11.0 | |
| 0.10 | 0.04 | 2.5 | 0.17 | 0.04 | 4.2 | ||
| 0.08 | 0.05 | 1.6 | 0.19 | 0.02 | 9.5 | ||
| 0.08 | 0.01 | 8.0 | 0.38 | 0.05 | 7.6 | ||
| 0.06 | 0.02 | 3.0 | 0.37 | 0.04 | 9.2 | ||
| 0.08 | 0.03 | 2.7 | 0.07 | 0.02 | 3.5 | ||
| 0.08 | 0.04 | 2.0 | 0.05 | 0.04 | 1.2 | ||
| 0.04 | 0.02 | 2.0 | 0.01 | 0.02 | 0.5 | ||
| 0.08 | 0.05 | 1.6 | 0.64 | 0.02 | 32.0 | ||
| 0.40 | 0.04 | 10.0 | |||||
| 0.18 | 0.04 | 4.5 | |||||
| 0.21 | 0.04 | 5.2 | |||||
| 0.18 | 0.04 | 4.5 | |||||
| 0.16 | 0.04 | 4.0 | |||||
| 0.27 | 0.04 | 6.8 |
NOTE: Nb and Ta contents <0.01 wt% are excluded.