
1. Introduction
Niobium and tantalum are two rare metals that are considered to be critical and strategic elements. These two transition metals are placed in group 5 of the periodic table; niobium is in period 5, whereas tantalum is below in period 6. This vertical alignment implies their similar physical and chemical properties. The same valence state (+5), nearly identical atomic radii of niobium and tantalum (146 vs. 149 pm), and octahedral coordination cause these two metals to co-exist in the same minerals (BenchChem, 2026). Along with titanium and zirconium, niobium and tantalum belong to the high-field strength elements (HFSEs). These refractory metals are known for high melting points (>2,000°C) as well as high density and hardness.
The concentration of niobium and tantalum in the upper continental crust averages 12 and 0.9 mg/kg, respectively (Rudnick & Gao, 2014). Naturally occurring niobium consists almost entirely of the isotope 93Nb, whereas tantalum is composed of the isotope 181Ta (NERC-BGS, 2011). Both metals occur in a range of mineral species, primarily in columbite-tantalite, named also “Coltan” (Fe, Mn)(Nb, Ta)2O6, and pyrochlore (Na, Ca)2Nb2O6(O, H, F) and aeschynite (Ce, Ca, Fe, and Th)(Ti, Nb)2(O, OH)6 groups. These minerals tend to accumulate in more alkalic igneous rocks and in late or post-magmatic products, including pegmatites, aplites, greisens, and carbonatites (Dutta & Ladhari, 2018). Three main Nb–Ta deposits have been distinguished: (i) carbonatites and associated rocks (Nb), (ii) alkaline granites and peralkaline syenites (Ta, Nb, and REEs), (iii) granites and pegmatites of the Li–Cs–Ta group forming the so-called pegmatites (Melcher et al., 2017).
Of several oxide minerals, rutile (TiO2) incorporates minor to substantial quantities of Nb and Ta. Geochemical characteristics of non-hydrothermal (detrital) and magmatic-hydrothermal rutile have been used in the study of mature sediments, as a geothermometer, and to fingerprint various petrogenetic origins (e.g., Ayers & Watson, 1993; Zack et al., 2004a; Schirra & Laurent, 2021; Migaszewski & Gałuszka, 2023). In addition, U-abundant rutile from high-grade metamorphic rocks has found applications in U–Pb geochronology and (U–Th)/He thermochronology (Meinhold, 2010).
Siliciclastic-volcanogenic rocks of the Wiśniówka massif are highlighted by the presence of sediment-hosted stratiform pyrite-goethite/hematite-REE mineralization zones leading to the generation of acid mine drainage. This mineralization may be classified as sedimentary-exhalative (SEDEX)-type metal ore deposits. Most pyrite and Fe-(hydr-)oxides exhibit high concentrations of arsenic with a mean of 1.86 and 2.81 wt%, respectively. These high As abundances are unusual in hard rock mining worldwide (Migaszewski & Gałuszka, 2025). The main objectives of this contribution are to: (i) identify Nb-Ta-bearing mineral phases, (ii) determine chemical composition of the most abundant Nb-Ta-rich minerals, (iii) describe geologic conditions of their formation based on microtextural characterization and Nb/Ta ratios.
2. Material and methods
2.1. Outline of geologic setting
The Wiśniówka Upper Cambrian massif (western Main Range of the Holy Cross Mts.) consists of alternating quartzites, quartzitic sandstones and siltstones (also called “Łysogóry quartzites”), clayey-silty shales, locally with tuffite and bentonite interbeds (e.g., Czermiński, 1959; Jaworowski & Sikorska, 2006; Żylińska et al., 2006; Migaszewski & Gałuszka, 2019, 2023 and references therein). The rock siliciclastic–volcanogenic series are intensely faulted, sheared, and sliced and, locally, within fault zones, affected by hydrothermal metasomatism (Migaszewski & Gałuszka, 2019). The quartzites and quartzitic sandstones have been extracted for over a century, leaving numerous tailings piles, acid ponds, and pools, occasionally with extremely high arsenic concentrations reaching 3.86 g/L (Migaszewski et al., 2019; Migaszewski & Gałuszka, 2023). The rock beds are currently exposed at two active quarries: Podwiśniówka (lower Upper Cambrian) and Wiśniówka Duża (middle Upper Cambrian) (Figure 1).
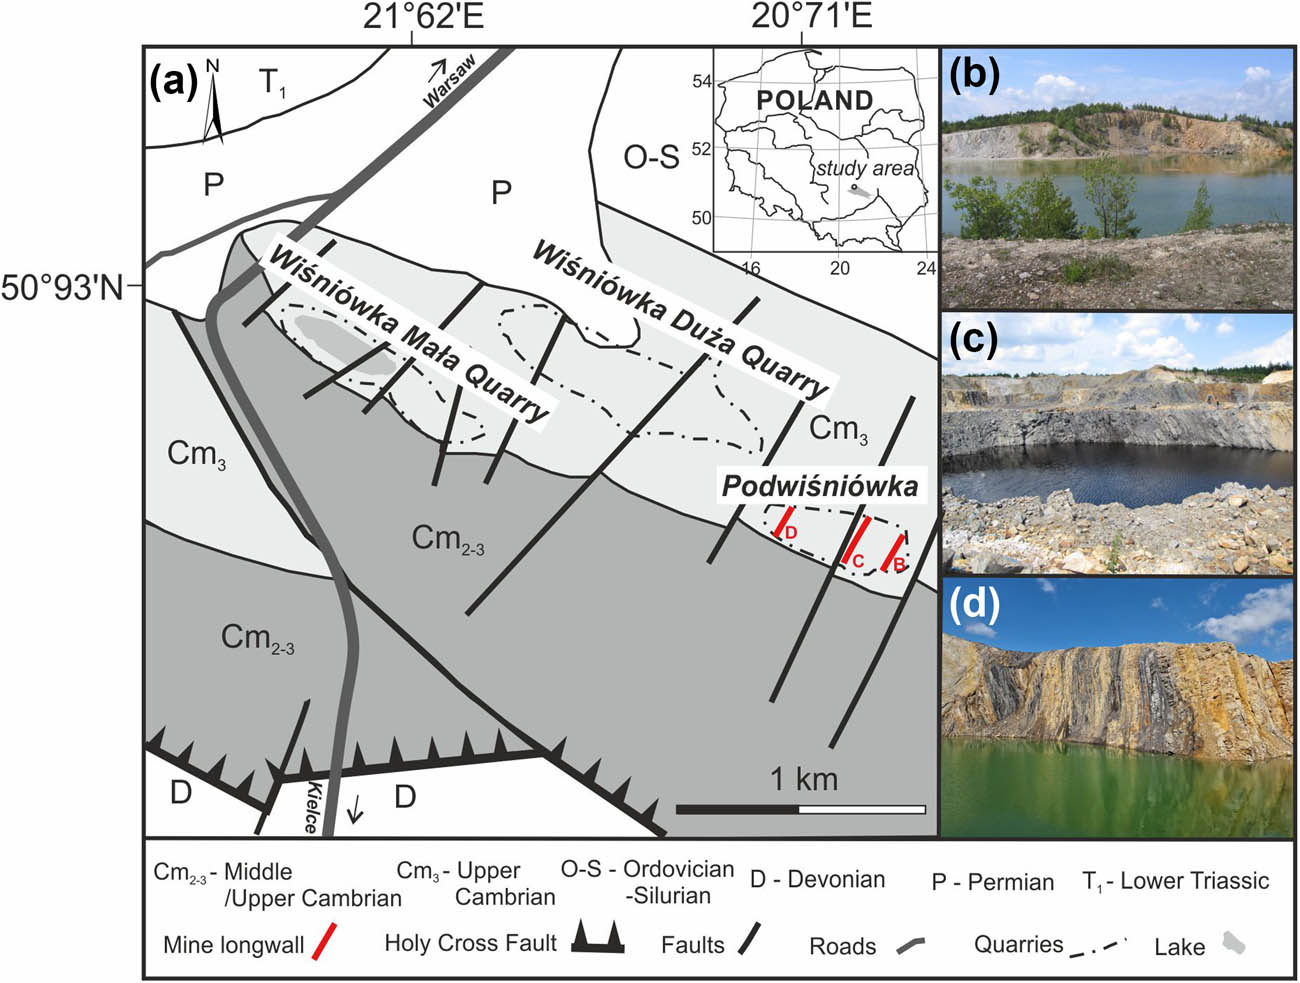
Figure 1
(a) Geologic sketch map of the Wiśniówka mine area: photos of the Podwiśniówka sampled mining longwalls in different periods of time: (b) 2004, (c) 2016, and (d) 2025.
2.2. Sample collection, preparation and analysis
A total of 24 samples, including quartzites/quartzitic sandstones, clayey-silty shales, tuffite, pyrite, and sediments weighing 0.3–1.0 kg each, were collected from two open pits: Podwiśniówka (rocks, pyrite, and sediment) and Wiśniówka Mała (sediment) (Figure 1a). The different operating mine longwalls of the Podwiśniówka quarry from which rock and pyrite samples were taken are depicted in Figure 1b–d. Samples were placed in labeled polyethylene bags to prevent accidental mixing and contamination.
After drying at ambient temperature, the samples were pulverized to pass a <0.063 mm sieve employing a Fritsch’s blender and then an Analysette 3 Spartan shaker. Prior to chemical analysis, the powdered samples were totally digested with a mixture of HCl + HNO3 + HF + HClO4 (3:2:1:2). For the purpose of this study, the duplicate samples were analyzed for Cr, Nb, Rb, Ta, V, Zr, and REEs, using inductively coupled plasma quadrupole mass spectrometry (ICP-QMS; spectrometer ELAN DRC II, Perkin Elmer). These samples were also analyzed for Al2O3, Fe2O3, K2O, and TiO2 employing X-ray fluorescence spectrometry (XRF; spectrometer Philips PW 2400). Two samples were randomly selected for routine replicate analyses, and international standards, i.e., Lake Sediment LKSD-3, Stream Sediment STSD-1, Riverclay 921, Tonschieffen TS, Microdiorite OV-4, and Shale OV-6, were inserted accordingly. Quality control included both accuracy (SRM) and precision (triplicates). The average recovery of these elements was in the range of 85–110%, whereas the uncertainty was below 10%. The relative standard deviation (RSD) values were <3%. The geochemical analyses were performed at the accredited Central Chemical Laboratory of the Polish Geological Institute – National Research Institute (PGI–NRI) in Warsaw.
The rock samples were investigated on polished thin sections (optical polarized microscopy) and carbon-coated polished thin sections (SEM-EDS, EMPA). Rocks were examined petrographically in transmitted and reflected light employing a polarized microscope, Nikon LV 100 Pol. Detailed mineralogical and microtextural characterization and imaging were performed using a scanning electron microscope (SEM), model LEO 1430 with an EDS ISIS Detector (Oxford Instruments Ltd.). For this study, the following parameters were applied: signal A – backscattered electron (BSE) and secondary electron (SE), magnification 1.18–5.93k×, acceleration voltage (EHT) 20 kV, working distance (WD) 21 mm.
The measurements of Nb, Ta, and Ce, Cr, Ti, and Zr contents on TiO2 polymorphs and other accompanying minerals were performed using an electron microprobe (EMPA, model Cameca SX-100) equipped with five wavelength dispersive spectrometers. The following analytical parameters were applied: EHT was set at 15 keV, beam current at 20–30 nA, beam spot diameter at 1–5 μm in the BSE mode, counting times were 20 s on peak, and 10 s on background. Cameca standard materials included: orthoclase K[AlSi3O8], rutile TiO2, skutterudite CoNiAs3, chalcopyrite CuFeS2, pentlandite (Ni,Fe)9S8, and zircon Zr[SiO4]. The average detection limit was 0.01 mg/kg for this analytical method. The optical polarized microscope examinations were performed at the Environmental Analytical Laboratory, Institute of Chemistry, Jan Kochanowski University in Kielce, whereas the SEM-EDS examination and EMP microanalysis were conducted at the Polish Geological Institute – National Research Institute in Warsaw.
3. Results and discussion
3.1. Bulk niobium and tantalum concentrations in rocks
The most representative rock types of the Podwiśniówka quarry are depicted in Figure 2. Of the different lithotypes, quartzites/quartzitic sandstones and clayey-silty shales made of quartz and muscovite/illite and illite-smectite are prevalent (Figure 2a, b). The other rock types are subordinate, including occasionally a variety of clayey shales composed of muscovite/illite- nacrite (dickite?) agglomerations (Figure 2c, d), hydrothermal-sedimentary bentonites made of predominant illite-smectite (Figure 2e), sedimentary quartzitic-clayey breccias (Figure 2f), and metaquartzites (Figure 2g, h). Hydrothermal-sedimentary bentonites dominate over their volcano-sedimentary counterparts that occur only in the southern part of the Podwiśniówka section and are devoid of pyrite mineralization (Migaszewski et al., 2008). More detailed X-ray structural examinations (Szczerba & Kuligiewicz, 2018) have indicated that clayey-silty shales contain illite-smectite (range of 7.7–43.2%), muscovite-illite 2M1 (4.9–68.5%), muscovite-illite 1 M (0.7–16.6%), occasionally kaolinite (0.5–10.3%) and dickite (0.4–1.8%). The previous study also documented the presence of nacrite efflorescences in a quartzite-pyrite breccia (Migaszewski et al., 2008). It should be emphasized that hydrothermal-type bentonites can be confined to marginal continental orogens with deep fault zones, at the edges of continental blocks, similarly to what has been reported in Primorsky Krai, Russia (Belousov & Karelina, 2022).
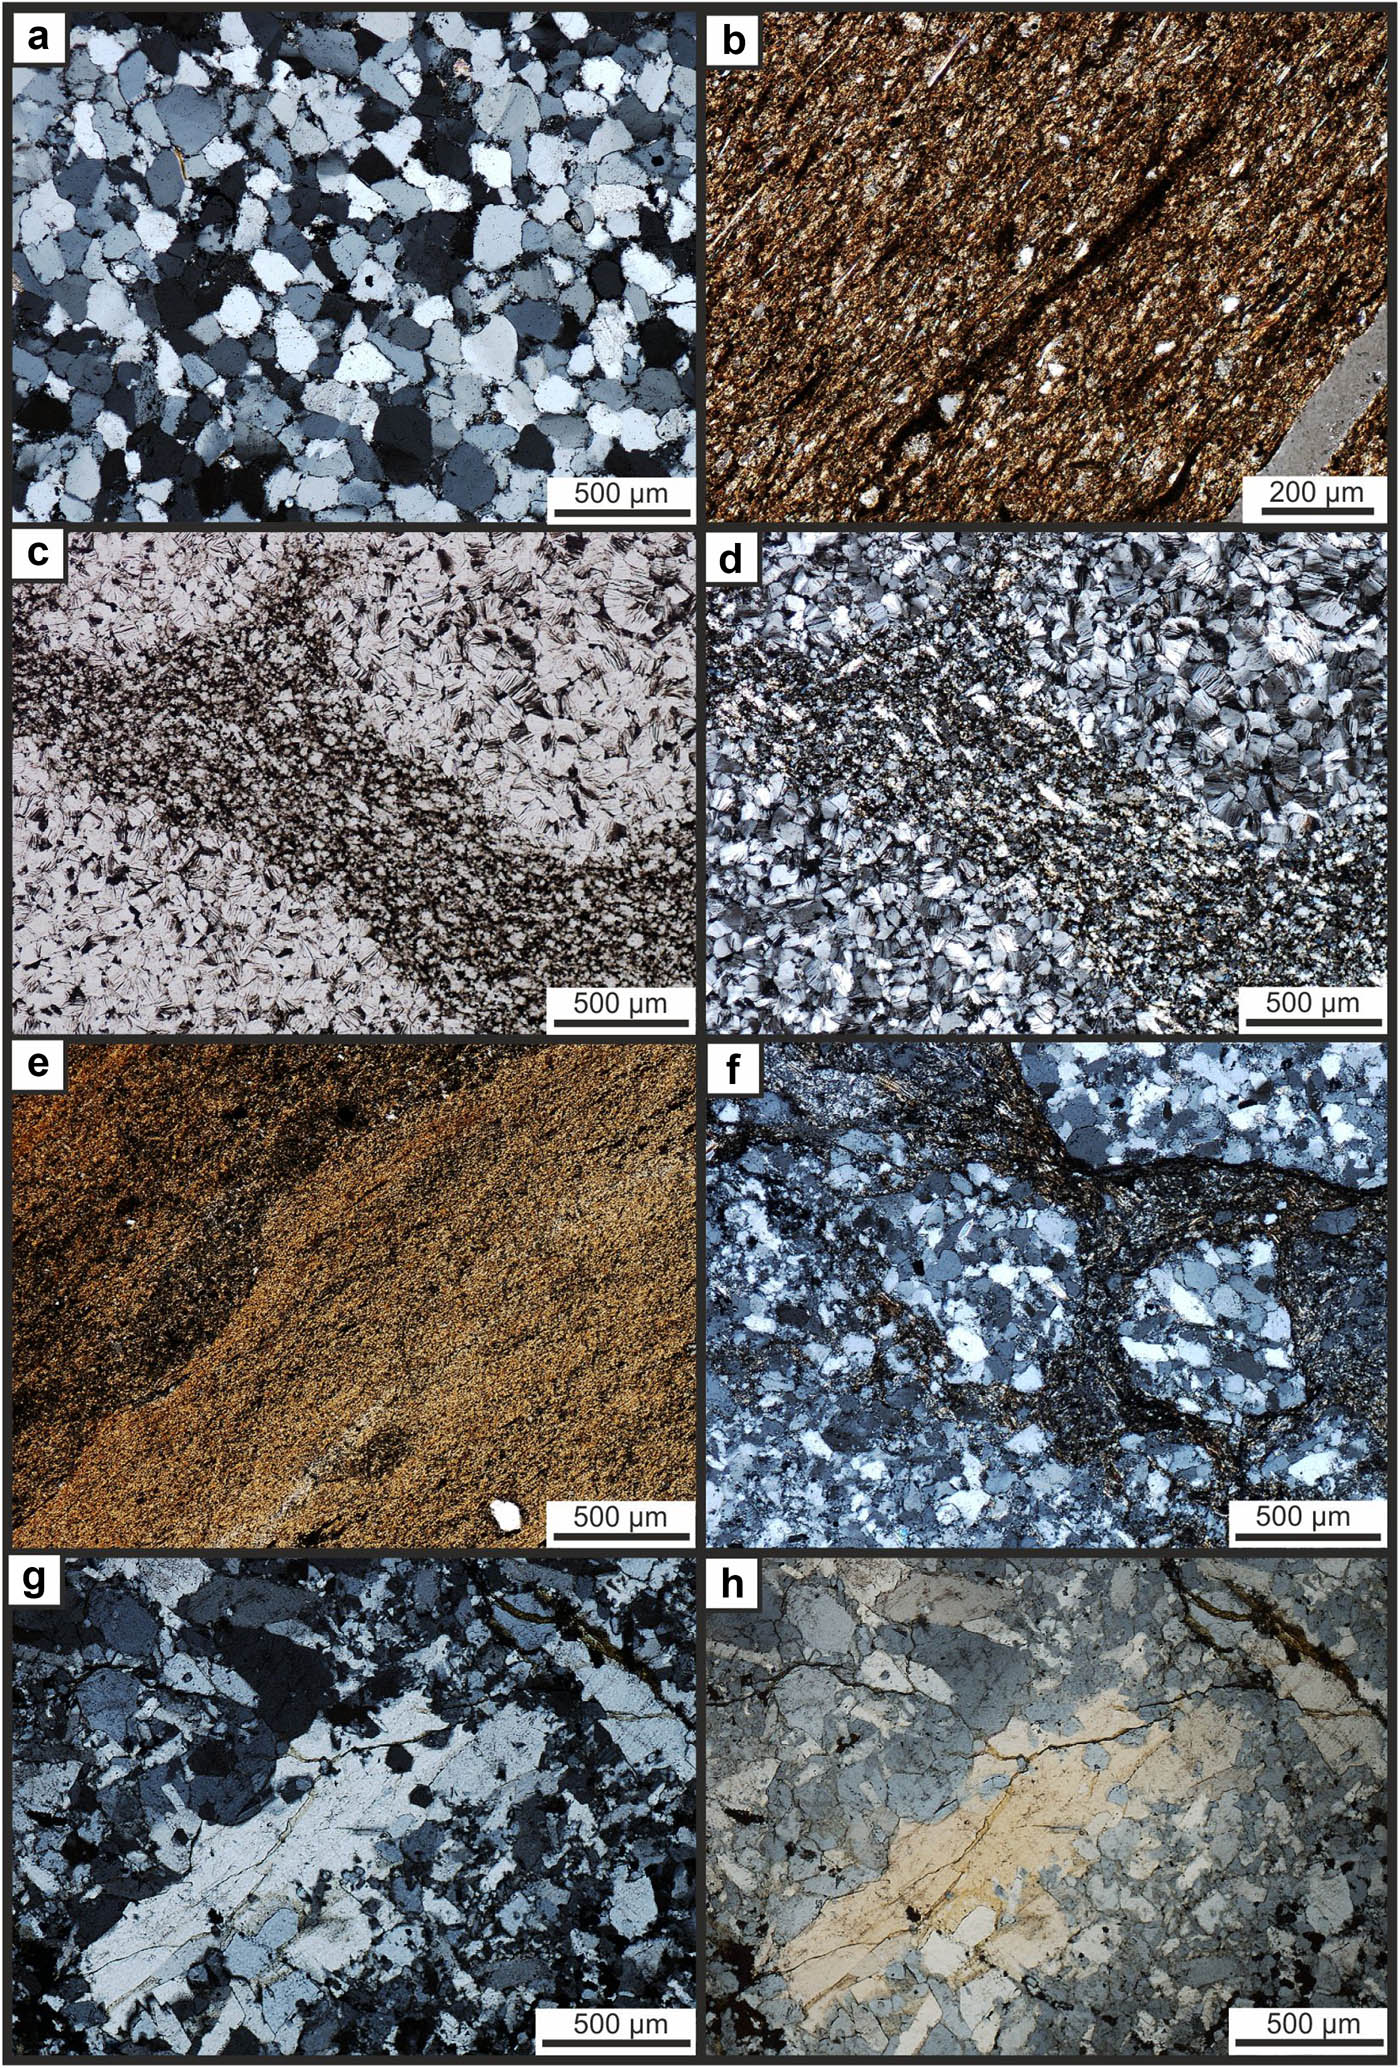
Figure 2
Optical polarized photomicrographs of characteristic rock types from the Podwiśniówka quarry in transmitted- and cross-polarized light (a–e, g) and reflected- and cross-polarized light (f, h): (a) quartzite composed of interlocked quartz grains (sample I-22), (b) clayey-silty shale made of muscovite-illite (sample borehole Pw3), (c, d) composite clay mineral aggregation composed of nacrite (dickite?) fragments cemented by muscovite-illite (sample I-25), (e) hydrothermal bentonite consisted of illite-smectite (sample Pw40), (f) a fragment of sedimentary breccia composed of pieces of quartzite cemented by clay minerals (sample Pw11B), (g, h) metaquartzite made of interlocked quartz blasts (sample V-12).
Results of chemical analysis of bulk samples are reported in Table 1. The mean concentrations of niobium and tantalum are 11.6 mg/kg and 0.752 mg/kg, which are roughly similar to the upper continental crust being 12 and 0.9 mg/kg, respectively (Rudnick & Gao, 2014). Dark gray and black carbonaceous clayey-silty shales show distinct enrichments of niobium and tantalum, varying from 16.16 to 28.99 mg/kg and from 1.06 to 1.84 mg/kg with a mean of 22.14 and 1.44 mg/kg, respectively. For comparison, niobium concentrations in bentonite clays of the Balikesir Region, Western Anatolia (Turkey) vary from 14.2 to 22.9 mg/kg (Kadİr et al., 2019) whereas those of the Troodos Ophiolite Complex (Cyprus) from 10.3 to 24.9 mg/kg (Christidis, 2006). In contrast, the other types of quartzites/quartzitic sandstones reveal far lower concentrations of these two metals: 0.10–2.63 mg/kg (Nb) and <0.01–0.12 mg/kg (Ta). Pyrite exhibits minor contents of Nb (0.38–3.45 mg/kg) and Ta (<0.01–0.22 mg/kg). Tuffites/bentonites and sediments show, in turn, intermediate Nb and Ta concentrations, i.e., 4.78–19.95 mg/kg (Nb) and 0.20–1.29 mg/kg (Ta).
Table 1
Major and trace element concentrations and Nb/Ta ratios in rocks, pyrite and pond sediments of Podwiśniówka quarry (samples 1–22) and pond sediments of Wiśniówka Mała acid pit lake (samples 23–24)
| No. | Sample description | Al2O3 | Fe2O3 | K2O | TiO2 | Cr | Nb | Rb | Ta | V | Zr | ∑REE | Nb/Ta |
|---|---|---|---|---|---|---|---|---|---|---|---|---|---|
| % | mg/kg (ppm) | ||||||||||||
| 1. | Tuffite/bentonite | 9.56 | 0.36 | 1.50 | 0.723 | 61 | 8.62 | 47.1 | 0.63 | 57 | 172.8 | 188.93 | 13.7 |
| 2. | Tuffite/bentonite | 23.77 | 0.98 | 5.27 | 1.208 | 120 | 18.10 | 160.7 | 1.29 | 133 | 181.4 | 332.85 | 14.0 |
| 3. | Silty-clayey shale, brown | 13.79 | 30.50 | 2.88 | 0.740 | 133 | 7.52 | 63.1 | 0.54 | 105 | 188.5 | 250.54 | 13.9 |
| 4. | Clayey-silty shale, dark gray | 24.48 | 2.77 | 6.25 | 1.940 | 156 | 24.12 | 158.1 | 1.59 | 179 | 294.7 | 454.66 | 15.2 |
| 5. | Quartzite, gray | 1.69 | 0.50 | 0.33 | 0.217 | 31 | 1.02 | 7.8 | <0.01 | 11 | 57.8 | 255.52 | — |
| 6. | Clayey-silty shale, black | 19.50 | 1.26 | 4.26 | 1.178 | 118 | 16.16 | 129.2 | 1.06 | 121 | 180.1 | 320.44 | 15.2 |
| 7. | Clayey-silty shale, black | 14.88 | 8.94 | 3.18 | 0.932 | 126 | 17.06 | 118.2 | 1.16 | 91 | 267.1 | 313.20 | 14.7 |
| 8. | Clayey-silty shale, black | 18.58 | 1.57 | 4.53 | 1.275 | 136 | 20.12 | 184.2 | 1.25 | 134 | 278.2 | 455.09 | 16.1 |
| 9. | Clayey-silty shale, black | 21.84 | 2.05 | 5.29 | 1.477 | 245 | 28.99 | 202.5 | 1.84 | 173 | 326.7 | 392.44 | 15.8 |
| 10. | Pyritiferous quartzite, gray | 1.74 | 2.32 | 0.30 | 0.198 | 41 | 1.62 | 8.7 | 0.09 | 16 | 53.0 | 349.08 | 18.0 |
| 11. | Clayey-silty shale, black | 26.17 | 2.23 | 5.83 | 1.690 | 160 | 23.95 | 237.0 | 1.62 | 173 | 330.2 | 336.86 | 14.8 |
| 12. | Clayey-silty shale, black | 31.24 | 1.80 | 6.73 | 1.370 | 159 | 22.97 | 190.4 | 1.47 | 174 | 191.1 | 77.49 | 15.6 |
| 13. | Clayey-silty shale, black | 25.18 | 0.99 | 5.31 | 1.298 | 125 | 23.72 | 168.9 | 1.49 | 137 | 236.8 | 80.25 | 15.9 |
| 14. | Quartzite, gray | 3.17 | 0.67 | 0.80 | 0.235 | 32 | 2.63 | 22.5 | 0.12 | 23 | 52.7 | 95.89 | 21.9 |
| 15. | Ferruginous quartzite, brown | 1.11 | 7.74 | 0.17 | 0.313 | 58 | 1.61 | 4.8 | 0.10 | 20 | 70.4 | 112.86 | 16.1 |
| 16. | Metaquartzite, white | 0.22 | 0.12 | 0.06 | <0.010 | 34 | 0.10 | 0.6 | <0.01 | 6 | 1.8 | 2.81 | — |
| 17. | Pyrite A (with quartz) | 0.85 | 5.14 | 0.08 | 0.066 | 59 | 0.38 | 2.3 | <0.01 | 8 | 26.6 | 22.04 | — |
| 18. | Pyrite B (with quartz) | 0.12 | 16.78 | 0.01 | 0.138 | 36 | 1.03 | 1.8 | 0.07 | <5 | 60.6 | 50.82 | 14.7 |
| 19. | Pyrite C (with quartz) | 4.13 | 15.77 | 0.71 | 0.270 | 113 | 3.45 | 25.1 | 0.22 | 32 | 85.7 | 90.65 | 15.7 |
| 20. | Pyrite D (with quartz) | 0.99 | 12.66 | 0.13 | 0.112 | 49 | 1.04 | 5.0 | 0.07 | 10 | 45.2 | 40.2 | 14.9 |
| 21. | Pond sediment 1/Pw (west) | 17.61 | 6.26 | 4.19 | 1.079 | 180 | 19.05 | 158.4 | 1.20 | 144 | 216.1 | 329.57 | 15.9 |
| 22. | Pond sediment 2/Pw (east) | 6.79 | 1.57 | 1.34 | 0.369 | 33 | 4.78 | 49.3 | 0.20 | 34 | 127.1 | 98.29 | 23.9 |
| 23. | Pond sediment 1/WM (west) | 14.42 | 2.08 | 2.89 | 0.973 | 101 | 13.28 | 103.6 | 0.83 | 89 | 190.8 | 308.22 | 16.0 |
| 24. | Pond sediment 2/WM (east) | 18.65 | 2.26 | 3.74 | 1.153 | 128 | 17.91 | 128.6 | 1.19 | 121 | 203.8 | 373.21 | 15.0 |
| Mean concentration | 12.52 | 5.30 | 2.74 | 0.824 | 101 | 11.6 | 90.7 | 0.752 | 87 | 160.0 | 222.16 | 16.0** | |
| Upper continental crust* | 15.4 | 5.04 | 2.80 | 0.64 | 92 | 12 | 84 | 0.9 | 97 | 193 | 148.14 | 13.3 | |
NOTE: * derived from Rudnick and Gao (2014), **15.0 for carbonaceous clayey-silty shales, tuffites/bentonites and pyrite.
This relationship is also highlighted when it comes to comparing determination coefficients (R 2) of niobium versus different elements presented in Figure 3. There is a strong correlation between niobium and tantalum (R 2 = 0.994), indicating their close geochemical affinity, hence the name “geochemical twins” (Green, 1995). The high determination coefficient is noted between the following pairs (R 2 values given in parentheses): Nb/Ta–Rb (0.95, 0.95), Nb/Ta–TiO2 (0.93, 0.94), Nb/Ta–V (0.94, 0.95), Nb/Ta–K2O (0.93 each), and Nb/Ta–Al2O3 (0.91, 0.92). There is also a weaker relationship between Nb or Ta and Zr (R 2 = 0.87, 0.88) and, to a lesser extent, between Nb/Ta and Cr (0.80, 0.80). No statistically significant correlations exist between the pairs: Nb–REEs (0.39), Ta–REEs (0.40), Nb–Fe2O3 (0.09), and Ta–Fe2O3 (0.08). Considering the diverse element concentrations and determination coefficients, the most promising Nb and Ta carriers are TiO2 polymorphs, including anatase, rutile, mixed rutile-anatase phases and subordinate brookite and mixed rutile-brookite, which have been evidenced by laser Raman microspectrometry/LRM (Migaszewski & Gałuszka, 2023; discussed in the Fingerprinting niobium and tantalum in minerals subsection).
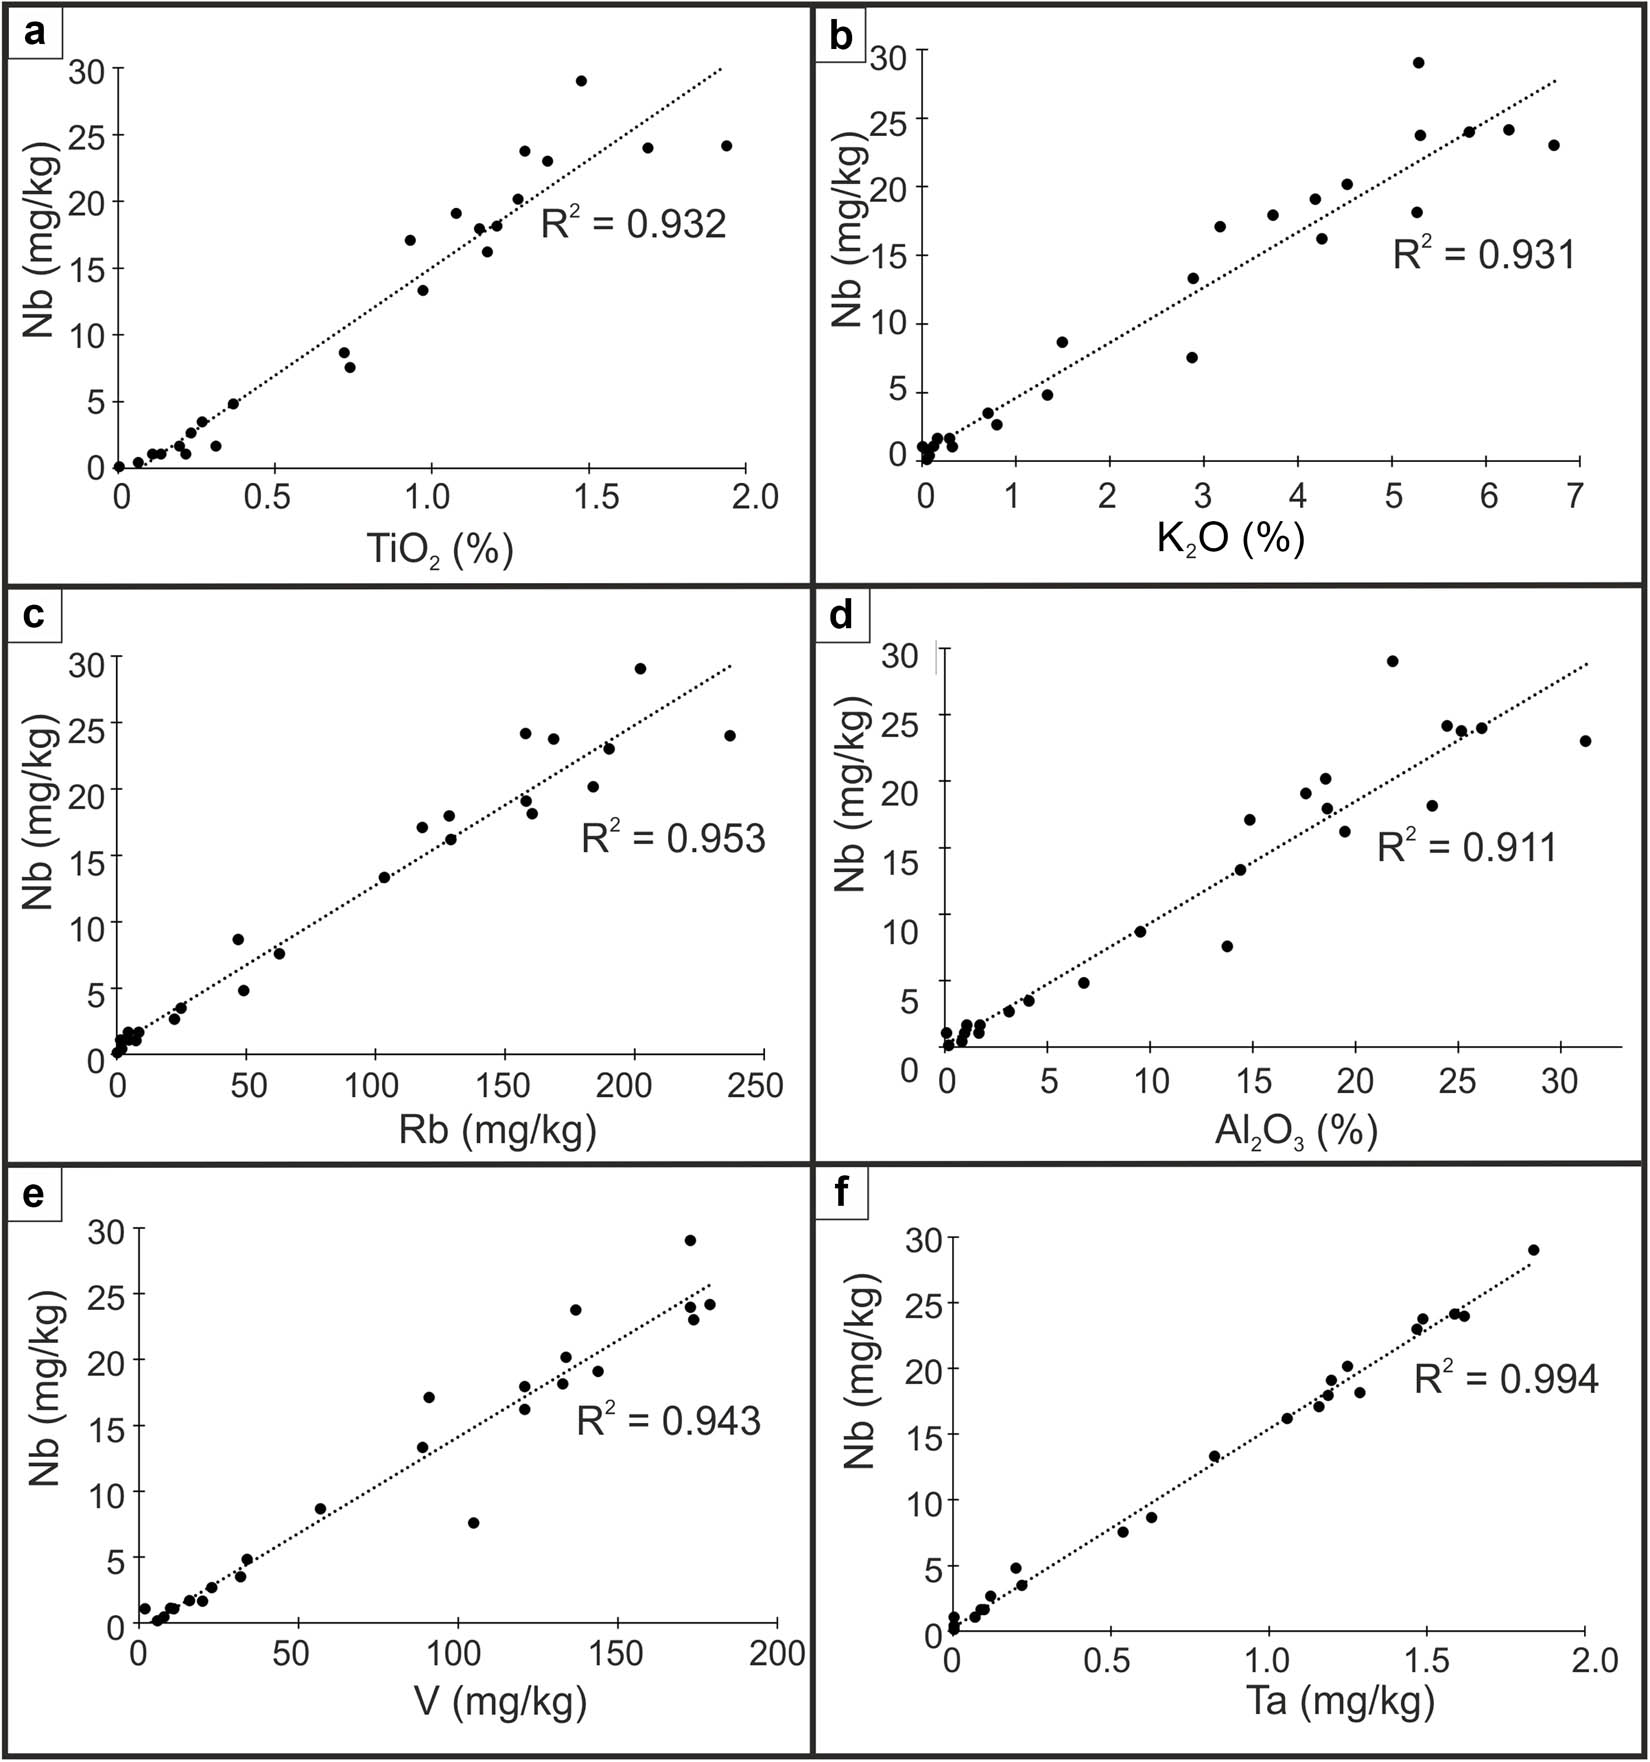
Figure 3
Selected determination coefficients (R 2) between the following element pairs: Nb–TiO2, Nb–K2O, Nb–Rb, Nb–Al2O3, Nb–V, and Nb–Ta in rocks, pyrite, and pond sediments of Podwiśniówka active quarry and pond sediments of Wiśniówka Mała historic acid pit lake (Table 1 for chemical analysis).
TiO2 phases, including skeleton-like polycrystalline anatase and rutile aggregates, are typically well confined inside the boundaries of the microvoid shapes, thus excluding their detrital provenance (Figure 4a, d–f). In some sedimentary quartzite breccias, TiO2 phases bind some quartz grains (Figure 5a in Migaszewski & Gałuszka, 2023). In addition, most of the outer surfaces of TiO2 outgrowths on zircon grains exhibit no rounded morphologies that preclude their transport along with other detrital minerals (Figure 4c). Somewhat rounded outer TiO2 polymorph boundaries are scarce and may have been formed as a result of early-diagenetic dissolution by hydrothermal fluids. TiO2 polymorphs are ubiquitous in the Wiśniówka geologic profile and occur in the form of individual accumulations or associations with pyrite, goethite α-Fe3+ O(OH), goyazite SrHAl3[(PO4)2(OH)6], low-temperature kaolinite (nacrite, dickite) Al4[Si4O10](OH)8, or occasionally with hydrothermal zircon (Figure 4a–c). These mineral phases were characterized in previous studies using SEM-EDS, EMPA, and XRD techniques (e.g., Migaszewski & Gałuszka, 2019, 2025).
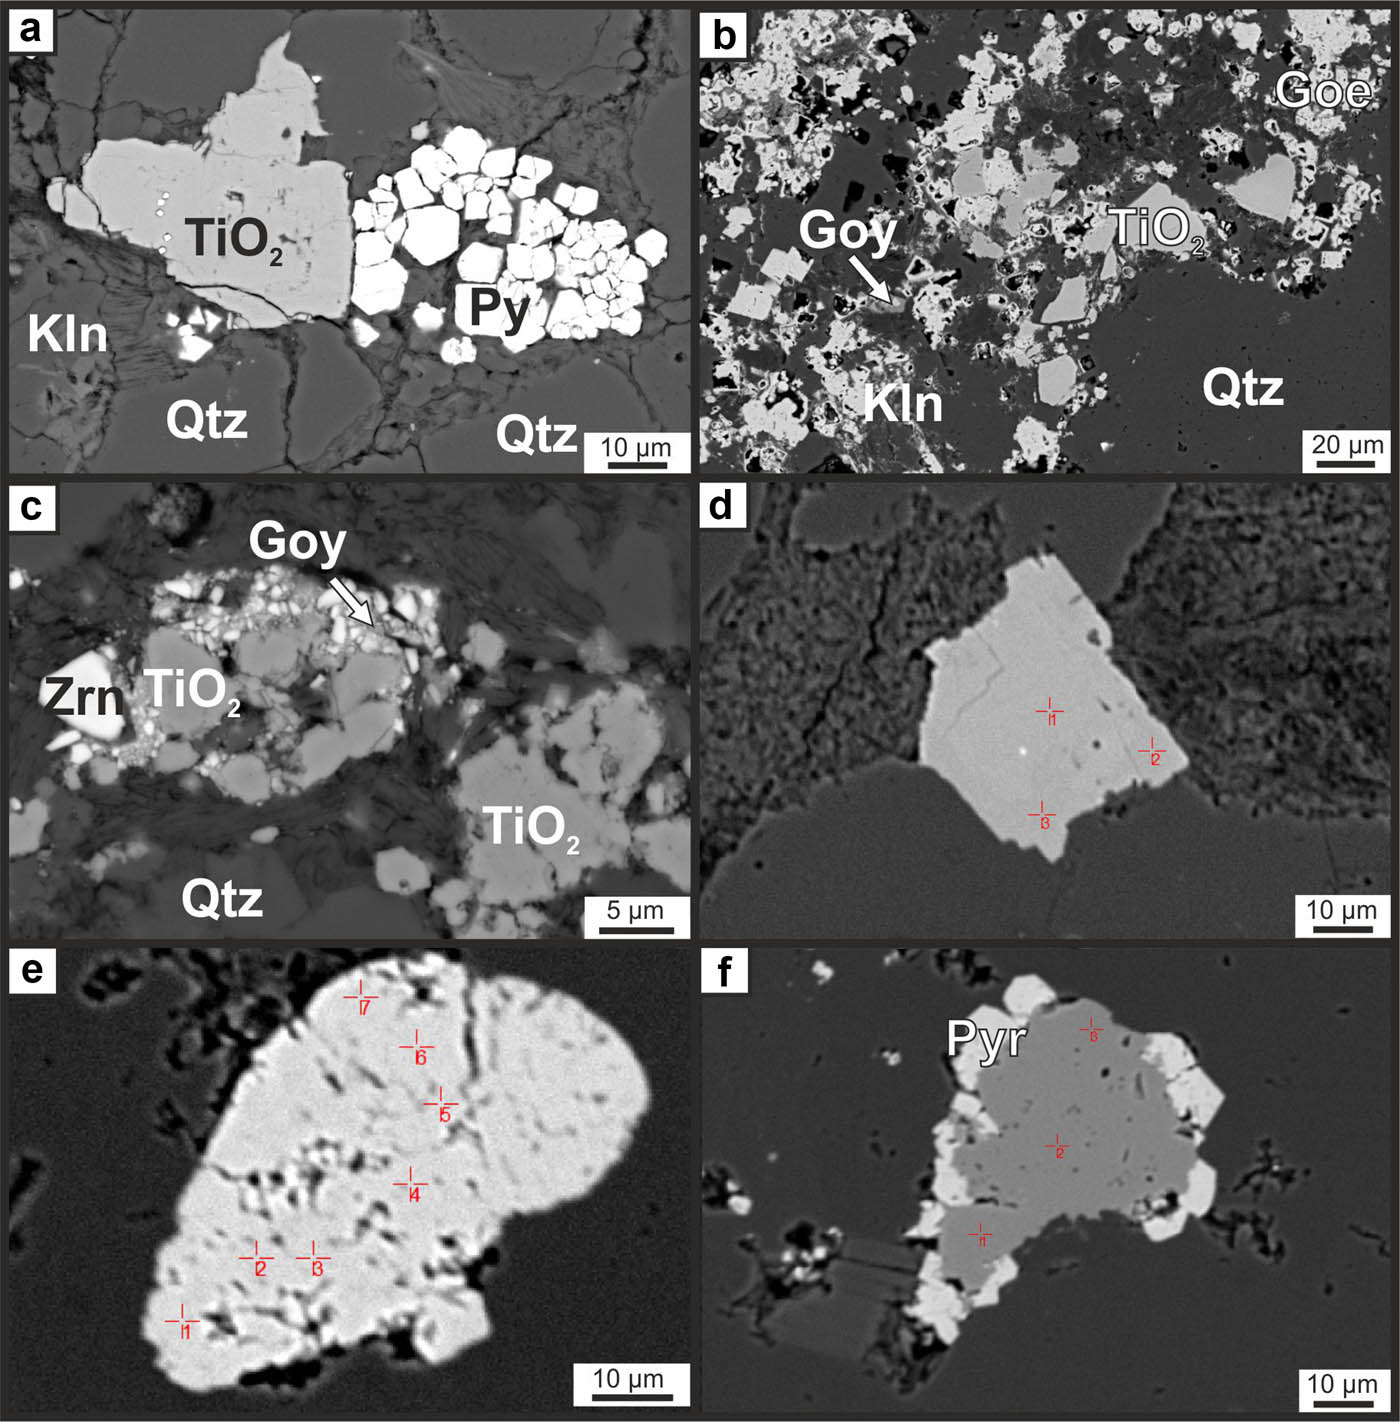
Figure 4
Back-scattered SEM photomicrographs: (a) TiO2 polymorph agglomeration with tiny pyrite inclusions (closely infilling a microvoid) associated with low-temperature kaolinite and pyrite aggregations (sample Pw38), (b) accumulation of TiO2 polymorphs, goethite, goyazite and kaolinite (sample Pw3), (c) TiO2 polymorph agglomeration with accumulations of goyazite and hydrothermal zircon (sample Pw3); Back-scattered EMP photomicrographs of TiO2 polymorphs with measuring points in samples: (d) Pw6 – rutile, (e) Pw-33 – anatase and (f) Pw39 – anatase-rutile (results derived from microanalysis of raster points are given in Table 3). Mineral abbreviations for Figure 4: Kln – kaolinite (nacrite, dickite?), Py – pyrite, Qtz – quartz, and Zrn – zircon.
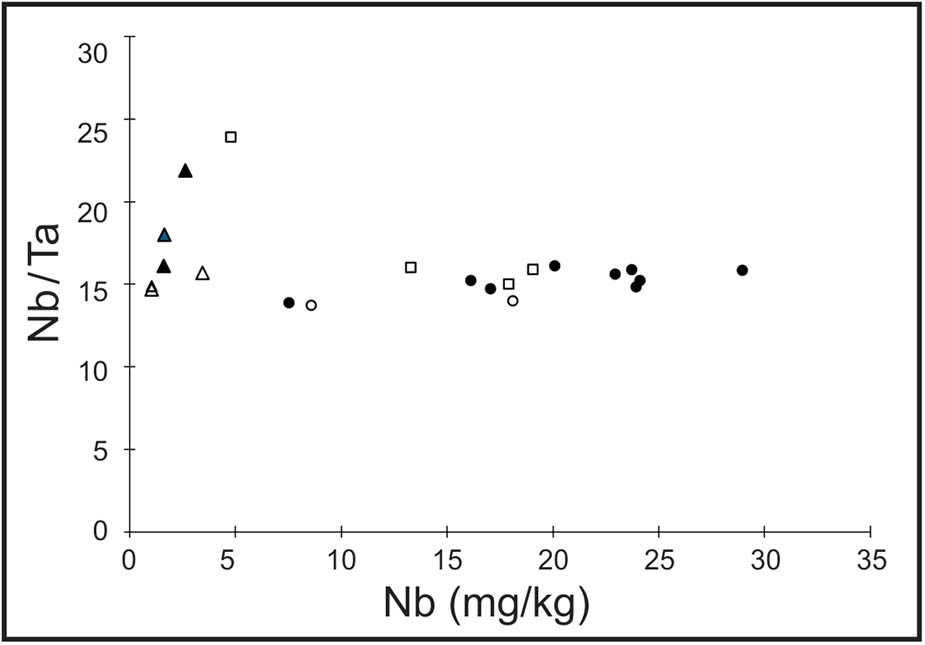
Figure 5
Variations of Nb/Ta ratio versus Nb concentrations in examined rocks, pyrite, and sediments. Note: ● organic-rich clayey-silty shale, ○ tuffite/bentonite, ∆ pyrite, ▲ quartzite/quartzitic sandstone, □ pond sediment.
Another potential scavenger of Nb and Ta is dark gray to black organic-rich clayey-silty shales. This is documented by high determination coefficients between Nb (or Ta) and Rb, K or Al. However, the adsorption behavior of niobium(V) on kaolinite and illite has not fully been elucidated (Ervanne et al., 2014; Yang et al., 2023). An experimental study indicated that kaolin clay and pure kaolinite may exhibit a high niobium adsorption capacity, which is in turn pH-dependent; adsorption decreases with a pH increase (Yang et al., 2023), as documented in some kaolin clay rocks of weathering crust-type deposits of China containing 200–600 mg/kg Nb (Wang et al., 2018). Besides, the high R 2 coefficient (0.94) of the Nb–V pair combined with the highest concentrations of these two metals in organic-rich shales (Table 1) indicates a close affinity of Nb with organic matter. Vanadium may be scavenged by dissolved organic matter in seawater, which is subsequently adsorbed by smectite and incorporated into illite through illitization of smectite (Lu et al., 2021).
3.2. Fingerprinting niobium and tantalum in minerals
As mentioned before, the determination coefficients derived from bulk chemical analysis show that the most important Nb–Ta carriers are TiO2 polymorphs and partly clay minerals. Table 2 presents the summary statistics (means and observed ranges, standard deviations) for Nb, Ta, Ce, Cr, Ti, and Zr in TiO2 polymorphs based on EMPA measurements. The mean and range contents of niobium are 0.18 wt% and <0.01 to 0.96 wt%, whereas those of tantalum are distinctly lower, amounting to 0.02 wt% and <0.01 to 0.07 wt%. The other elements exhibit the following contents (mean and range values given in parentheses): Ce (0.14; <0.01 to 0.27 wt%), Cr (0.04; <0.01 to 0.26 wt%) and Zr (0.09; <0.01 to 0.58 wt%). Interestingly, basic minerals of these elements, e.g., goyazite, gorceixite BaAl3H[(OH)6(PO4)2], xenotime Y[PO4], monazite Ce[PO4] for REEs, chromite Fe2+Cr2O4 for Cr, and zircon for Zr, contain only trace amounts of Nb and Ta, despite the fact that some of them exhibit relatively high R 2 values. For example, chromite is depleted in Nb (<0.01 wt%) and Ta (mostly <0.01 wt%, scarcely to 0.02 wt%), whereas REE-minerals completely lack Nb and Ta. These two metals are also strongly depleted in prevalent ore minerals, such as pyrite, goethite, and hematite Fe2O3, thus showing no geochemical affinity with Fe in the crystal structures of these three minerals. Iron (hydr-)oxides scarcely reach 0.05 wt% Nb.
Table 2
Contents of Ti, Nb, Ta, Ce, Cr, and Zr in TiO2 polymorphs of the Wiśniówka study area based on EMP measurements
| Element (N = 101) | Mean ± SD | Range |
|---|---|---|
| wt% | ||
| Ti | 58.7 ± 0.789 | 55.2–59.7 |
| Nb | 0.18 ± 0.16 | <0.01–0.96 |
| Ta | 0.02 ± 0.02 | <0.01–0.07 |
| Ce | 0.14± 0.06 | <0.01–0.27 |
| Cr | 0.04 ± 0.04 | <0.01–0.26 |
| Zr | 0.09 ± 0.10 | <0.01–0.58 |
NOTE: TiO2 polymorphs included anatase, rutile, mixed rutile-anatase and rutile-brookite phases, and brookite, which cannot be identified by optical and electron microscopy or EMP (discussed in Migaszewski & Gałuszka, 2023); V contents were below detection limits.
SEM-EDS and EMPA alone make it impossible to discriminate individual TiO2 phases, e.g., dominant anatase from rutile or mixed rutile-anatase based on morphological and microtextural properties without correlation with laser Raman microspectrometry. The previous study revealed a transition of different TiO2 phases even within single grains (Migaszewski & Gałuszka, 2023). For this reason, electron microprobe analyses were performed on TiO2 grains previously documented by LRM. Some TiO2 polymorphs have polysynthetic twin lamellae or patchy-zoned patterns that, according to Mader (1980), may be indicative of authigenic rutile. Variations in Ti, Nb, Ta, and additionally Ce, Cr, and Zr contents, and Nb/Ta and Nb/Zr ratios are best evidenced by measuring points on selected individual TiO2 polymorph grains (Figure 4d–f, Table 3). The most interesting is a grain of sample Pw33/03 showing the highest mean (0.22 wt%) and range (0.12–0.40 wt%) contents of niobium. Tantalum is, in turn, distinctly less abundant, exhibiting mean and range contents of 0.03 wt% and <0.01 to 0.04 wt%, respectively. The predominance of Nb over Ta in this sample is highlighted by the ratio of these two elements (Nb/Ta), which is 4.0–10.0. Another ratio Nb/Zr is in the range of 1.2–20.0. There is a much wider dispersion of the Nb/Ta ratios (1.3 to 11.3) in a TiO2 grain of sample Pw39/10.
Table 3
Contents of Ti, Nb, Ta, Ce, Cr, and Zr (wt%) in TiO2 polymorph phases in selected samples based on EMPA measurements
| Sample | Ti | Nb | Ta | Ce | Cr | Zr | Nb/Ta | Nb/Zr |
|---|---|---|---|---|---|---|---|---|
| Pw6/06 Rutile | 58.80 | 0.29 | 0.03 | 0.20 | 0.09 | <0.01 | 9.7 | — |
| 58.86 | 0.13 | <0.01 | 0.08 | 0.02 | 0.14 | — | 0.9 | |
| 58.81 | 0.13 | 0.01 | 0.15 | 0.02 | 0.12 | 13.0 | 1.1 | |
| Pw33/03 Anatase | 57.92 | 0.40 | 0.04 | 0.08 | 0.03 | 0.02 | 10.0 | 20.0 |
| 57.22 | 0.18 | 0.04 | 0.14 | 0.03 | 0.08 | 4.5 | 2.2 | |
| 59.13 | 0.12 | <0.01 | 0.15 | 0.04 | 0.03 | — | 4.0 | |
| 58.80 | 0.21 | 0.04 | 0.16 | 0.01 | 0.18 | 5.2 | 1.2 | |
| 56.99 | 0.18 | 0.04 | 0.11 | <0.01 | 0.07 | 4.5 | 2.6 | |
| 59.02 | 0.16 | 0.04 | 0.20 | 0.01 | 0.07 | 4.0 | 2.3 | |
| 58.38 | 0.27 | 0.04 | 0.12 | 0.02 | 0.10 | 6.8 | 2.7 | |
| Pw39/10 Anatase-rutile | 58.19 | 0.34 | 0.03 | 0.19 | 0.03 | 0.08 | 11.3 | 4.2 |
| 59.27 | 0.04 | 0.03 | 0.12 | <0.01 | <0.01 | 1.3 | — | |
| 58.55 | 0.20 | <0.01 | 0.17 | <0.01 | <0.01 | — | — |
NOTE: Measuring points are given in Figure 4; V contents were below detection limits.
The Nb and Ta contents and the Nb/Ta ratio for all measured TiO2 grains are presented in Table 4. This ratio reveals a significant scatter in the range of 0.5–48, with a mean of 7.6 (n = 74). The distinct variations may point to the influence of both host rocks and fluids on the geochemistry of hydrothermal TiO2 polymorphs (Schirra & Laurent, 2021), or, in a broader sense, to fluid- or crystal-related fractionation processes (Green, 1995). In contrast, bulk samples, which are analyzed by a more sensitive ICP-MS technique, are characterized by a smaller spread in the Nb/Ta ratio, varying from 13.7 to 23.9, with a mean of 16.0 (n = 21) being higher than that for upper continental crust, which is 13.3 (Rudnick & Gao, 2014), but lower than that for the Earth’s mantle (∼17.5; Sun & McDonough, 1989). Variations of Nb/Ta ratio with Nb concentrations in Wiśniówka pyrite, quartzites/quartzitic sandstones and sediments are depicted in Figure 5. Data are restricted to >0.10 mg/kg Nb and >0.01 mg/kg Ta to eliminate analytical uncertainty at low concentration levels. Interestingly, organic-rich clayey-silty shales, tuffites/bentonites, and pyrite show a narrow spread of points with Nb/Ta ratios falling between 13.7 and 16.1 (mean of ∼15.0) for Nb contents varying from 1.0 to 29.0 mg/kg. This may suggest lower fractionation of niobium and tantalum in hydrothermally affected sediments. The Nb/Ta values are close to those of silicic rocks of the Torfajiikull volcanic complex, Iceland (Macdonald et al., 1990). Some quartzites/quartzitic sandstones and sediments reveal distinct excursions of Nb/Ta ratios into 21.9 and 23.9, respectively, which may indicate greater heterogeneity of petrographic material, especially sediments.
Table 4
Nb and Ta contents and Nb/Ta ratios in TiO2 polymorph types of individual samples based on EMPA measurements
| Sample | Nb | Ta | Nb/Ta | Sample | Nb | Ta | Nb/Ta |
|---|---|---|---|---|---|---|---|
| Pw6 | 0.02 | 0.03 | 0.7 | Pw34 | 0.06 | 0.03 | 2.0 |
| 0.34 | 0.02 | 17.0 | 0.10 | 0.03 | 3.3 | ||
| 0.29 | 0.03 | 9.7 | 0.19 | 0.02 | 9.5 | ||
| 0.13 | 0.01 | 13.0 | 0.18 | 0.04 | 4.5 | ||
| 0.29 | 0.02 | 14.5 | 0.14 | 0.03 | 4.7 | ||
| 0.17 | 0.02 | 8.5 | 0.96 | 0.02 | 48.0 | ||
| 0.22 | 0.03 | 7.3 | 0.11 | 0.02 | 5.5 | ||
| 0.28 | 0.02 | 14.0 | 0.69 | 0.02 | 34.5 | ||
| 0.51 | 0.03 | 17.0 | 0.25 | 0.02 | 12.5 | ||
| 0.28 | 0.02 | 14.0 | 0.27 | 0.02 | 13.5 | ||
| Pw10 | 0.04 | 0.04 | 1.0 | 0.18 | 0.05 | 3.6 | |
| 0.09 | 0.02 | 4.5 | 0.18 | 0.03 | 6.0 | ||
| 0.11 | 0.04 | 2.8 | Pw39 | 0.07 | 0.04 | 1.8 | |
| 0.10 | 0.04 | 2.5 | 0.14 | 0.02 | 7.0 | ||
| 0.08 | 0.03 | 2.7 | 0.14 | 0.02 | 7.0 | ||
| 0.14 | 0.01 | 14.0 | 0.28 | 0.02 | 14.0 | ||
| 0.08 | 0.02 | 4.0 | 0.41 | 0.03 | 13.7 | ||
| 0.11 | 0.02 | 5.5 | 0.44 | 0.07 | 6.3 | ||
| 0.11 | 0.02 | 5.5 | 0.65 | 0.05 | 13.0 | ||
| 0.09 | 0.04 | 2.2 | 0.09 | 0.05 | 1.8 | ||
| 0.01 | 0.01 | 1.0 | 0.12 | 0.05 | 2.4 | ||
| 0.08 | 0.03 | 2.7 | 0.34 | 0.03 | 11.3 | ||
| Pw33 | 0.10 | 0.04 | 2.5 | 0.04 | 0.03 | 1.3 | |
| 0.06 | 0.02 | 3.0 | 0.26 | 0.02 | 13.0 | ||
| 0.06 | 0.01 | 6.0 | 0.04 | 0.04 | 1.0 | ||
| 0.11 | 0.02 | 5.5 | Pw3/81.1-81.2 | 0.22 | 0.02 | 11.0 | |
| 0.10 | 0.04 | 2.5 | 0.17 | 0.04 | 4.2 | ||
| 0.08 | 0.05 | 1.6 | 0.19 | 0.02 | 9.5 | ||
| 0.08 | 0.01 | 8.0 | 0.38 | 0.05 | 7.6 | ||
| 0.06 | 0.02 | 3.0 | 0.37 | 0.04 | 9.2 | ||
| 0.08 | 0.03 | 2.7 | 0.07 | 0.02 | 3.5 | ||
| 0.08 | 0.04 | 2.0 | 0.05 | 0.04 | 1.2 | ||
| 0.04 | 0.02 | 2.0 | 0.01 | 0.02 | 0.5 | ||
| 0.08 | 0.05 | 1.6 | 0.64 | 0.02 | 32.0 | ||
| 0.40 | 0.04 | 10.0 | |||||
| 0.18 | 0.04 | 4.5 | |||||
| 0.21 | 0.04 | 5.2 | |||||
| 0.18 | 0.04 | 4.5 | |||||
| 0.16 | 0.04 | 4.0 | |||||
| 0.27 | 0.04 | 6.8 |
NOTE: Nb and Ta contents <0.01 wt% are excluded.
3.3. Niobium and tantalum as hydrothermal indicators
The Wiśniówka Late Cambrian sedimentary basin was not conducive to the formation of typical magmatic-hydrothermal or metamorphic Nb/Ta-rich minerals, including columbite-tantalite or pyrochlore. Other studies have also shown that both niobium and tantalum are preferentially incorporated in columbite-(Fe) through columbite-(Mn) to tantalite-(Mn) and microlite (Shi et al., 2024) or titanite and ilmenite (Zhu et al., 2025) that have been found in magmatic-hydrothermal and metamorphic systems. In the study area, the principal Nb- and Ta-carriers are TiO2 polymorphs and partly clay minerals; there is a lack of other titaniferous oxide minerals, e.g., titanite CaTiO[SiO4], ilmenite Fe2+ TiO3, titanomagnetite Fe2+ (Fe3+,Ti)2O4 or titanohematite (Fe,Ti)2O3, which have been recorded in other areas, for example, in Upper Proterozoic sandstones of the Visingsö Group in southern Sweden (Morad, 1986) or more recently in the Lushui area, southwestern Yunnan, China (Si et al., 2026). Moreover, both quartzites, quartzitic sandstones and clayey-silty shales do not contain biotite, pyroxene and amphiboles, thus excluding the breakdown of these minerals as a potential source for TiO2 phases (Luvizotto et al., 2009; Schirra & Laurent, 2021).
The occurrence of TiO2 polymorphs in REE-goethite-kaolinite-zircon-rich “veinlets” points to their hydrothermal origin (Figure 4b, c). Although niobium and tantalum are not economically important in the study area, their presence in the TiO2 crystal structures makes it possible to reconstruct the physicochemical conditions for the formation of these minerals. Previous studies have indicated that the Wiśniówka area is represented by siliciclastic-volcanogenic rock formations revealing a lack of significant metamorphic signatures except for subordinate white metaquartzites (Migaszewski & Gałuszka, 2019, 2023). The presence of niobium and tantalum in clay minerals may also suggest a larger influence of hydrothermal fluids on the mineralogy and geochemistry of local sediments. In addition, a considerable spread of the Nb/Ta ratio in TiO2 phases, even within individual grains (Tables 3, 4), may point to fractionation of both metals from crystallization of predominant anatase and subsequently its conversion into mixed rutile-anatase phases and rutile. This is also the reason why it is not possible to determine the exact crystallization temperature based on the Zr-in-rutile geothermometer (Zack et al., 2004b).
Although TiO2 polymorphs and associated minerals are represented by several, locally overlapping generations, it is possible to distinguish two main mineralization phases represented by (i) pyrite and TiO2 types (primarily anatase) with subordinate nacrite/dickite and REE-rich minerals, and (ii) goethite/hematite, TiO2 types (mostly rutile), aluminum-phosphate-sulfate/APS group (mainly goyazite), xenotime and nacrite/dickite, pointing to changes from reducing into oxidizing conditions within the Wiśniówka Late Cambrian depositional basin (Migaszewski & Gałuszka, 2023).
4. Conclusions
Results of this study indicate that the principal carriers of niobium and titanium are TiO2 polymorphs, and partly organic-rich clayey-silty shales, as evidenced by high determination coefficients between the Nb–Ta pair and Al2O3, K2O, Rb, or V. Ubiquitous pyrite, goethite, and hematite practically lack niobium and tantalum. Similarly, goyazite, gorceixite, xenotime, zircon, and minute chromite can be negligible as Nb–Ta carriers. The incorporation of these two refractory elements for Ti in the crystal structure of TiO2 phases confirms their hydrothermal origin in the Wiśniówka Late Cambrian sedimentary basin. The origin of hydrothermal Nb–Ta abundant TiO2 polymorphs in the absence of primary source minerals for Ti remains enigmatic and warrants further study.
Acknowledgements
We wish to thank Dr. Grzegorz Zieliński and Mr. Leszek Giro of the Polish Geological Institute – National Research Institute for performing microanalysis and taking EMPA and SEM photomicrographs. This study was supported by the Jan Kochanowski University in Kielce, Poland (a research grant # SUPB.RN.25.211).
Author contributions
Conceptualization, methodology, investigation, and writing – original draft, data curation, project administration (Z.M.M.). Investigation, writing – review & editing, visualization, and validation (A.G.). Methodology, investigation, and writing – review & editing, visualization (A.M.).
Conflicts of interest statement
The authors declare no conflict of interest or personal relationships that could have appeared to influence the work reported in this paper.
Data availability statement
The data supporting the findings of this study are available within the article.