
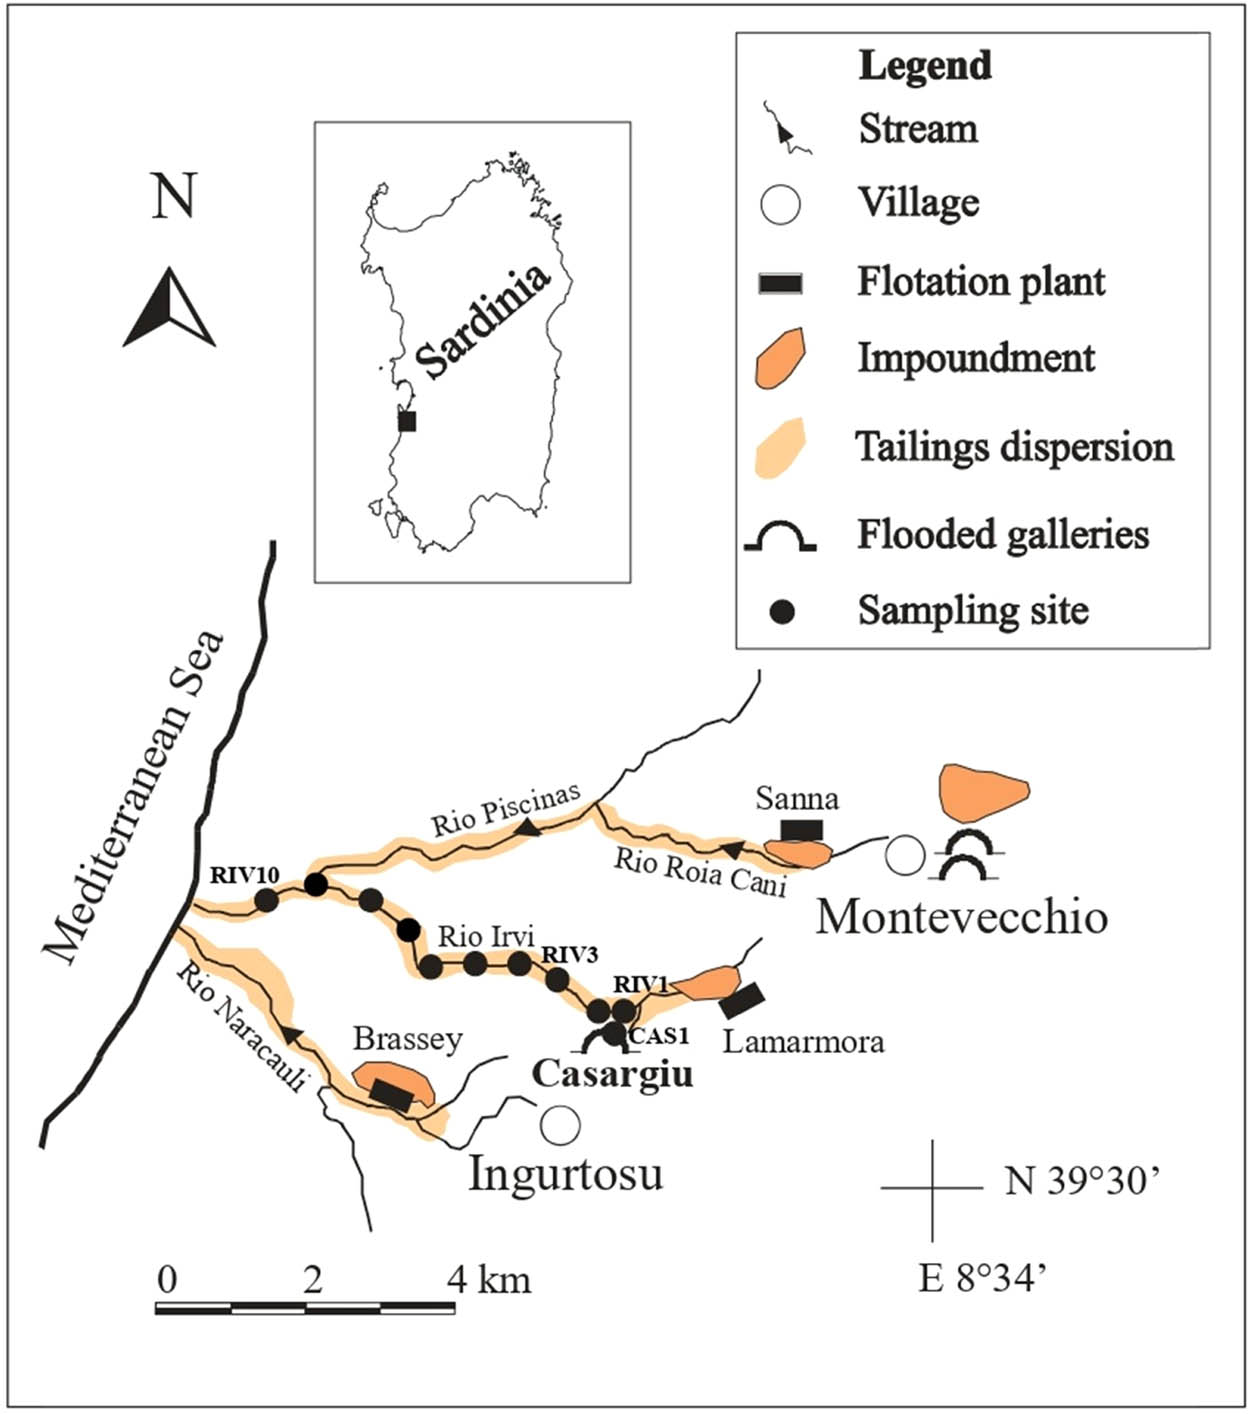
Figure 1
Schematic map of the Arburese mining district (black square in the inset with Sardinia) showing the location of the Casargiu mine, the sampling site CAS1 at the water outlet from the Casargiu mining gallery, the sampling sites from RIV1 to RIV9 along the Rio Irvi, and the RIV10 sampling site after the confluence of Rio Irvi with Rio Piscinas. The latter was completely dry during the sampling period.
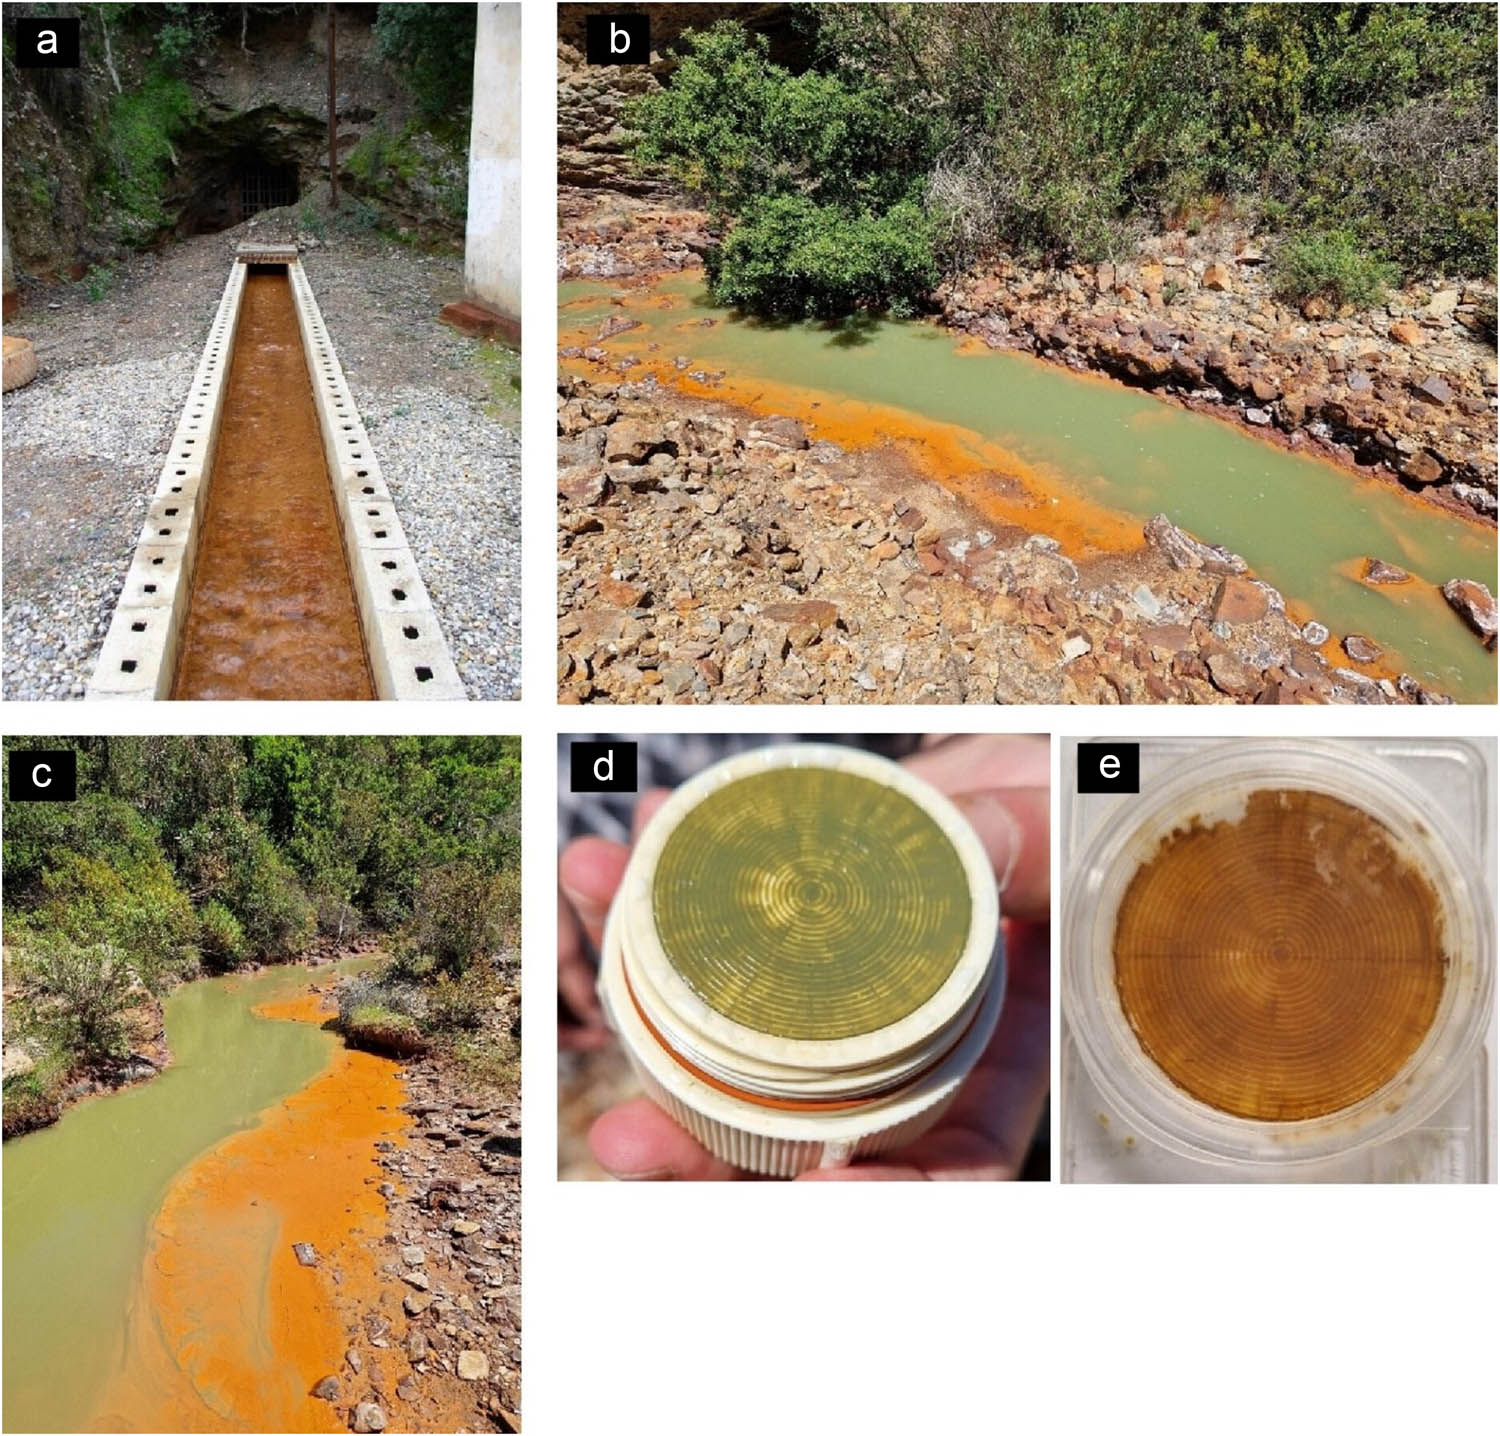
Figure 2
(a) Water outlet from the Casargiu mining gallery (CAS1); (b and c) the RIV3 sampling site in the Rio Irvi where “green rust” formation is evident; (d) “Green rust” on 0.45-µm filter collected filtering water from the Rio Irvi at the RIV3 sampling site; (e) same filter as d after 24 h where the colour change is due to oxidation of Fe(II), present in the composition of the “green rust”, to Fe(II).
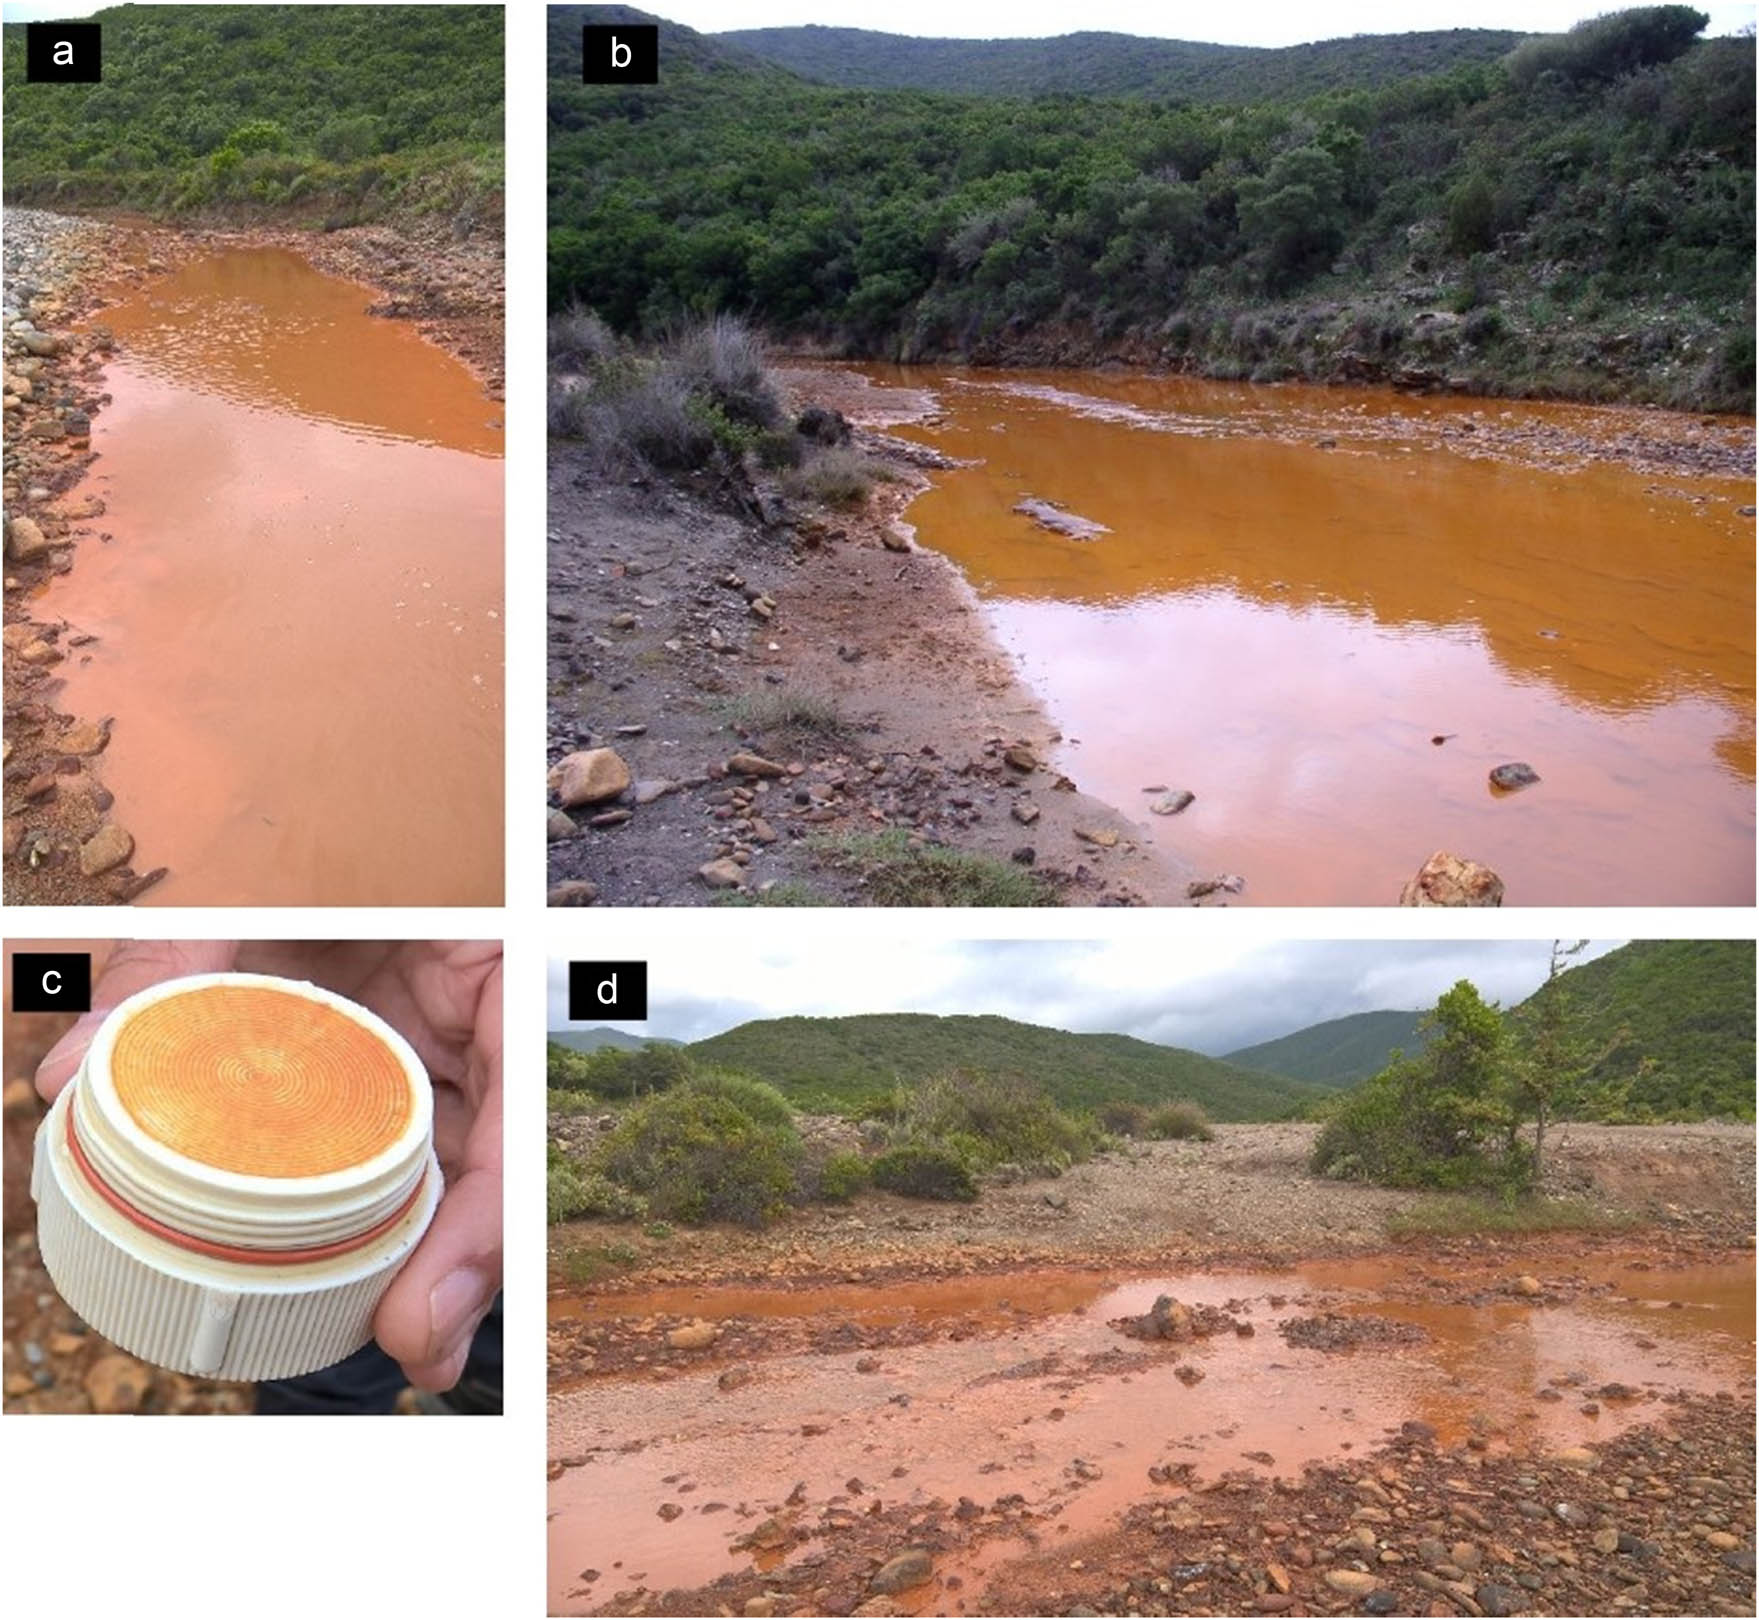
Figure 3
(a, b and d) The RIV10 sampling site in the Rio Irvi where precipitation of Fe(III)-hydroxides (HFO) is evident; (c) HFO collected on 0.45-µm filter filtering water from the Rio Irvi at the RIV10 sampling site.
Table 1
Chemical composition of Rio Irvi at the two sampling points RIV3 and RIV10
| Old name | CAS4 | CAS9 | |
|---|---|---|---|
| New name | RIV3 | RIV10 | |
| Flow | L/s | 55 | 58 |
| T | °C | 24.3 | 28.7 |
| Eh | mV | 183 | 498 |
| pH | 6.29 | 3.89 | |
| Cond | mS/cm | 4.11 | 4.19 |
| O2 | mg/L | 7.23 | 7.36 |
| TDS | g/L | 5.43 | 5.27 |
| Ca | mg/L | 390 | 370 |
| Mg | mg/L | 252 | 246 |
| Na | mg/L | 78 | 93 |
| K | mg/L | 15 | 18 |
| Cl | mg/L | 87 | 132 |
| Alk | mg/L | 65 | |
| SO4 | mg/L | 3,525 | 3,450 |
| SiO2 | mg/L | 17.5 | 19.2 |
| Fe | mg/L | 152 | 108 |
| Mn | mg/L | 70 | 68 |
| Zn | mg/L | 775 | 770 |
| Cd | µg/L | 2,110 | 1,940 |
| Pb | µg/L | 140 | 660 |
| Ni | µg/L | 2,480 | 2,320 |
| Sb | µg/L | 0.37 | 0.21 |
| Co | µg/L | 1,480 | 1,375 |
| Ca | meq/L | 19.46 | 18.46 |
| Mg | meq/L | 20.72 | 20.23 |
| Na | meq/L | 3.39 | 4.04 |
| K | meq/L | 0.38 | 0.46 |
| Cl | meq/L | 2.45 | 3.72 |
| Alk | meq/L | 1.07 | 0.00 |
| SO4 | meq/L | 73.44 | 71.88 |
| Fe | meq/L | 5.44 | 3.87 |
| Mn | meq/L | 2.55 | 2.48 |
| Zn | meq/L | 23.71 | 23.56 |
| Σcat | meq/L | 75.67 | 73.10 |
| Σan | meq/L | 76.96 | 75.60 |
| Δ | −0.02 | −0.03 |
Milliequivalents per litre of Fe were calculated considering it as Fe2+. Δ is the charge balance error calculated as (Σcat – Σan)/(0.5 · (Σcat + Σan)). TDS means Total Dissolved Solids. Alk is the alkalinity expressed as .
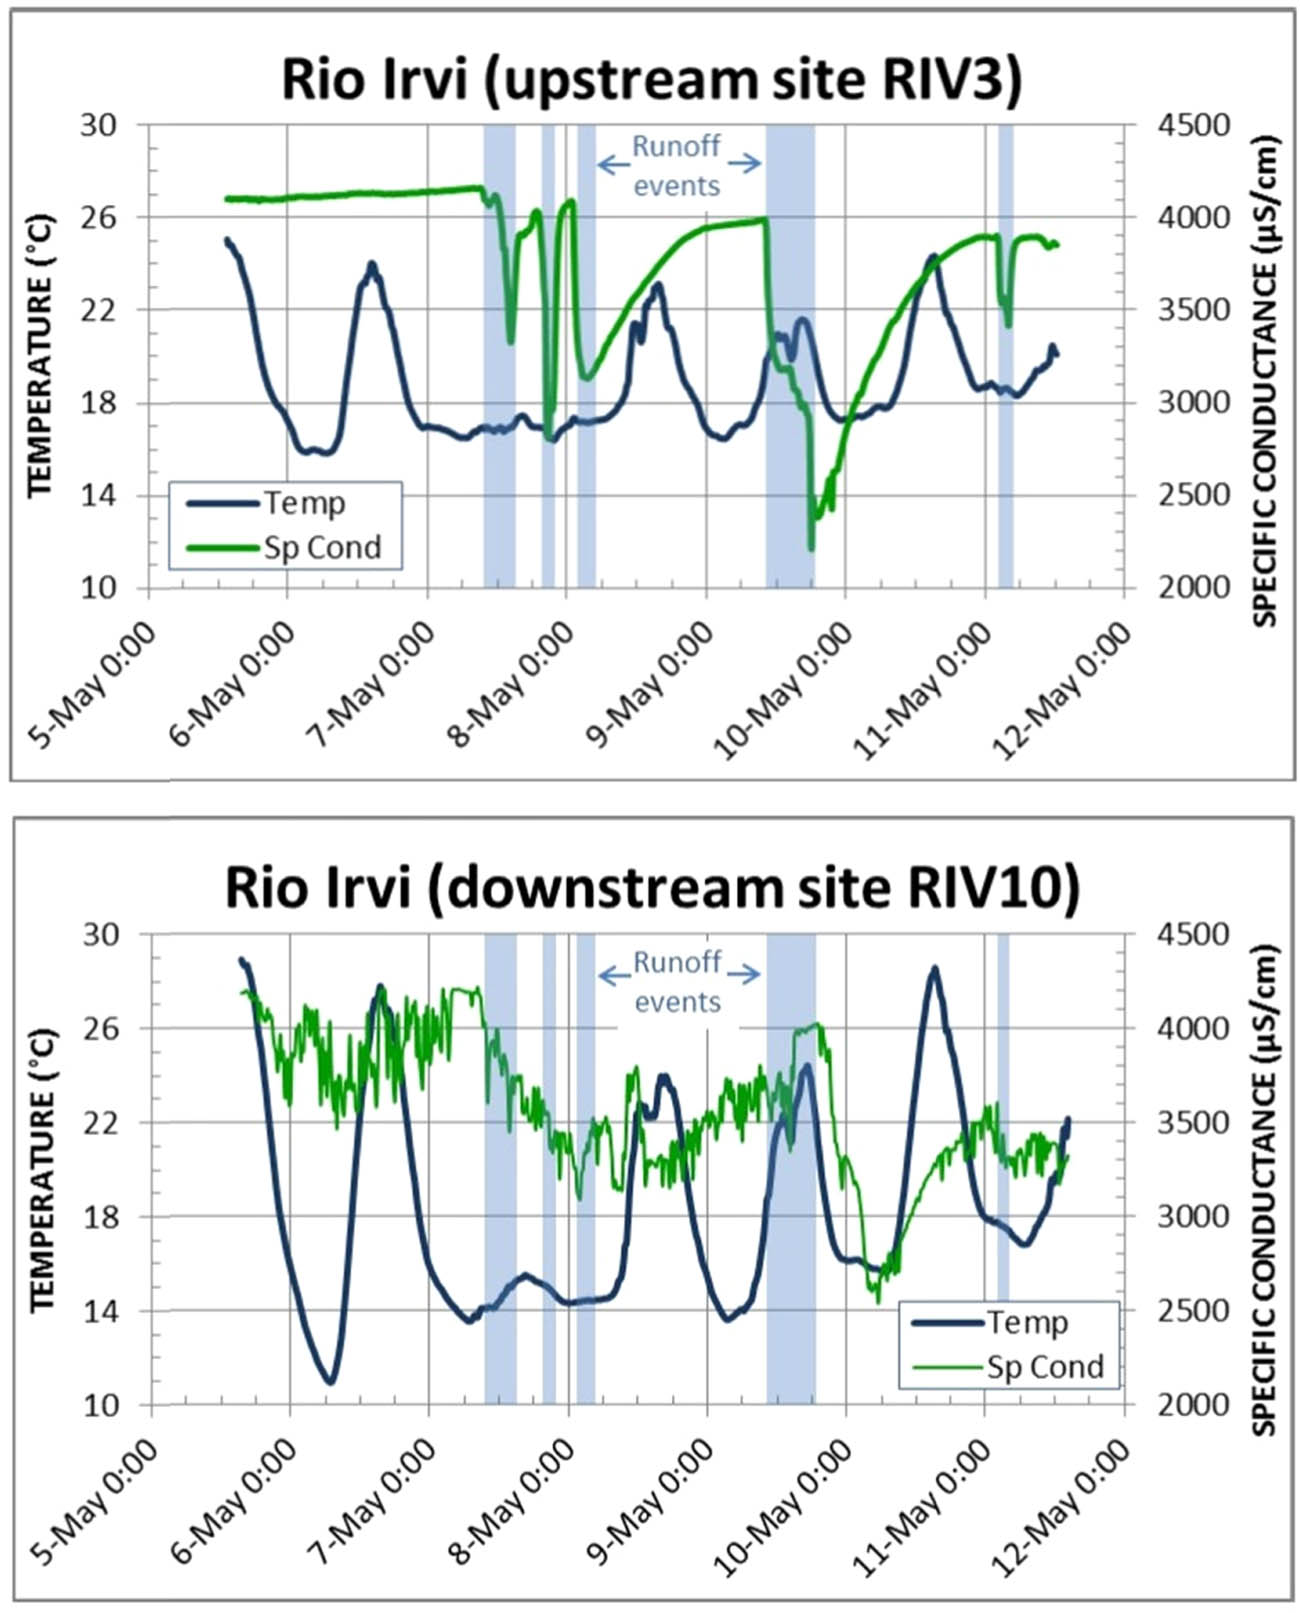
Figure 4
Comparative patterns of temperature and specific conductance at the two sites RIV3 and RIV10 throughout the period of measurements with the multi-parameter sondes.
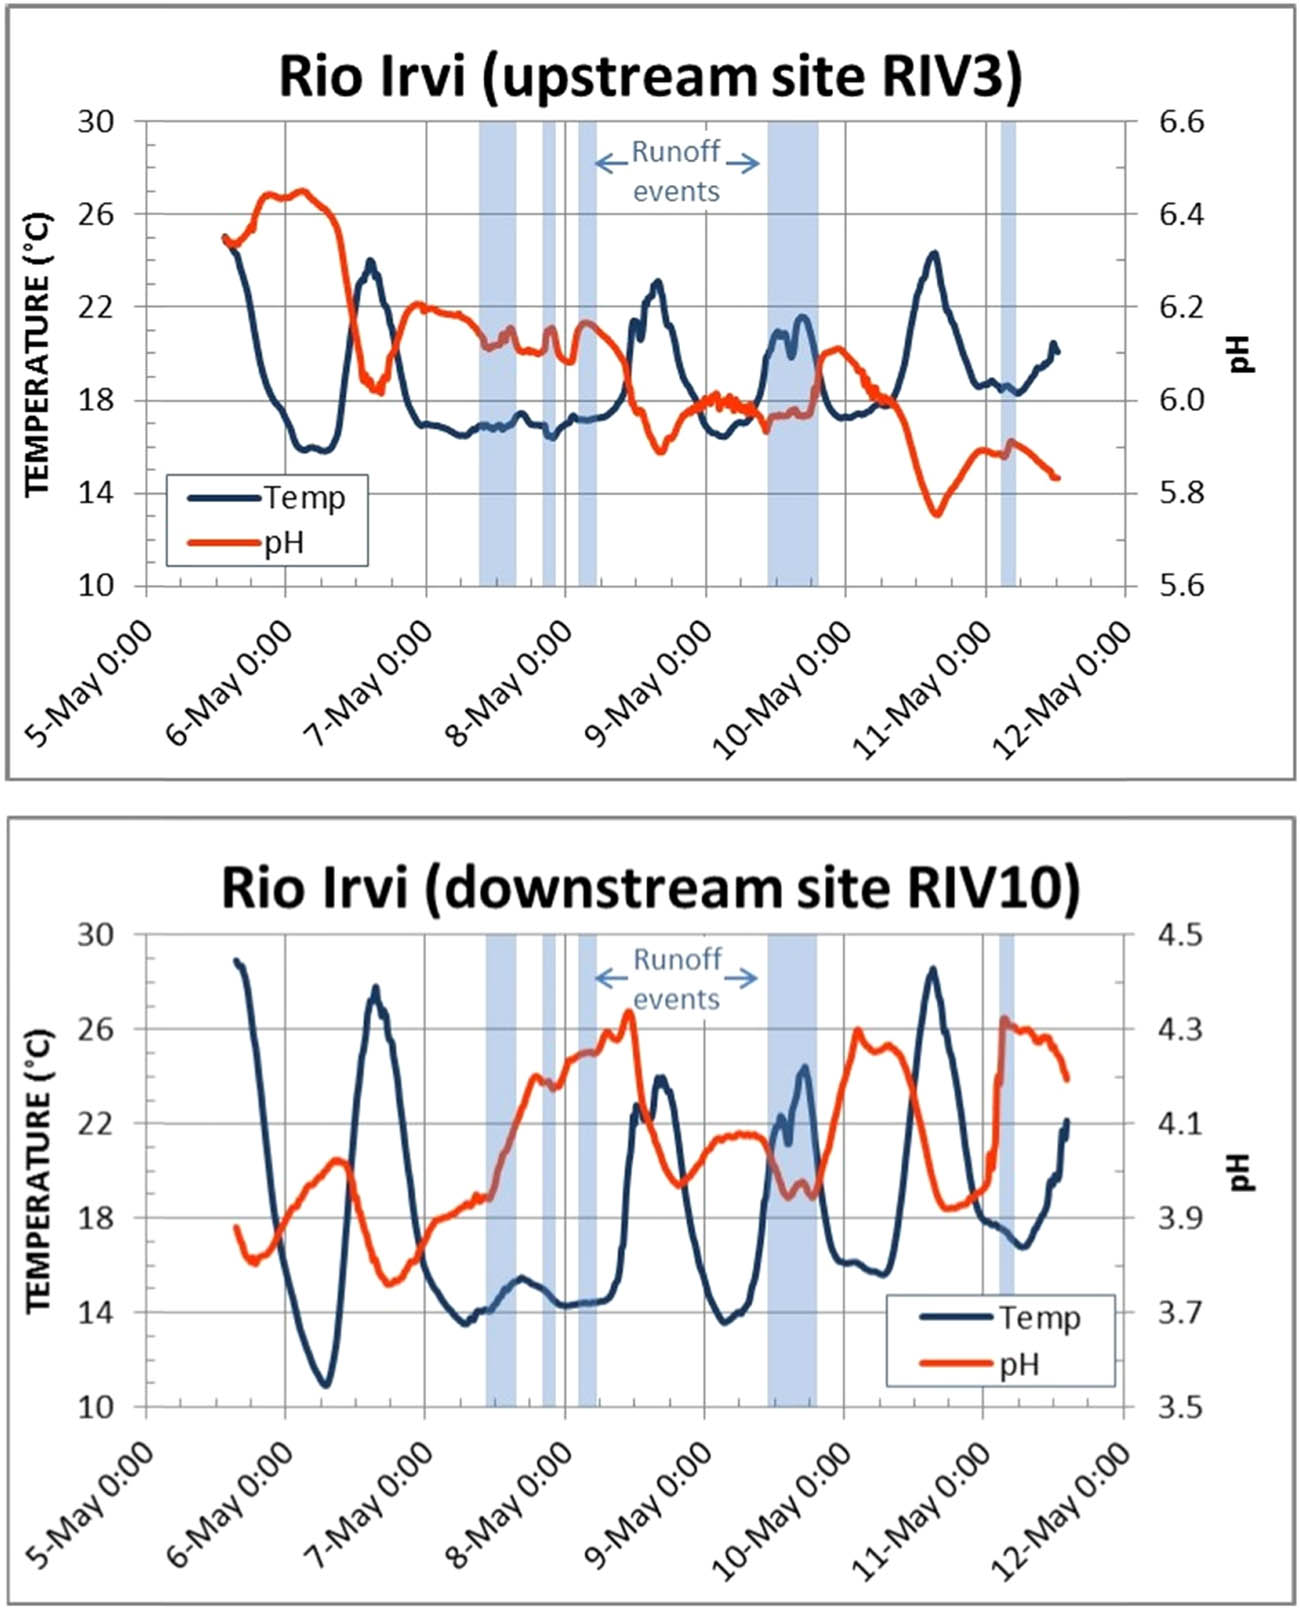
Figure 5
Comparative patterns of temperature and pH at the two sites RIV3 and RIV10, throughout the period of measurements with the multi-parameter sondes.
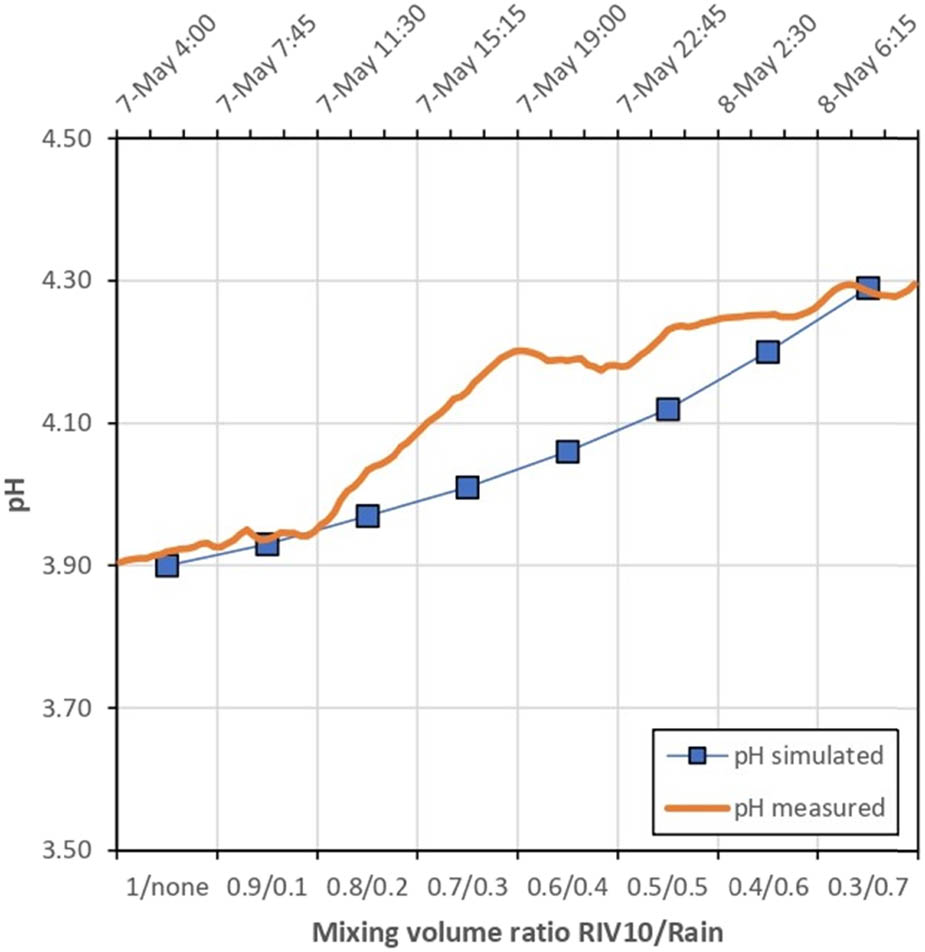
Figure 6
Measured and simulated pH patterns at the RIV10 site during a rainfall period.
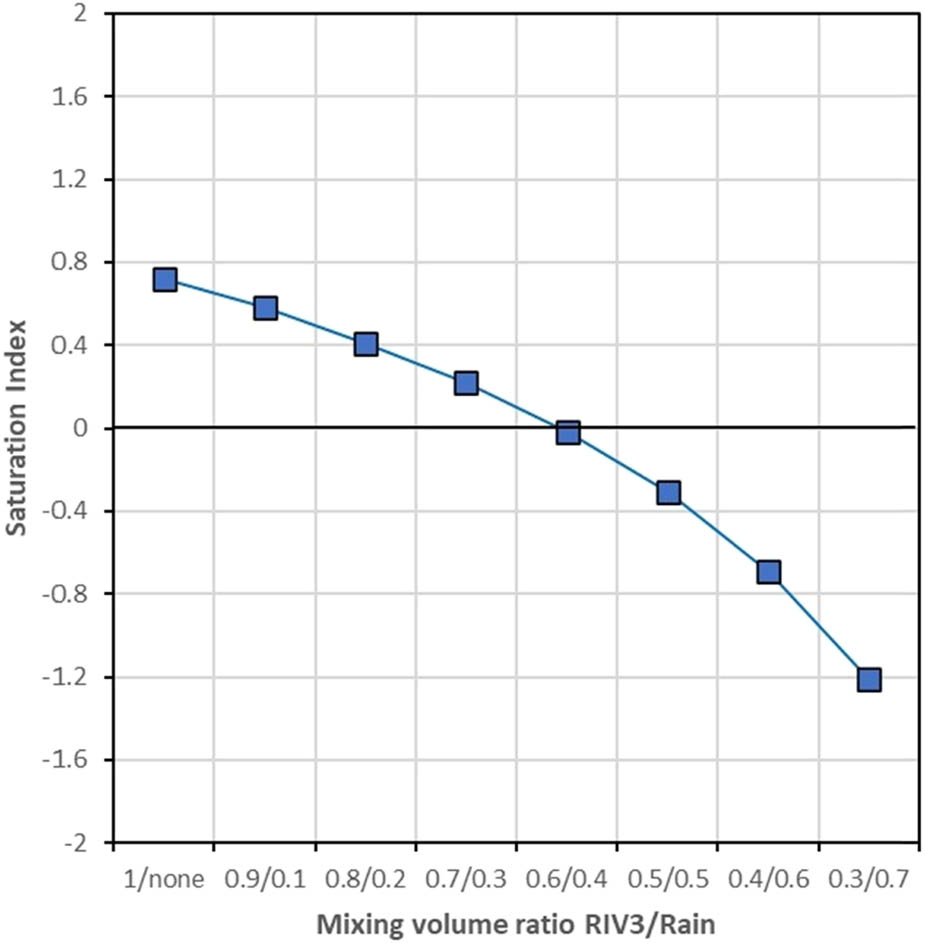
Figure 7
Simulated variation of the saturation index (SI) of sulphate green rust at the RIV3 site as a consequence of dilution due to rainfall.
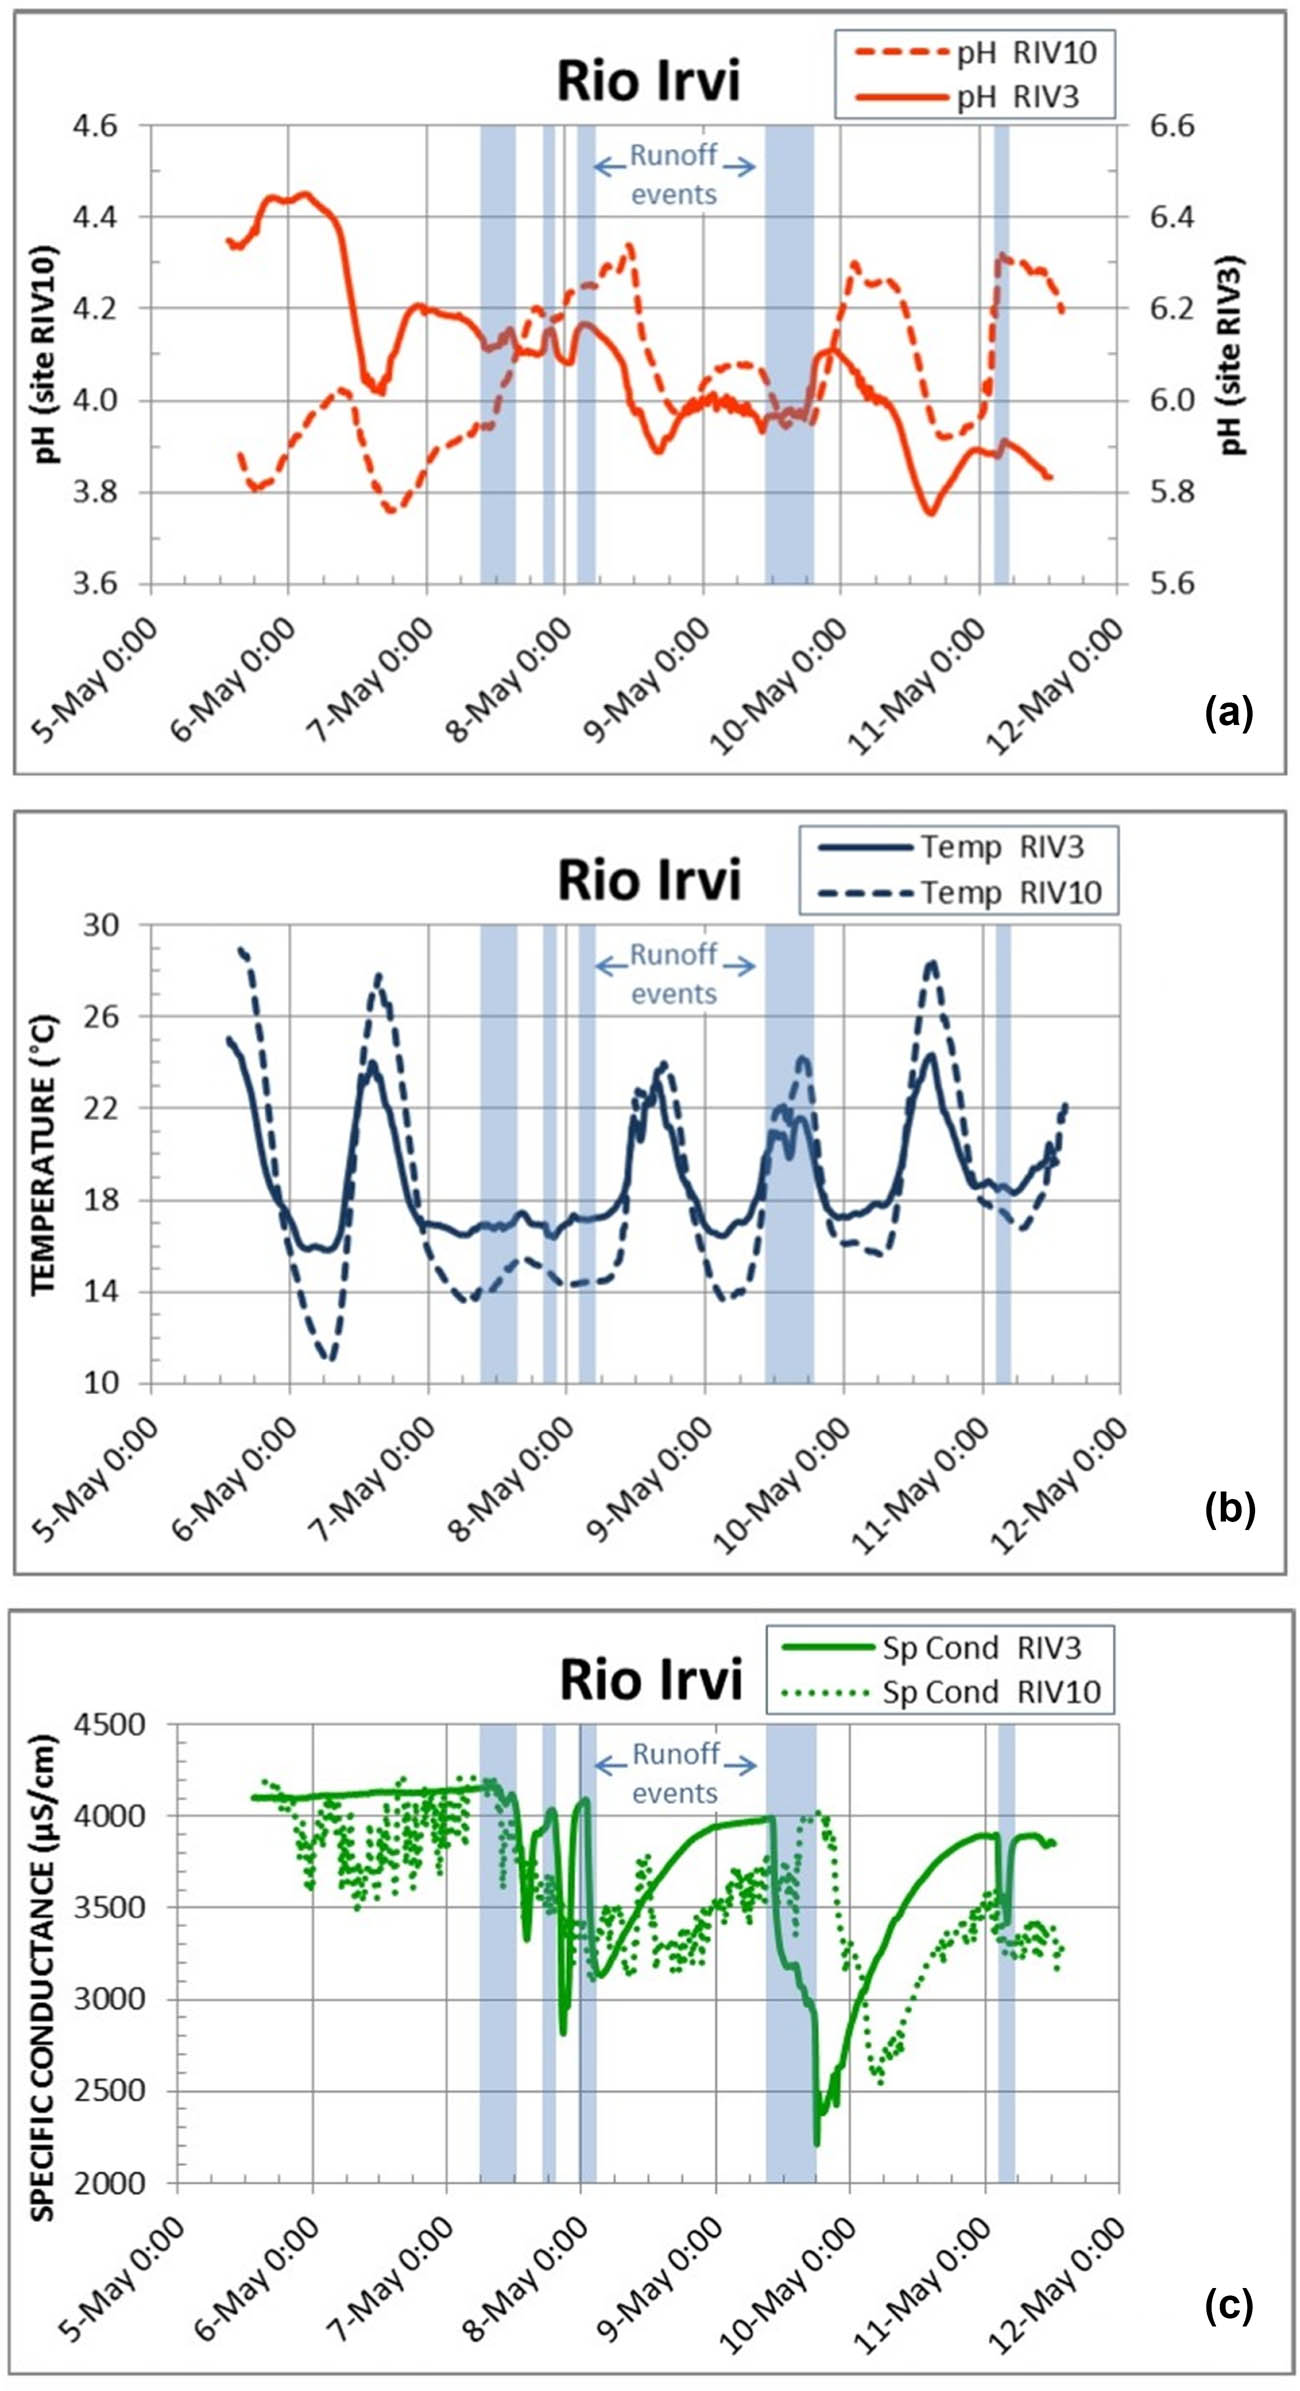
Figure 8
Comparative patterns of pH (a), temperature (b) and specific conductance (c) at the two sites RIV3 and RIV10 throughout the period of measurements with the multi-parameter sondes.