
1. Introduction
Present and past mining activities often have a negative impact on surface and groundwater quality, and many studies report information on spatial variations of contaminants along a river and monitoring over a period that can span up to several years (Chen et al., 2025; Cidu, 2011; Córdoba-Ariza et al., 2025; De Giudici et al., 2019; Jennings et al., 2025; Jung et al., 2025; Kshetrimayum & Laishram, 2020; Tao et al., 2025; Zhang et al., 2025). On the other hand, short-term temporal variations (the so-called “diel cycling”) of contaminants and physical–chemical parameters have also been studied (Frau et al., 2012; Gammons et al., 2005a, 2015; Nimick et al., 2007), but the results obtained are rarely used in characterization and monitoring plans of active and abandoned mine sites. In specific cases, a given chemical parameter might vary so widely over a 24-h period at each individual sampling point that its pattern along the river could be reversed depending on whether the sampling sequence is from upstream to downstream or from downstream to upstream, especially when carrying out complex sampling involving water collection and measurements at each sampling point, and the total sampling period lasts for at least 12 consecutive hours. As a result, that chemical parameter may appear to increase or decrease from upstream to downstream solely as a consequence of the order and timing of sampling during a survey in which sites are sampled sequentially over the course of a day. However, in most cases, the diel variation of major ions and physical-chemical parameters (e.g., pH, Eh, specific conductance) is very low, but some trace elements (e.g., As, Zn and Mn) have been shown to be particularly sensitive to diel cycling so that, in heavily contaminated environmental contexts, the variation can even be in the order of tens of µg/L (Frau et al., 2015; Gammons et al., 2007, 2015).
Rivers with variation of pH along the course from acidic to neutral or vice versa are particularly interesting because they allow to better understand the diel behaviour of trace elements, which, under near-neutral to alkaline conditions, is normally linked to reversible pH- and temperature-dependent adsorption processes (Gammons et al., 2005b, 2015; Jones et al., 2004; Nimick et al., 2003), whereas under acidic conditions it is frequently controlled by light-sensitive and bacteria-mediated Fe redox reactions (Gammons et al., 2005a, 2015; McKnight et al., 2001).
Despite the increasing use of automated sensors in environmental monitoring, high-frequency hydrogeochemical datasets collected in mining-impacted rivers are still relatively scarce, particularly in Mediterranean environments where hydrological conditions are often highly variable. High-frequency measurements can provide valuable insights into short-term geochemical processes that are often not detectable through conventional low-frequency sampling strategies. In this context, continuous monitoring of physicochemical parameters can help identify rapid geochemical responses to environmental perturbations such as rainfall events.
In this article, the author reports the results of a week of automated continuous measurements of temperature, pH and specific conductance in two different sampling points along the Rio Irvi (Sardinia, Italy), a river strongly affected by pollution related to past mining activity at the Casargiu mine. Although the initial idea was to collect physicochemical data for a sufficiently prolonged period under stable weather conditions, the unexpected occurrence of intense rainfall produced interesting results on the effects caused by the dilution of the Rio Irvi water with rainwater. This is a case of serendipity applied to environmental hydrogeochemistry.
The objective of this study is not to perform a hydrological characterization of rainfall-runoff processes in the catchment, but rather to investigate short-term hydrogeochemical responses observed through high-frequency monitoring of physicochemical parameters in a mining-polluted river.
2. Study area
Casargiu is one of the abandoned mines belonging to the Montevecchio-Ingurtosu mining system in SW Sardinia (Italy), characterized by Pb–Zn sulphide veins hosted in Palaeozoic silicate-dominant rocks. Mineralization at Casargiu mainly consists of sphalerite with an ankerite–siderite gangue (Frau et al., 2015). At Casargiu, exploitation reached 180 m below the elevation of the Casargiu gallery, whose entry is 158 m above sea level. The mine closure in the 1980s led to the shutdown of pumping systems needed to keep the galleries dry; thereafter, a highly polluted drainage flowing out of the Casargiu gallery was observed beginning in 1997 (Frau et al., 2015). The Casargiu drainage flows into the Rio Irvi, which, after about 6 km, merges with the Rio Piscinas, which in turn flows into the Mediterranean Sea after about 2 km (Figure 1). The Rio Irvi has a catchment area of about 15.4 km2 and a stream length of about 11 km. Due to climatic conditions mainly characterized by long periods of heat and drought, usually extending from May to September, and relatively short rainy periods, the outflow from the Casargiu gallery (20–70 L/s) still represents the main water contribution to the Rio Irvi throughout the year (De Giudici et al., 2018, 2019; Dore et al., 2020; Frau et al., 2015; Rigonat et al., 2019). Mean rainfall, calculated on pluviometric data of the Montevecchio (Figure 1) rain gauge station for the 1922–2010 period, is 735 mm/year, with a mean of 74 rainy days per year. July and August are the driest months, while November and December are the wettest months. The driest year was 1995 with a rainfall of just 376 mm and 41 rainy days, while 2010 was the wettest year (1,215 mm; 111 rainy days). Compared to the mean rainfall of the 1922–2010 period, the last 15 years have been wetter, with 1,154 mm in 1996, 1,065 mm in 2004 and 973 mm in 2009. The mean rainfall of the 1995–2010 period is 824 mm, with a mean of 77 rainy days per year. The mean annual temperature from 1922 to 2010 is 15°C.
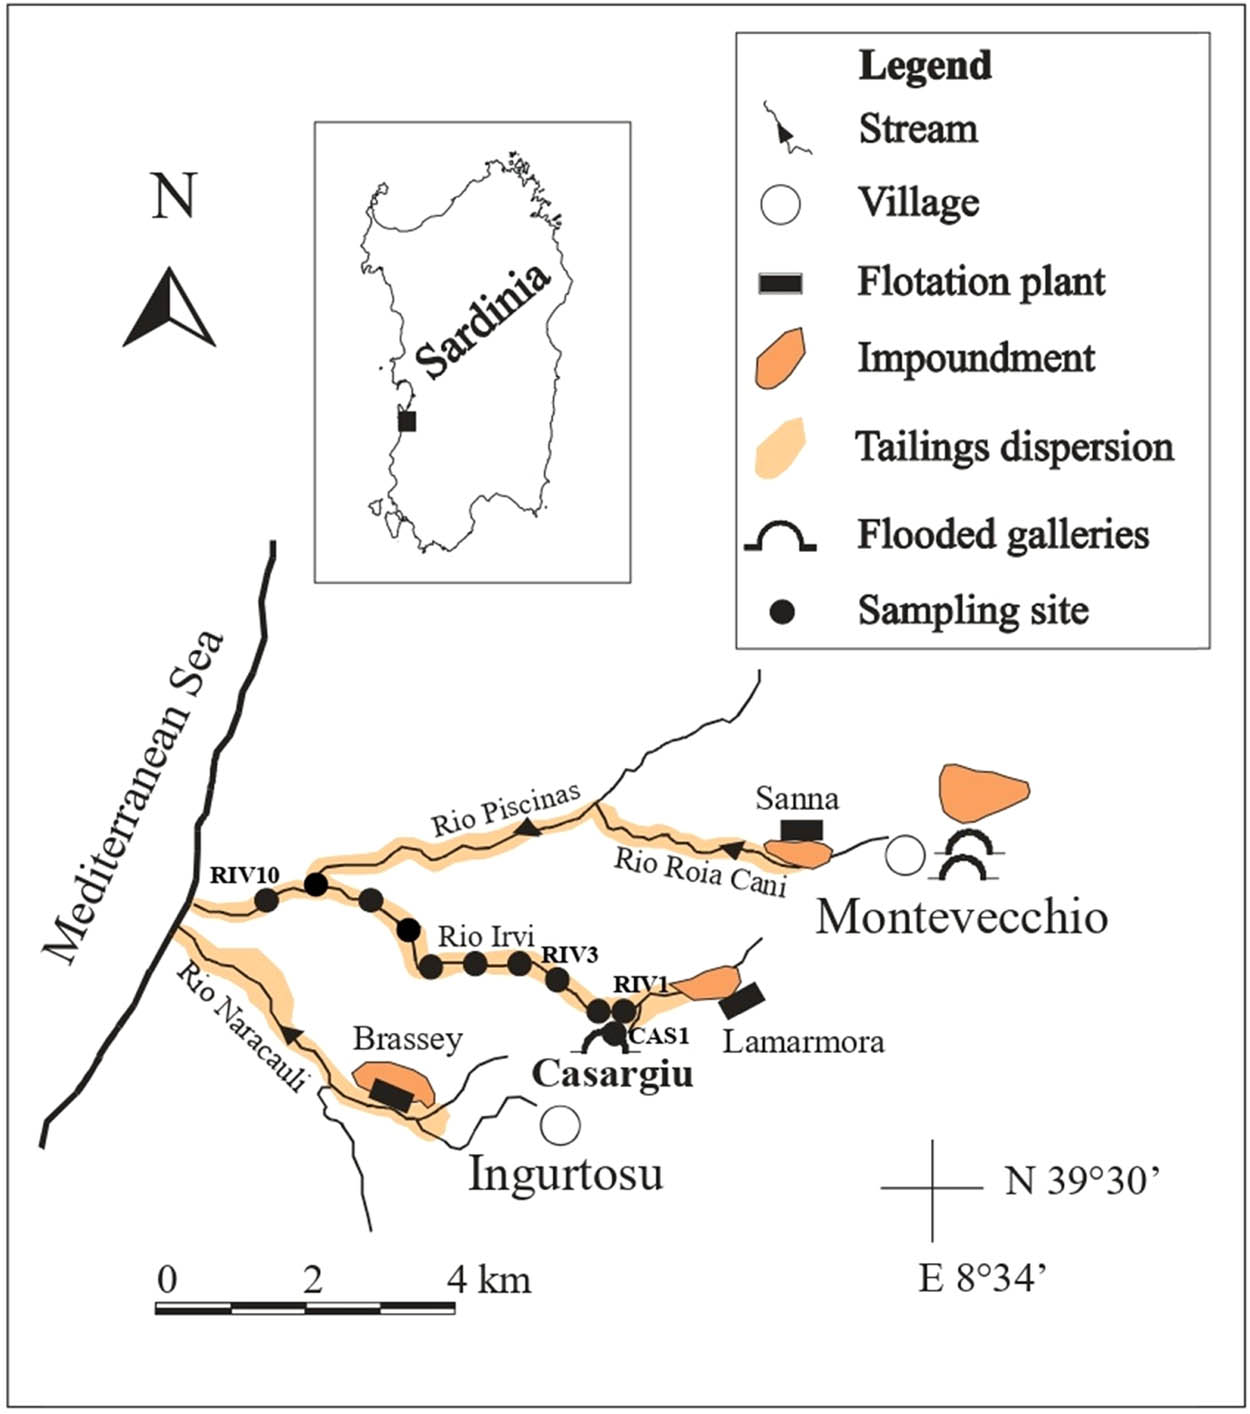
Figure 1
Schematic map of the Arburese mining district (black square in the inset with Sardinia) showing the location of the Casargiu mine, the sampling site CAS1 at the water outlet from the Casargiu mining gallery, the sampling sites from RIV1 to RIV9 along the Rio Irvi, and the RIV10 sampling site after the confluence of Rio Irvi with Rio Piscinas. The latter was completely dry during the sampling period.
Looking specifically at 2016, and again based on data collected at the Montevecchio rain gauge station (370 m above sea level), the five wettest months were March (141.4 mm), February (119 mm), December (84.6 mm), November (78.2 mm) and May (73.8 mm) and the total rainfall for the whole year was 647 mm with 73 rainy days. The figure for May represents the “anomaly” on which this study is based, with the rainfall concentrated precisely during the week when data were collected using the multi-parameter sondes. Although May in Sardinia is not generally a rainy month, it should be noted that rainfall can vary considerably from year to year. Looking at just two years around 2016, it can be seen that in May 2015 and 2017, total rainfall was 13.2 and 0.4 mm, respectively. But looking, for example, at rainfall in 2018, it can be seen a very significant anomaly, with as much as 274.0 mm of rain in May, making it the wettest month of the entire year, which recorded 1,208 mm of rain spread over 115 days.
All the rainfall data shown above were taken from the Hydrological Annals of ARPAS (Sardinian Regional Agency for Environmental Protection).
3. Sampling and methods
Temperature, pH and specific conductance were measured every 15 min in two different sampling sites (RIV3 and RIV10) along the Rio Irvi (Figures 1–3) using in-situ multi-parameter sondes equipped with calibrated sensors (Aqua TROLL® 600 Multiparameter Sonde manufactured by In-Situ, Inc., 221 East Lincoln Avenue, Fort Collins, CO 80524, USA). The sondes were calibrated prior to deployment following standard procedures using certified buffer solutions for pH and conductivity standards for specific conductance.
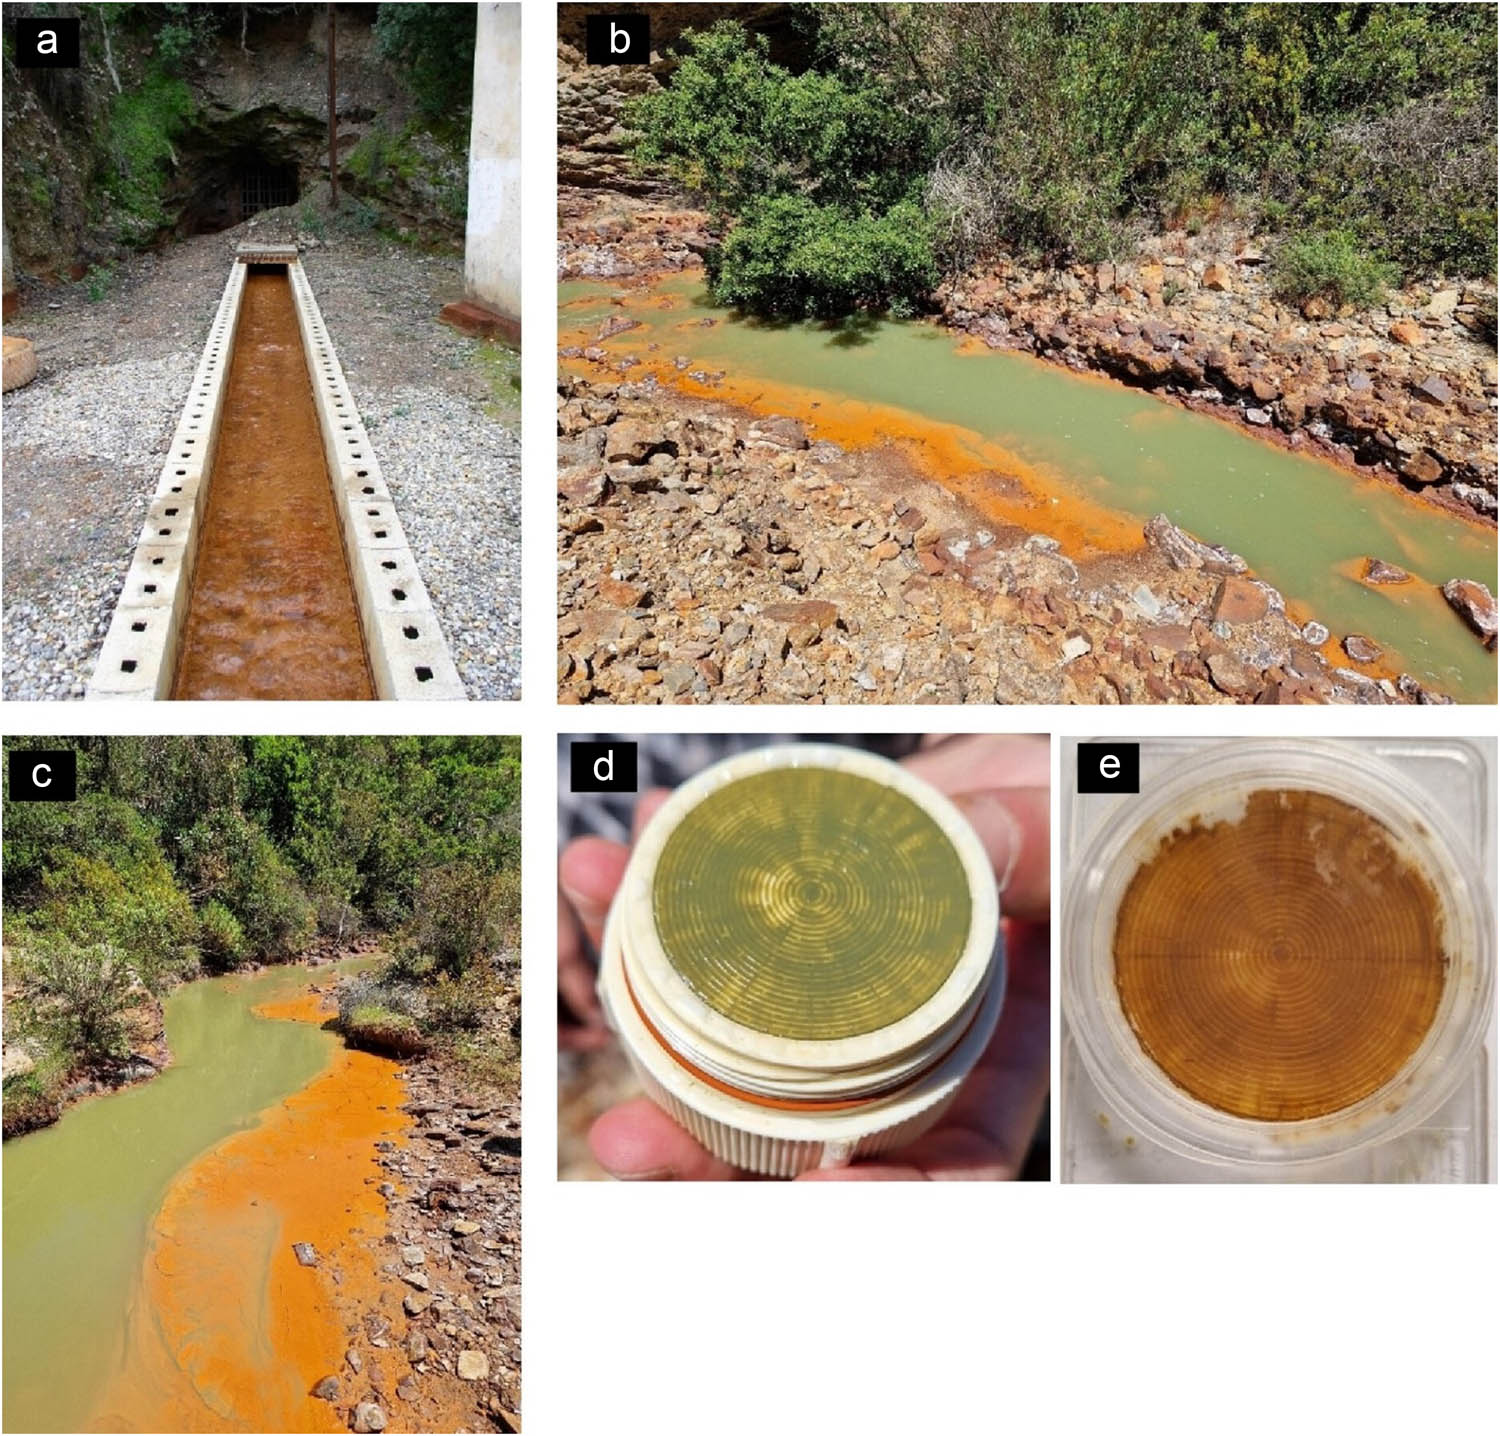
Figure 2
(a) Water outlet from the Casargiu mining gallery (CAS1); (b and c) the RIV3 sampling site in the Rio Irvi where “green rust” formation is evident; (d) “Green rust” on 0.45-µm filter collected filtering water from the Rio Irvi at the RIV3 sampling site; (e) same filter as d after 24 h where the colour change is due to oxidation of Fe(II), present in the composition of the “green rust”, to Fe(II).
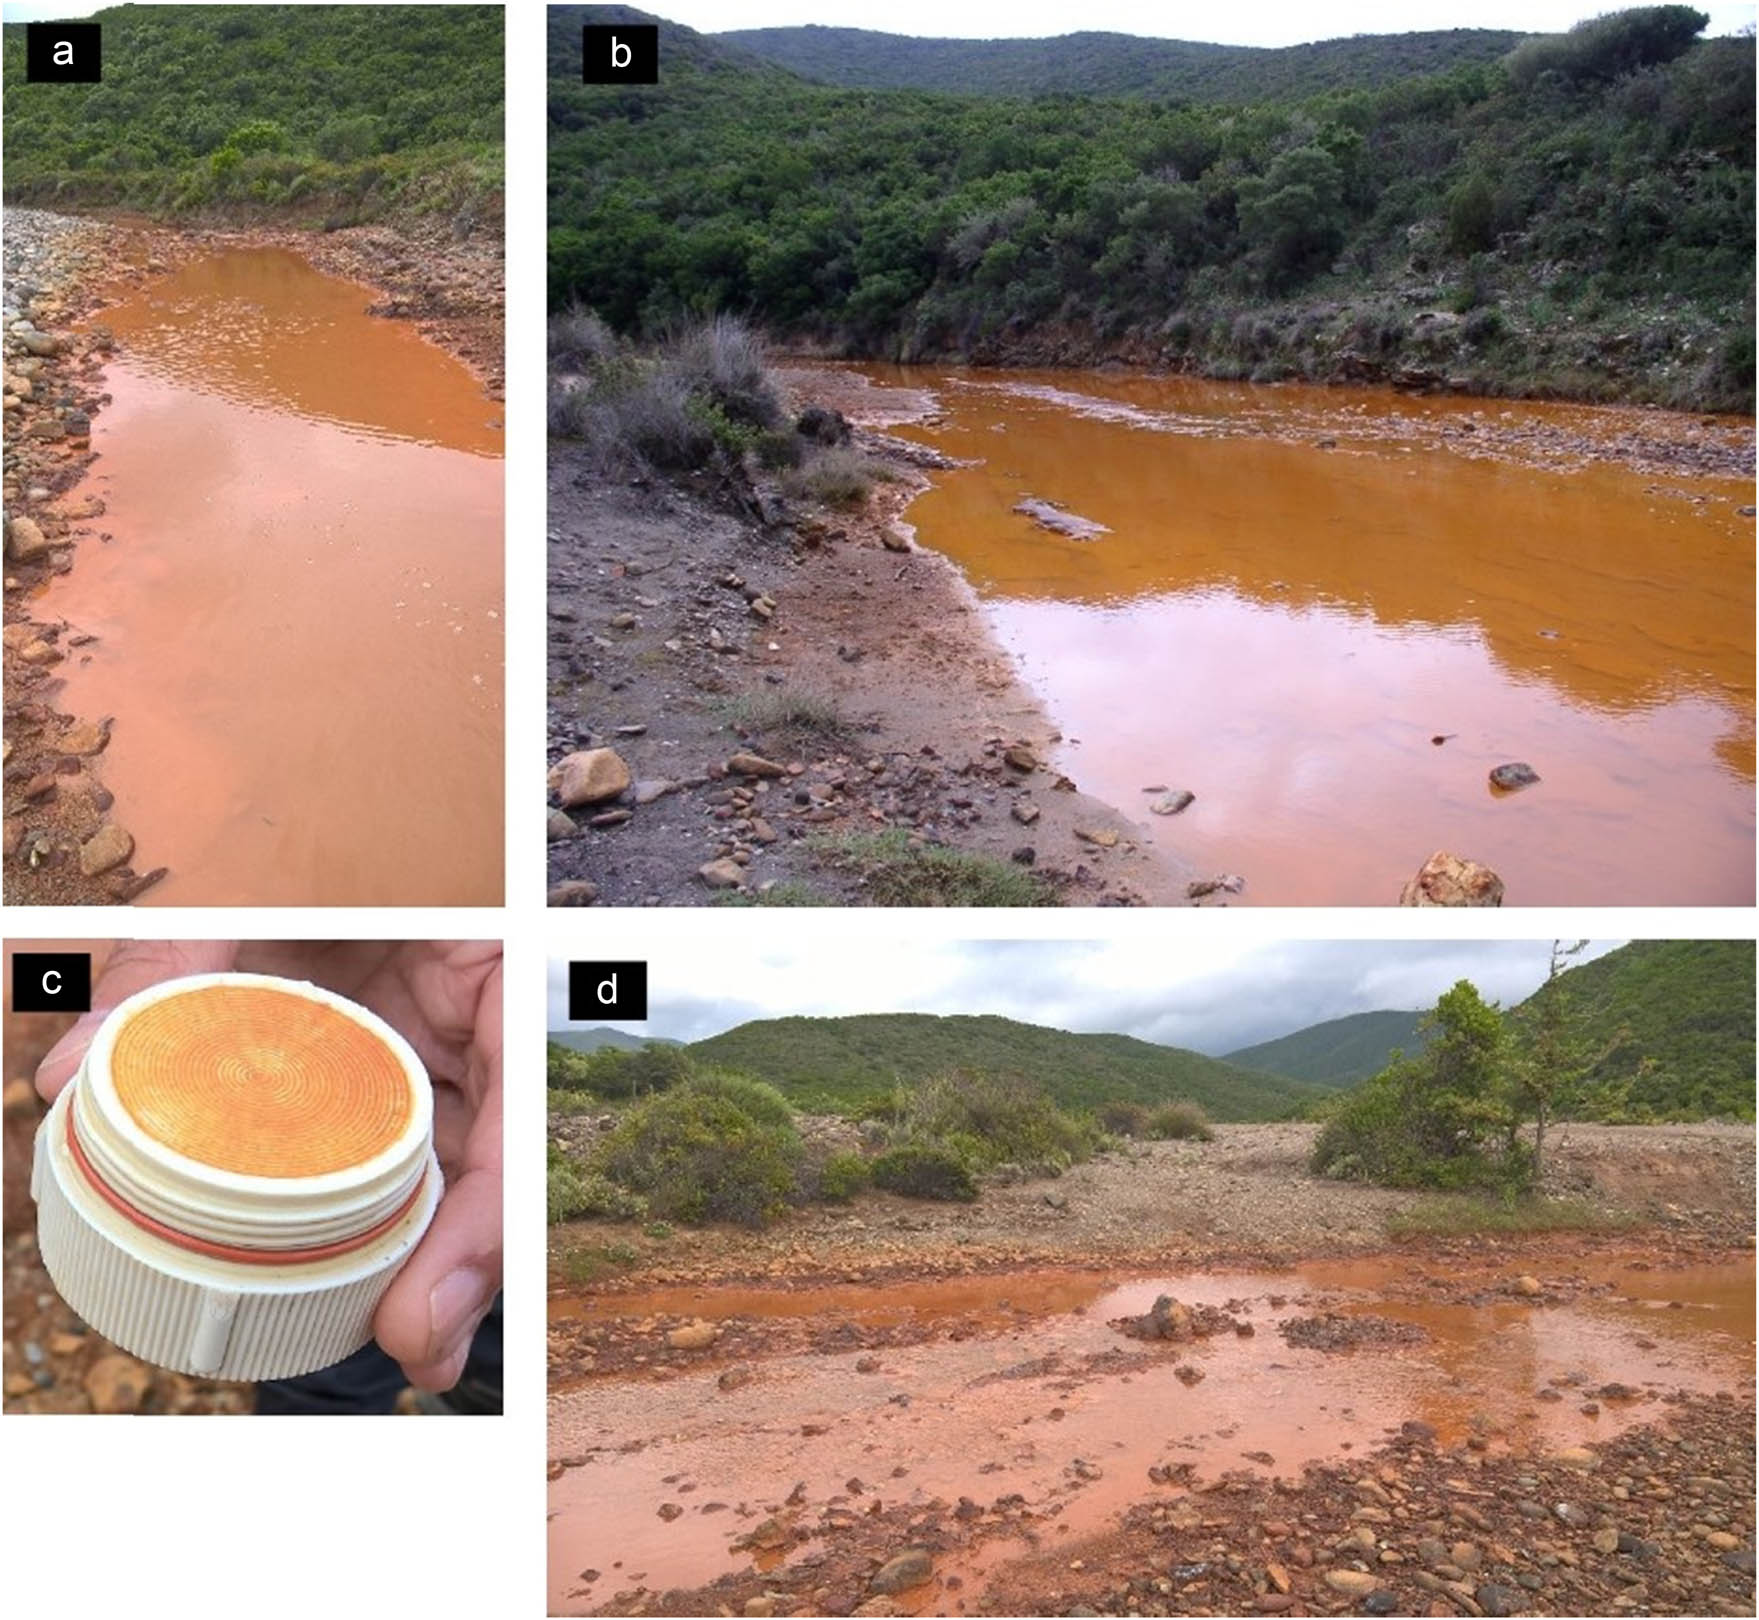
Figure 3
(a, b and d) The RIV10 sampling site in the Rio Irvi where precipitation of Fe(III)-hydroxides (HFO) is evident; (c) HFO collected on 0.45-µm filter filtering water from the Rio Irvi at the RIV10 sampling site.
Measurements at the RIV3 site (corresponding to the CAS4 sampling site in Frau et al., 2015) began at 13:30 on 5 May 2016 and ended at 12:15 on 11 May 2016, while measurements at the RIV10 site (corresponding to the CAS9 sampling site in Frau et al., 2015) began at 15:30 on 5 May 2016 and ended at 14:15 on 11 May 2016. On 5 May 2016, a complete water sampling was carried out at the two sites RIV3 and RIV10 (Table 1): the pH, redox potential (Eh, Orion Pt electrode), dissolved oxygen (YSI Incorporated Ohio, Model 50B dissolved oxygen meter), temperature and alkalinity were measured in the field; water samples were filtered through 0.4-µm pore-size Nuclepore polycarbonate filters and collected into pre-cleaned high-density polyethylene bottles. Filtered aliquots were acidified on site with suprapure grade HNO3 for metal analyses by quadrupole inductively coupled plasma – mass spectrometry (ICP-MS) and major cations by inductively coupled plasma – optical emission spectrometry (ICP-OES). Anions were determined by ion chromatography (IC) on a filtered (0.4 µm), unacidified aliquot.
Table 1
Chemical composition of Rio Irvi at the two sampling points RIV3 and RIV10
| Old name | CAS4 | CAS9 | |
|---|---|---|---|
| New name | RIV3 | RIV10 | |
| Flow | L/s | 55 | 58 |
| T | °C | 24.3 | 28.7 |
| Eh | mV | 183 | 498 |
| pH | 6.29 | 3.89 | |
| Cond | mS/cm | 4.11 | 4.19 |
| O2 | mg/L | 7.23 | 7.36 |
| TDS | g/L | 5.43 | 5.27 |
| Ca | mg/L | 390 | 370 |
| Mg | mg/L | 252 | 246 |
| Na | mg/L | 78 | 93 |
| K | mg/L | 15 | 18 |
| Cl | mg/L | 87 | 132 |
| Alk | mg/L | 65 | |
| SO4 | mg/L | 3,525 | 3,450 |
| SiO2 | mg/L | 17.5 | 19.2 |
| Fe | mg/L | 152 | 108 |
| Mn | mg/L | 70 | 68 |
| Zn | mg/L | 775 | 770 |
| Cd | µg/L | 2,110 | 1,940 |
| Pb | µg/L | 140 | 660 |
| Ni | µg/L | 2,480 | 2,320 |
| Sb | µg/L | 0.37 | 0.21 |
| Co | µg/L | 1,480 | 1,375 |
| Ca | meq/L | 19.46 | 18.46 |
| Mg | meq/L | 20.72 | 20.23 |
| Na | meq/L | 3.39 | 4.04 |
| K | meq/L | 0.38 | 0.46 |
| Cl | meq/L | 2.45 | 3.72 |
| Alk | meq/L | 1.07 | 0.00 |
| SO4 | meq/L | 73.44 | 71.88 |
| Fe | meq/L | 5.44 | 3.87 |
| Mn | meq/L | 2.55 | 2.48 |
| Zn | meq/L | 23.71 | 23.56 |
| Σcat | meq/L | 75.67 | 73.10 |
| Σan | meq/L | 76.96 | 75.60 |
| Δ | −0.02 | −0.03 |
Milliequivalents per litre of Fe were calculated considering it as Fe2+. Δ is the charge balance error calculated as (Σcat – Σan)/(0.5 · (Σcat + Σan)). TDS means Total Dissolved Solids. Alk is the alkalinity expressed as .
The decision to carry out the one-week measurements using the multi-parameter sondes during the first half of May was determined primarily by three factors: (1) the presence of the visiting researcher Dr. David A. Nimick from the USGS (United States Geological Survey), who had brought the multi-parameter sondes; (2) May in Sardinia is usually neither too hot nor too rainy, and is therefore suitable for the type of study planned, although there can be significant variations in rainfall from year to year; and (3) the battery life of the sondes.
The locations of the sampling points along the Rio Irvi that are not discussed in this study are nevertheless shown in Figure 1, simply as black dots without any code, in order to clarify why the RIV3 and RIV10 sampling points have that numbering, which is derived from a previous study (Frau et al., 2015).
Variation (Var) of a parameter was defined as the difference between the maximum value (V max) and the minimum value (V min):
Delta percentage (D%) of a parameter was calculated according to the following equation:Speciation-solubility calculations were performed using the computer program PHREEQC Interactive (version 3.7.3.15968 released on December 2, 2021; Parkhurst & Appelo, 2013) with the included thermodynamic database “wateq4f.dat.” The solubility product (K sp) of sulphate green rust (GR) was added to the thermodynamic database (Frau et al., 2015). A hydrogeochemical modelling was performed with PHREEQC using the complete chemical composition of river water at the RIV3 and RIV10 sites (samples collected at the beginning of the monitoring period), as reported in Table 1. The aim of the modelling was not to simulate time-dependent hydrogeochemical evolution of river water at the two sampling sites, but rather to assess the effect of dilution with rainwater on pH and mineral saturation state.4. Results and discussion
4.1. Temperature-specific conductance relationship
Figure 4 shows the comparative patterns of temperature (T) and specific conductance (SC) at the two sites RIV3 and RIV10 throughout the period of measurements with the multi-parameter sondes. In the time span before the first rainfall, at the RIV3 site, a constant SC can be observed, while T follows the typical sinusoidal pattern related to the alternation between day and night (Var = 9°C; D% = 58). As SC is a conductivity measurement corrected to 25°C, its invariance between day and night is expected, unless there are external water inputs. With the beginning of the first rainy period, it is interesting to note that the day-night thermal effect on T is cancelled out, while SC decreases abruptly three times due to dilution with rainwater but always returns to the initial value, first very quickly and then more gradually (about 30 h). The rising speed of SC is obviously influenced by the amount of rain falling in the unit of time, always taking into account that the Rio Irvi, for most of the year, is mainly fed by groundwater coming out of the Casargiu gallery (CAS1). The rain on 9–10 May almost halves SC, which takes about 24 h to return to its initial value. In this case, it is interesting to note that the daily variation of T is less influenced by the rain, maintaining a general sinusoidal pattern. Similar patterns are observed at the RIV10 site, although here the SC measurements are more unstable, and the curve is strongly jagged. The main differences with RIV3 are that (i) the range of T is much wider (Var = 18°C; D% = 165); (ii) during the first rainy period, SC decreases progressively instead of falling and rising; (iii) the minimum SC is reached about 12 h after the 9–10 May rainfall. All this can be explained by the fact that the RIV10 site is several kilometres downstream of RIV3, it is located in the coastal plain quite close to the sea, it is less readily affected by groundwater input from CAS1, and it collects a larger volume of runoff during rainfall.
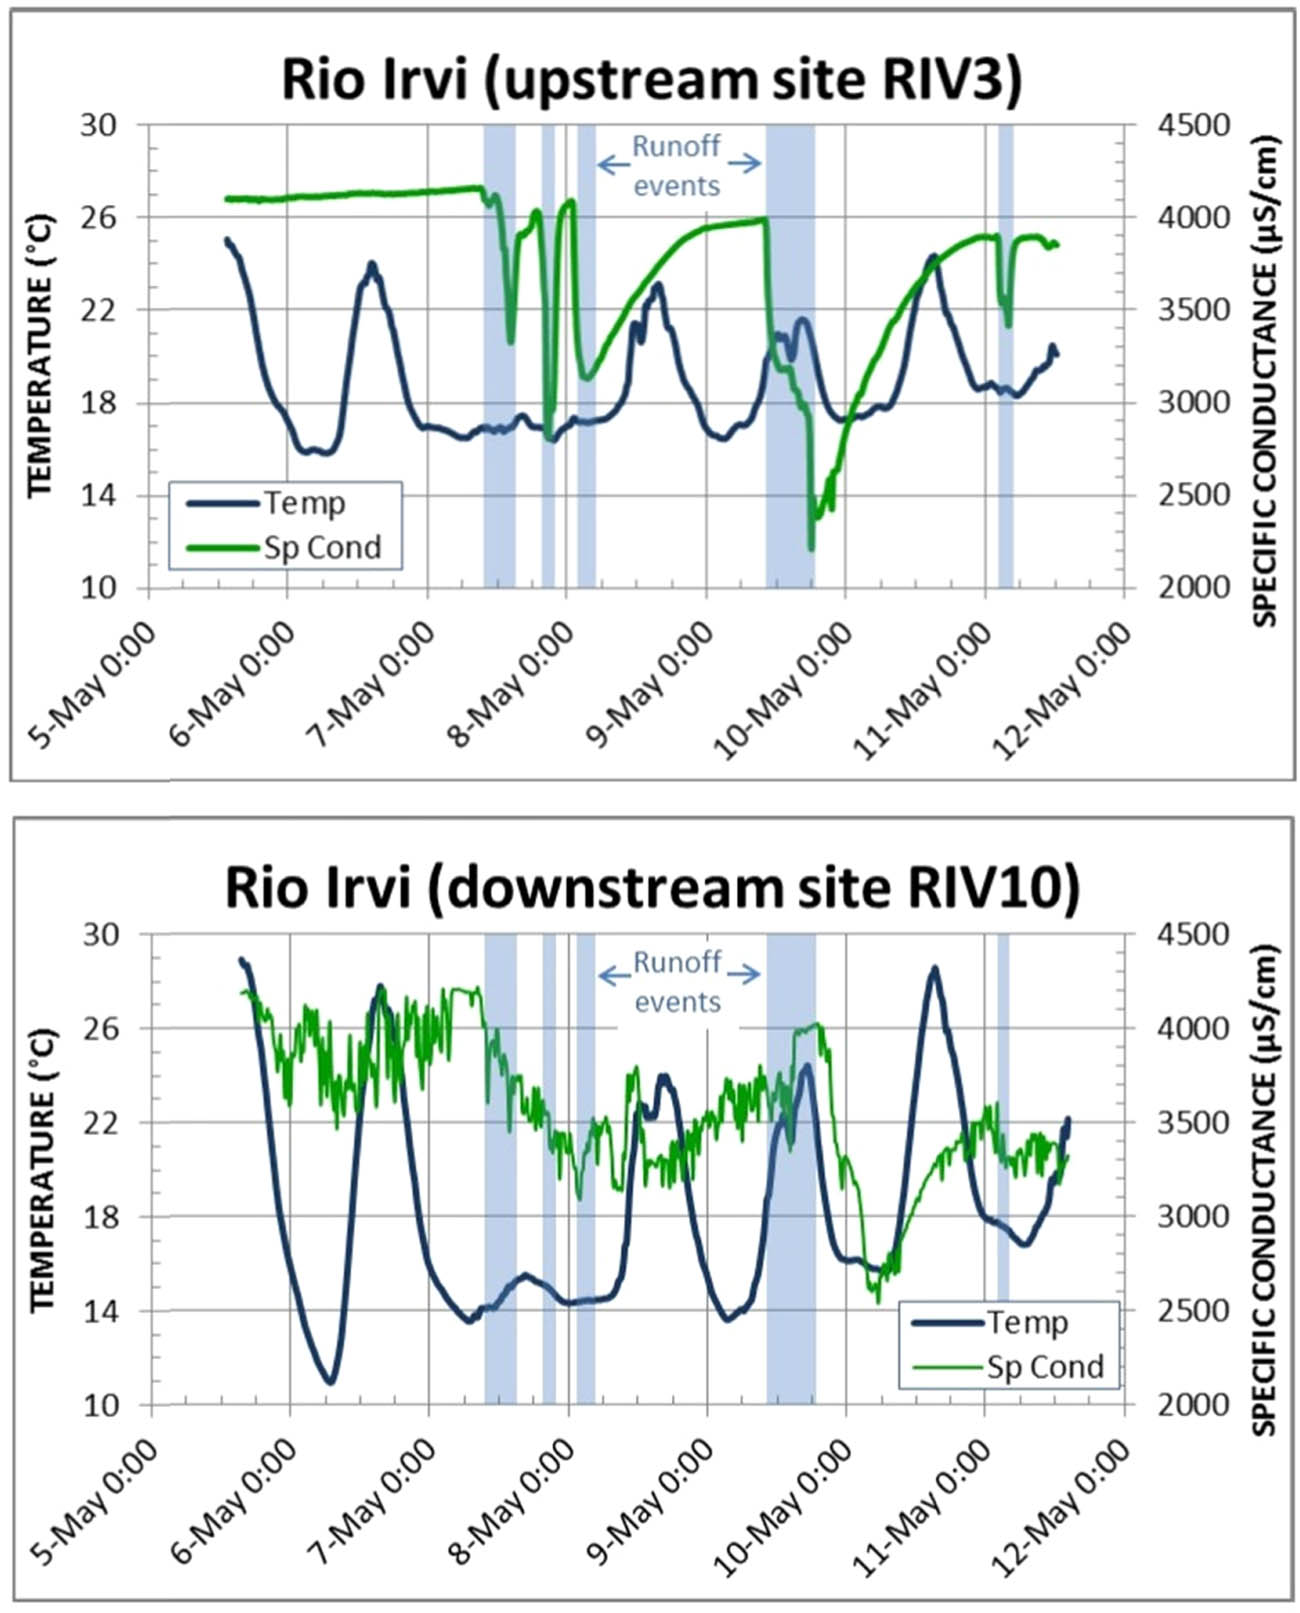
Figure 4
Comparative patterns of temperature and specific conductance at the two sites RIV3 and RIV10 throughout the period of measurements with the multi-parameter sondes.
4.2. Temperature–pH relationship
Figure 5 shows the comparative patterns of temperature (T) and pH at the two sites RIV3 and RIV10 throughout the period of measurements with the multi-parameter sondes. At the RIV3 site, the pH is mildly acidic, ranging from 5.75 to 6.45 (Var = 0.70; D% = 12), and its pattern is highly symmetrical to the T pattern. A discordant T–pH pattern is also present at the RIV10 site, where the pH is acidic, ranging from 3.76 to 4.34 (Var = 0.58; D% = 15). This discordant relation between T and pH has already been shown in other studies but is still rather uncommon since the literature generally reports a concordant T–pH relation linked to the photosynthesis-respiration cycles of aquatic life (at least in rivers with neutral or slightly alkaline pH) according to the following reactions where (org) and (aq) stand for organic and aqueous, respectively (Gammons et al., 2015):
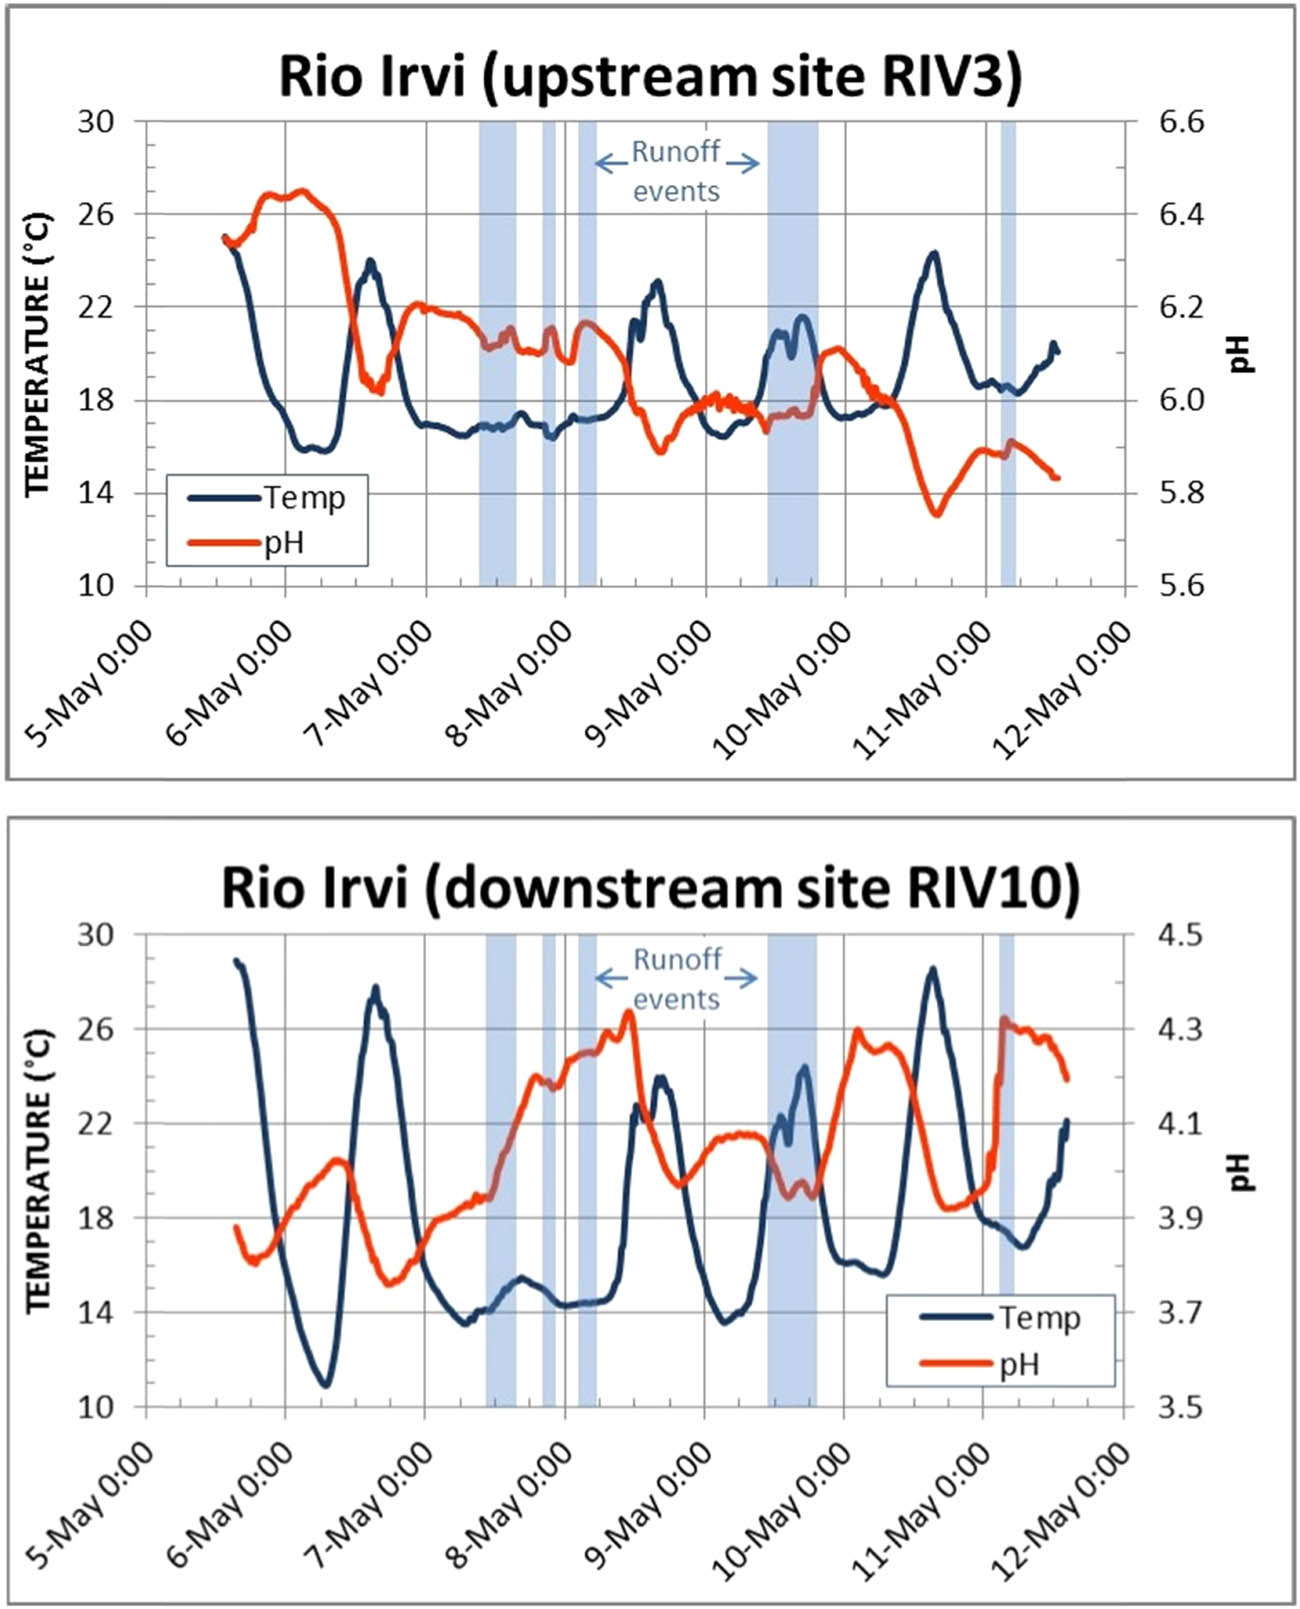
Figure 5
Comparative patterns of temperature and pH at the two sites RIV3 and RIV10, throughout the period of measurements with the multi-parameter sondes.
Daytime T increase
Nighttime T decrease
Even in metal-polluted rivers where there may be very little aquatic life, the effect of temperature on CO2 solubility would lead to the result described above in each case. However, if we focus on the production–consumption of O2 related to the photosynthesis–respiration cycles, other oxidation–reduction reactions can be influenced, such as those involving the Fe species that, together with SO4, Zn, Mg and Ca, dominate the chemical composition of the Rio Irvi water (Frau et al., 2015). In particular, when the following reactions are considered: where (am) stands for amorphous and reaction (9) is the combination of reactions (7) and (8), it is apparent that daytime O2 production from photosynthesis shifts the reaction (9) to the right, generating acidity, while nighttime O2 consumption from respiration shifts the reaction (9) to the left or simply slows it down, consuming or not-producing acidity and partially redissolving the previously precipitated Fe(III)-hydroxide. As described in a previous study (Frau et al., 2015), the reaction (9) predominates at the RIV10 site, while the RIV3 site is characterized by the precipitation of GR (sulphate green rust) according to the following reaction:which is analogous to reaction (9) in determining the pH pattern opposite to the T pattern. In both cases, the effect of temperature on O2 solubility should not be so important since O2 is much less soluble in water than CO2.An opposite relation between T and pH could also be due to photoreduction of aqueous Fe(III) according to such a reaction:
Gammons et al. (2005a) also suggested the importance of aqueous Fe3+ speciation in determining a diel cycle of pH analogous to that described in this article, according to the following reaction:However, Fe speciation at both RIV3 and RIV10 sites is by far dominated by the free Fe2+ ion, while the dominant Fe(III) species are and Fe(SO4)+, respectively, but with concentrations three–four orders of magnitude lower than Fe2+. Therefore, it seems very unlikely that changes in pH during 24 h are determined by the formation/dissociation of the aqueous Fe(SO4)+ complex.There is no doubt that the complex biological/microbial activity present in the Rio Irvi, which is still at an early stage of study and understanding, has a decisive influence on the Fe (and other metals) cycle in solution and in precipitates, and consequently also on pH (Gammons et al., 2015; Lueder et al., 2020; Morris et al., 2005; Paganin et al., 2021).
4.3. Rainfall effect
It is also interesting to observe the effect of the first rainfall period in which T and pH remain almost constant at the RIV3 site, while at the RIV10 site, a relative constancy of T is accompanied by a clear increase in pH. This can be explained by the fact that dilution with rainwater, to which a pH of 5.65 (pure rain in equilibrium with atmospheric CO2) can be attributed, does not substantially change the mildly acidic pH of the river water at the RIV3 site, while it causes the increase of the markedly acidic pH at the RIV10 site. Pure rain in equilibrium with atmospheric CO2 can be used in subsequent simulations, as the concentrations of solutes (in particular, sulphate and iron) in rainwater are negligible compared to the water of the Rio Irvi, which contains very high concentrations of dissolved ions (Table 1). For example, studies conducted on rainwater in Sardinia (Caboi et al., 1995) have determined dissolved iron concentrations averaging 13 μg/L, compared with concentrations exceeding 100 mg/L at the two sites RIV3 and RIV10, and dissolved sulphate concentrations in the range of 5–11 mg/L, compared with concentrations of around 3,500 mg/L in the Rio Irvi.
A simulation was carried out with PHREEQC to estimate the volume of rain needed to raise the pH at the RIV10 site; Figure 6 shows that, starting from pH of 3.89 in the absence of rain, a progressive mixing of rain up to 70% of the water flowing in the Rio Irvi is needed to achieve pH of 4.30 at the end of the rainfall period from 7 to 8 May. It is evident that the slope of the two curves shown in Figure 6 cannot be the same, as the simulation does not take into account the time as a variable in the mixing of river water and rainwater.
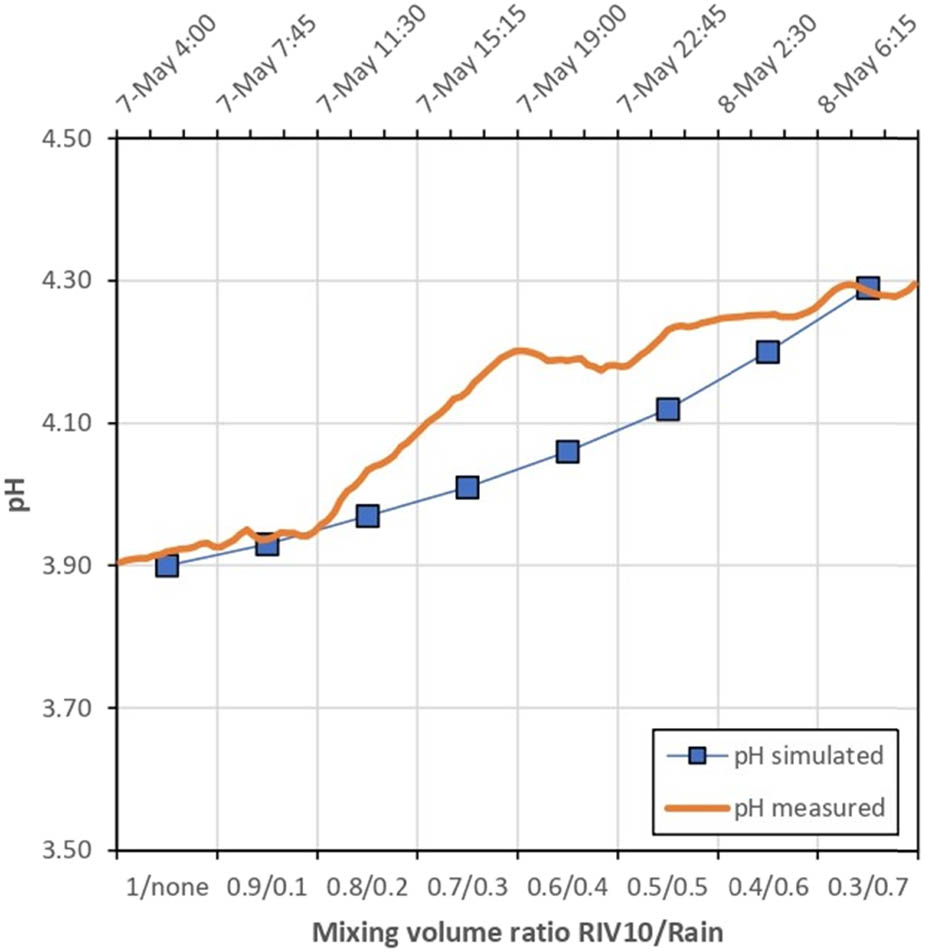
Figure 6
Measured and simulated pH patterns at the RIV10 site during a rainfall period.
The effect of rainfall on river chemistry can potentially influence the precipitation/dissolution of a mineral phase, especially when it is an unstable phase, as in the case of the formation of GR in the first stretch of the Rio Irvi, where Fe(II) still persists in solution together with Fe(III). To highlight this process, a simulation was carried out with PHREEQC. The saturation index (SI) values of GR were calculated by PHREEQC with the standard formula SI = log(IAP) – log(K sp), where IAP is the ion activity product and K sp is the solubility product constant of the mineral phase. For further information on the method used to calculate the K sp of GR, refer to Frau et al. (2015).
Figure 7 shows that, starting from the chemical composition at the RIV3 site reported in Table 1, the initial oversaturation (SI = 0.72) with respect to GR progressively shifts to saturation (SI = −0.02) and then to a marked undersaturation (SI = −1.21) when, respectively, 40 and 70% of the water flowing in the Rio Irvi is represented by rain. This process may be periodically important in contributing to the metal load discharged from the Rio Irvi and other polluted rivers to the sea (Frau et al., 2015). Indeed, a phenomenon of partial removal of Fe precipitates from the Rio Irvi bed has sometimes been observed during heavy rainfall. In that case, there is a probable concomitance of a dissolution process of riverbed precipitates, as a result of undersaturation caused by the dilution of river water with rainwater, with a physical transport of particles of riverbed precipitates, due to the increase in the flow rate of river water.
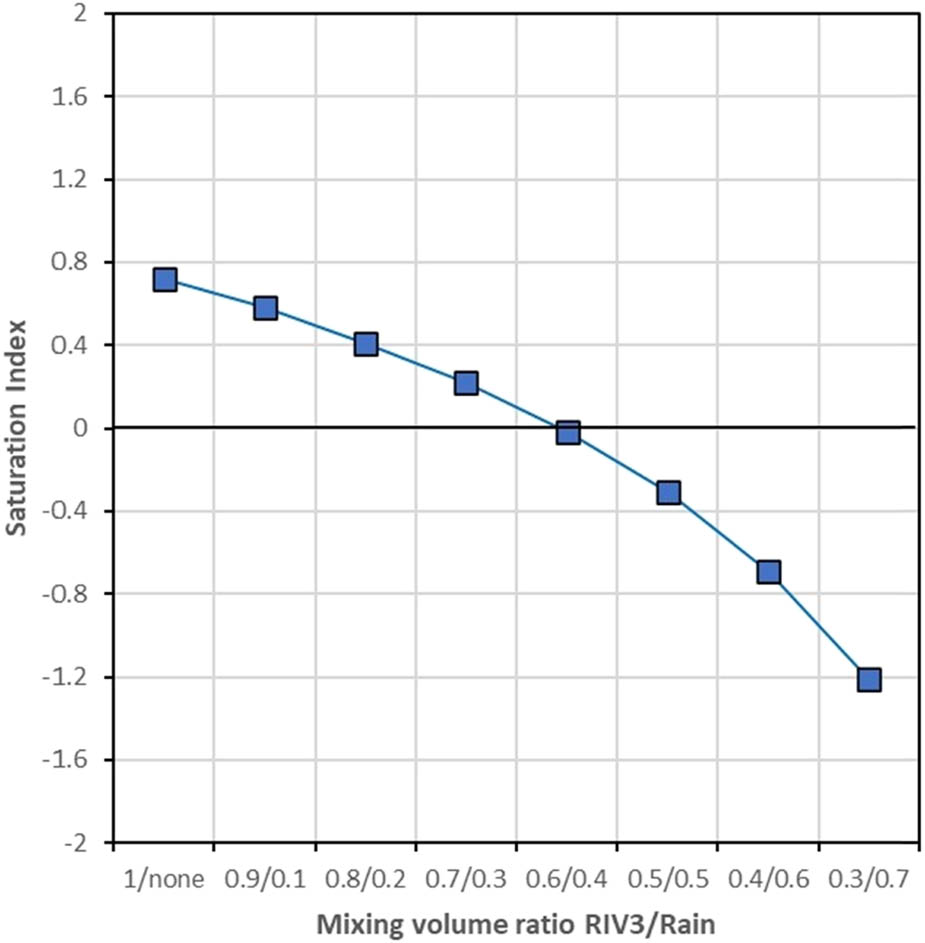
Figure 7
Simulated variation of the saturation index (SI) of sulphate green rust at the RIV3 site as a consequence of dilution due to rainfall.
It should be noted that rainfall measurements and discharge data were not part of the original monitoring design. The rainfall events discussed here are therefore interpreted primarily in terms of their hydrogeochemical effects on river water chemistry rather than as part of a hydrological rainfall-runoff analysis. In any case, previous studies (De Giudici et al., 2018; Frau et al., 2015) and an examination of the almost identical flow at the two sites, RIV3 and RIV10 (Table 1), indicate that, under dry conditions, the bed of the Rio Irvi is essentially sealed by extremely abundant muddy iron precipitates (amorphous or slightly crystalline Fe(III)-(oxy)hydroxide and sulphate green rust) that line the entire course of the river. Consequently, the inflow of groundwater from beneath the riverbed can be considered negligible, even during rainfall. On the other hand, especially during heavy rainfall, there will obviously be inflows of runoff water and, most likely, groundwater entering from the sides due to the lateral expansion of the stream network, with a consequent dilution effect on river water.
4.4. Comparative patterns at the two sampling sites
Figure 8a shows the comparative patterns of pH at the two sites, RIV3 and RIV10. The maxima and minima of the curve during the non-rainy periods at the RIV10 site are shifted forward a few hours compared to the curve at the RIV3 site. Similar shifts are also observed for T (Figure 8b) and SC (Figure 8c). As previously explained, this is mainly due to the fact that the RIV3 site is located upstream in a mountainous area, while the RIV10 site is located several kilometres downstream near the Piscinas beach.
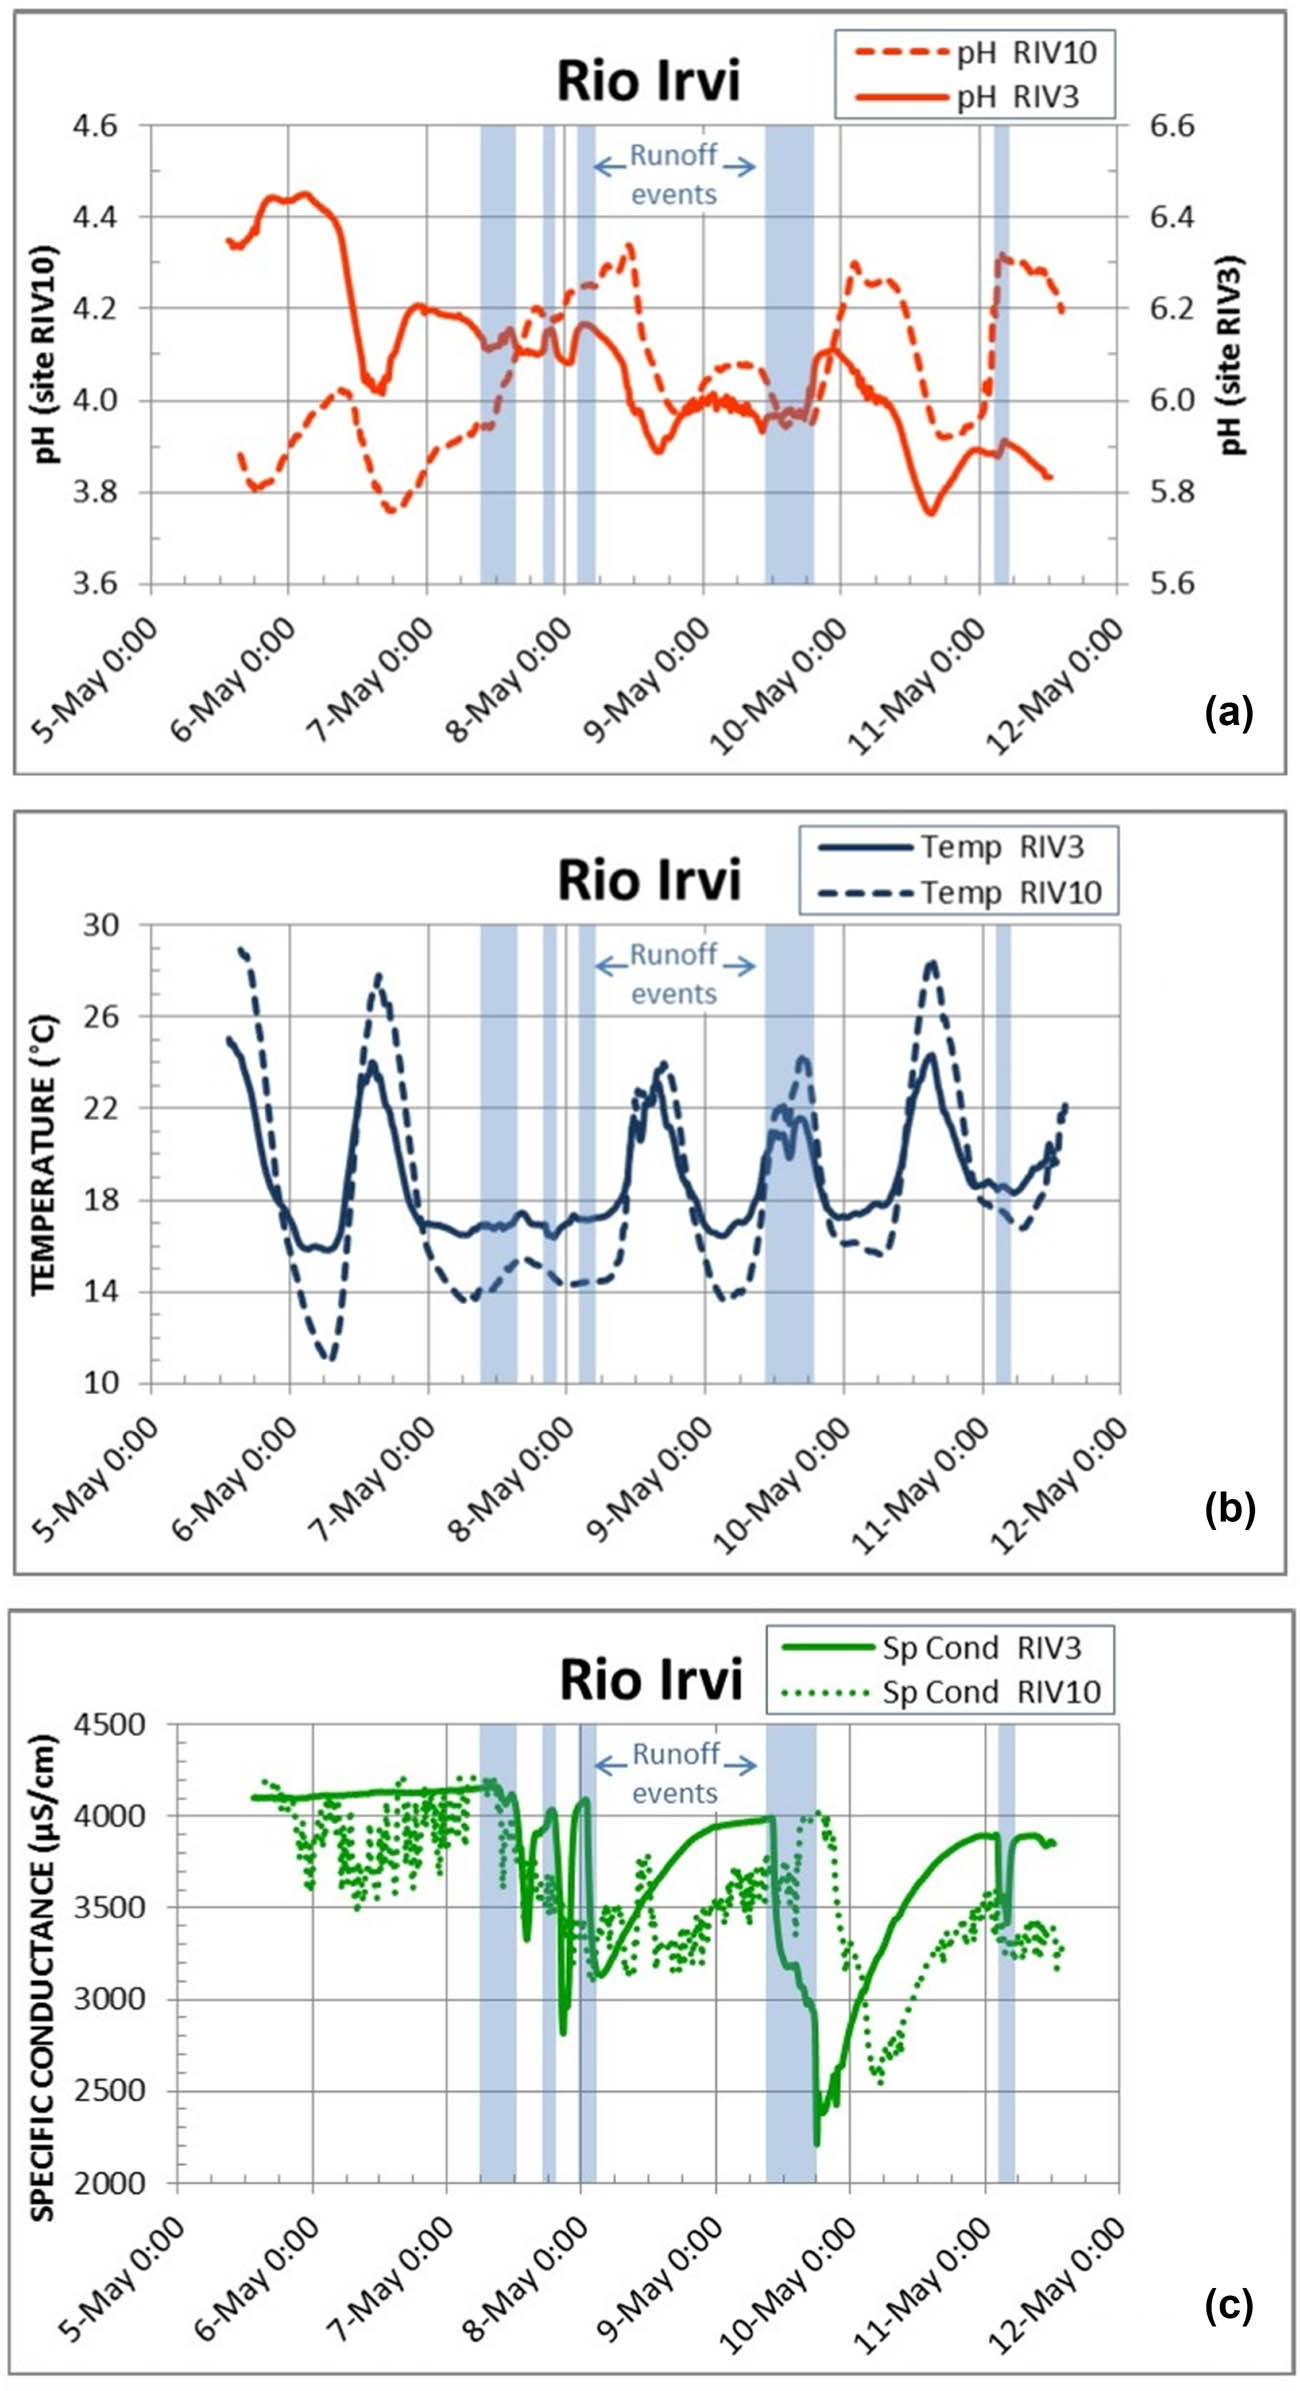
Figure 8
Comparative patterns of pH (a), temperature (b) and specific conductance (c) at the two sites RIV3 and RIV10 throughout the period of measurements with the multi-parameter sondes.
5. Conclusions
The effect of flow regime has very rarely been considered in water quality studies in mining-polluted rivers because such studies are normally carried out under stable low-flow conditions in the absence of rainfall. An interesting study conducted during rainfall runoff on a remediated stream reach (Runkel et al., 2016) demonstrated that a high release of metals was related to some hydrological mechanisms such as resuspension of streambed solids, erosion of alluvial tailings, and overland flow. Another study (Valencia-Avellan et al., 2017) simply confirmed the complexity of processes affecting the mobility of metals, particularly Pb, during rainfall events.
In this study, the unexpected occurrence of intense rainfall during a week of automated continuous measurements of temperature (T), pH and specific conductance (SC) in a mining-polluted river, finalized to investigate the diel cycles of the above-cited parameters, produced a case of serendipity applied to hydrogeochemistry. Some interesting results can be summarized as follows: (1) precipitation of a solid phase from river water (specifically the “green rust” at the near-neutral RIV3 sampling site) can be inhibited during a rainy period due to a shift from oversaturated to saturated conditions, and in cases of strong dilution of river water with rainwater, it can also result in marked undersaturated conditions that favour dissolution processes of the solid phase previously precipitated in the riverbed; (2) to raise the acidic pH of river water (specifically a pH of 3.89 at the RIV10 sampling site located several kilometres downstream of the RIV3 site) by less than 0.5 pH units requires strong dilution with rainwater (about 70 vol%); (3) the observed inverse relationship between temperature and pH highlights the importance of iron redox reactions in controlling short-term hydrogeochemical dynamics in mining-impacted rivers.
Although the present study focuses on hydrogeochemical processes observed during a short monitoring period, the results highlight the potential influence of short-term hydrological perturbations on the geochemical behaviour of mining-impacted rivers. This aspect may become increasingly relevant in regions where precipitation events are expected to become more frequent or more intense, even during periods that are not usually wet, under changing climatic conditions.
Acknowledgements
The author would like to thank the Autonomous Region of Sardinia (RAS) and the University of Cagliari (Sardinia, Italy), which, through the “Visiting Scientist” program (D.R. n.1026 of 17 July 2015), funded the project “Diel (24-h) metal cycles in the Rio Irvi, Sardinia – Quantifying short-term geochemical processes in a metal-contaminated stream to facilitate long-term remediation,” which allowed scientific collaboration with Dr. David A. Nimick (USGS researcher at the time of the project) and the collection of the data on which this article is based.
Special thanks to David A. Nimick for his teachings, collaboration on the project, and his enthusiasm and kindness. I would also like to thank the two anonymous reviewers, whose comments and suggestions have made a significant contribution to improving the manuscript, as well as the Associate Editor, Prof. Tomasz Bajda, who handled the manuscript.
Author contributions
The author confirms that he was solely responsible for the conception of the study and for the writing and revision of the manuscript.
Data collection and analyses were carried out in collaboration with the visiting scientist Dr. David A. Nimick (USGS) during his visit to the University of Cagliari in May 2016. Dr. David A. Nimick has been retired since 2017.
Conflicts of interest statement
The author declares no conflicts of interest.