
Figure 1.

Figure 2.
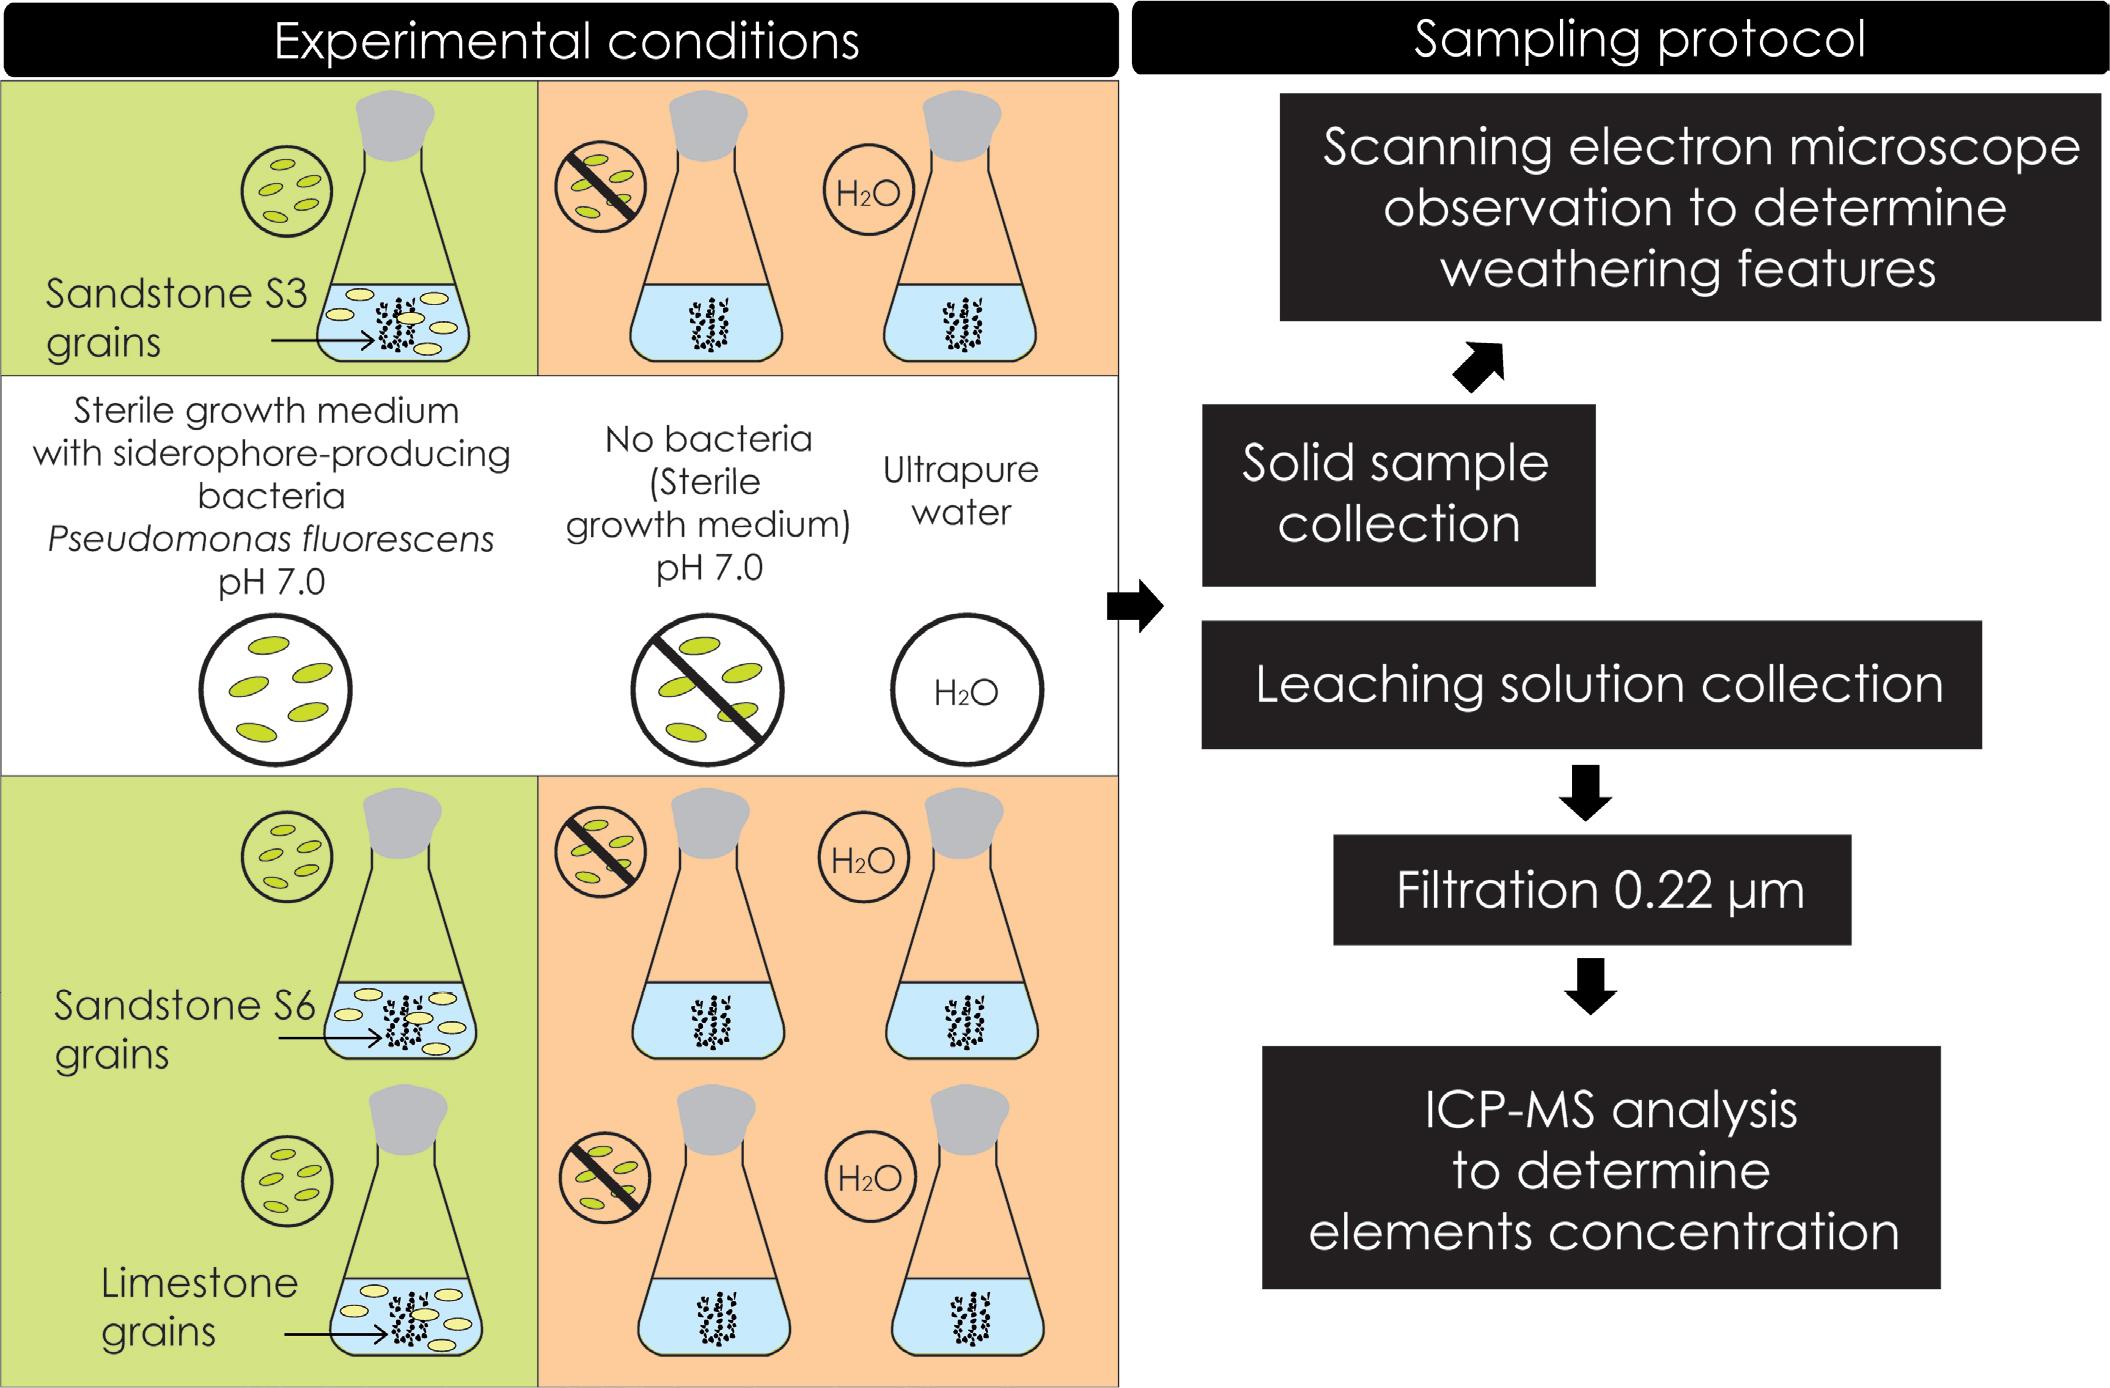
Figure 3.
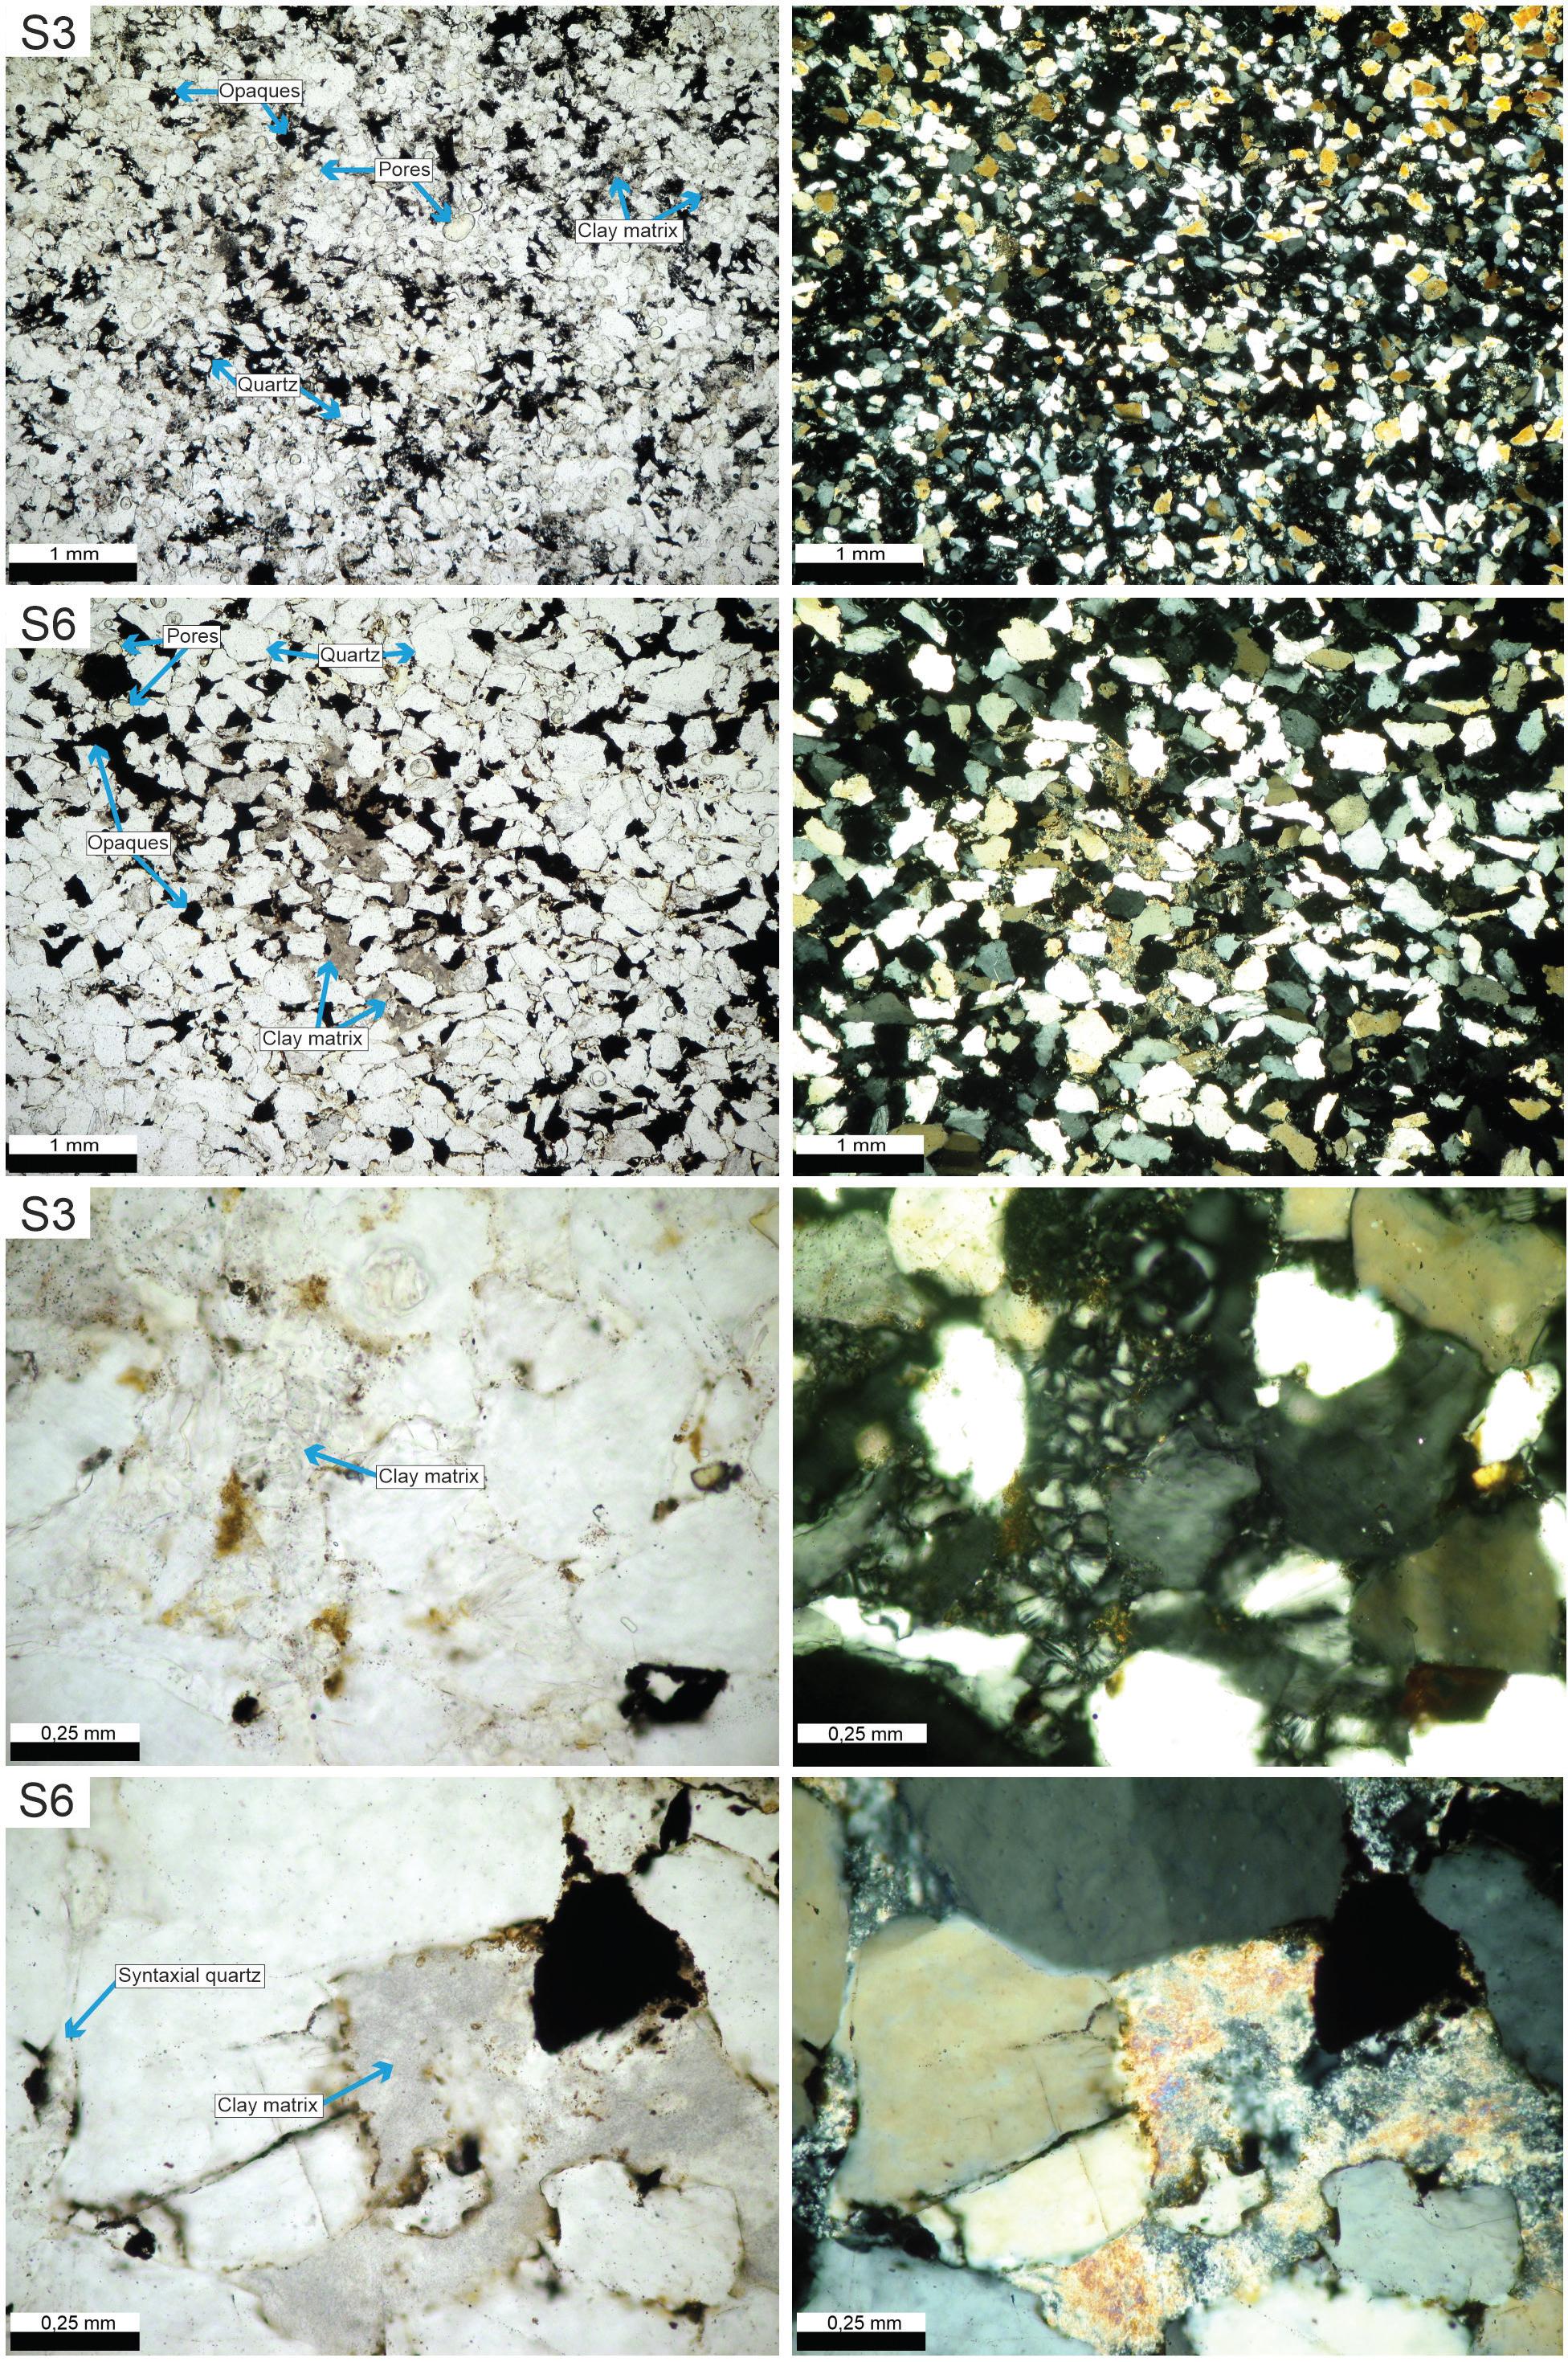
Figure 4.

Figure 5.

Figure 6.

Figure 7.

Figure 8.

Figure 9.
Specific conditions set in the incubation experiments_
| Incubation | Name | Characteristics of the constituents | Presence of bacteria | Initial pH | Final pH S3 | Final pH S6 | Final pH TL | Siderophore concentration | Proxy |
|---|---|---|---|---|---|---|---|---|---|
| Ultrapure water | WAT | none | - | 5.6 | 8.7 | 8.6 | 8.1 | - | Neutral unaggressive conditions |
| Growth medium | MED | Inorganic, organic (succinic acid) | - | 7.0 | 7.8 | 7.8 | 8.0 | - | Chemical weathering |
| Growth medium with bacteria Pseudomonas fluorescens | BAC | Inorganic, organic (succinic acid, microbially-derived compounds including siderophore) | + | 7.0 | 8.7 | 9.1 | 9.2 | S3: 45.2 μM L−1 | Biotic weathering |
Chemical composition of the studied samples_
| [Wt. %] | Sandstone S3 | Sandstone S6 | Limestone TL |
|---|---|---|---|
| SiO2 | 92.57 | 85.67 | 7.08 |
| Al2O3 | 3.12 | 0.96 | 0.54 |
| Fe2O3 | 1.18 | 7.94 | 0.33 |
| MgO | 0.07 | 0.11 | 0.51 |
| CaO | 0.07 | 1.56 | 50.22 |
| Na2O | 0.07 | 0.13 | 0.15 |
| K2O | 0.87 | 0.19 | 0.08 |
| TiO2 | 0.84 | 0.18 | 0.03 |
| LOI | 1.0 | 3.1 | 40.7 |