
Figure 1.

Figure 2.

Figure 3.
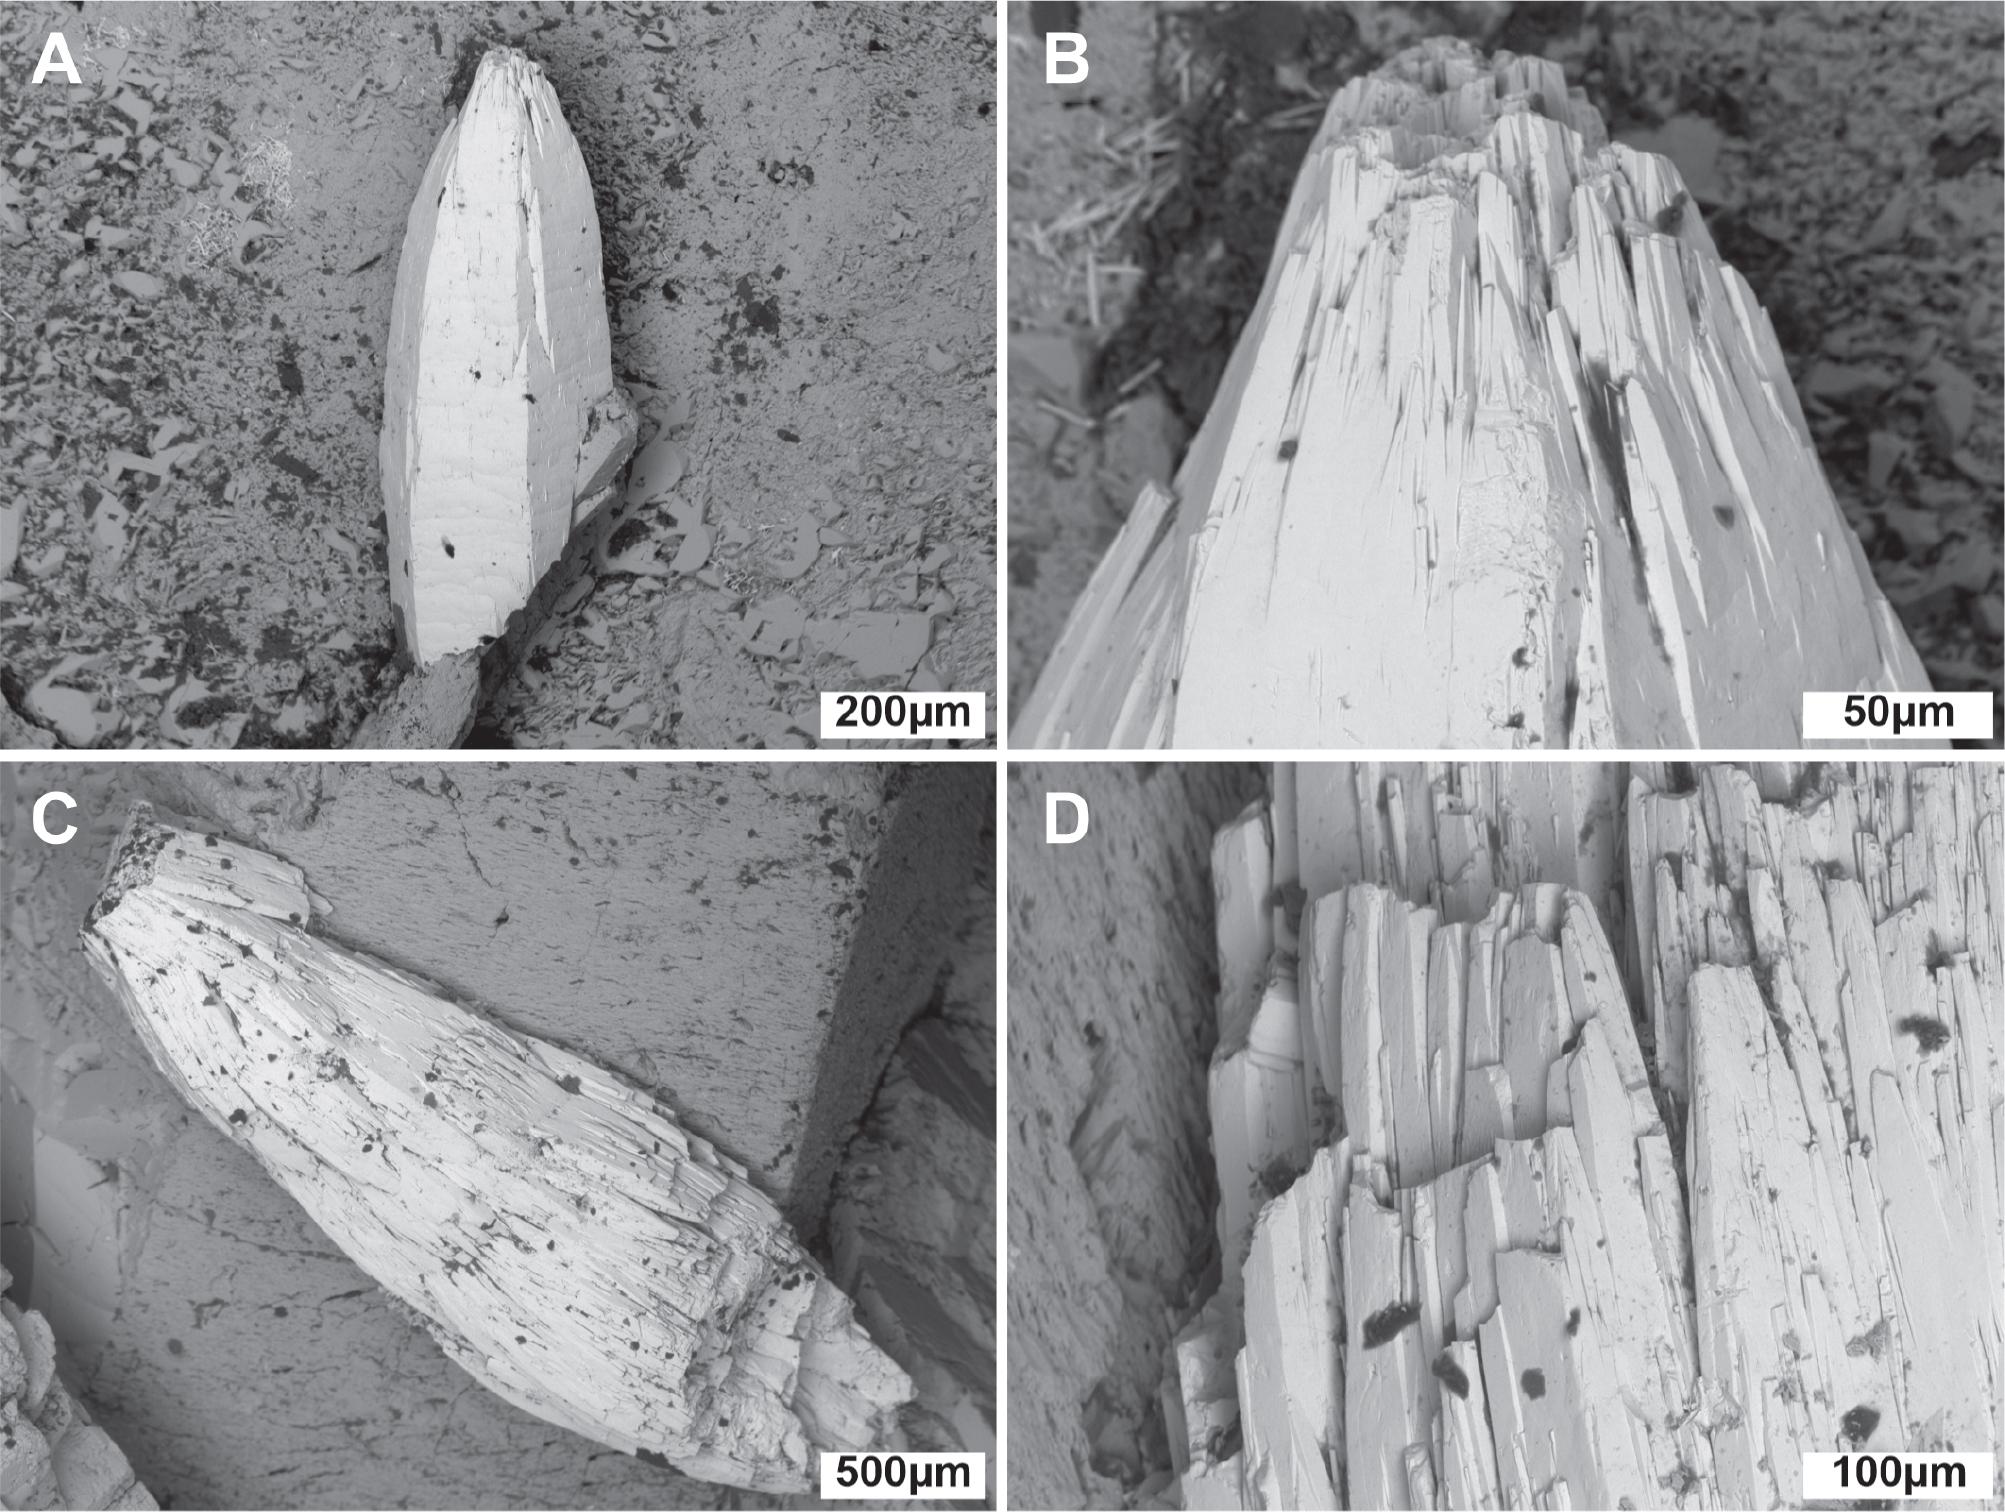
Figure 4.

Figure 5.
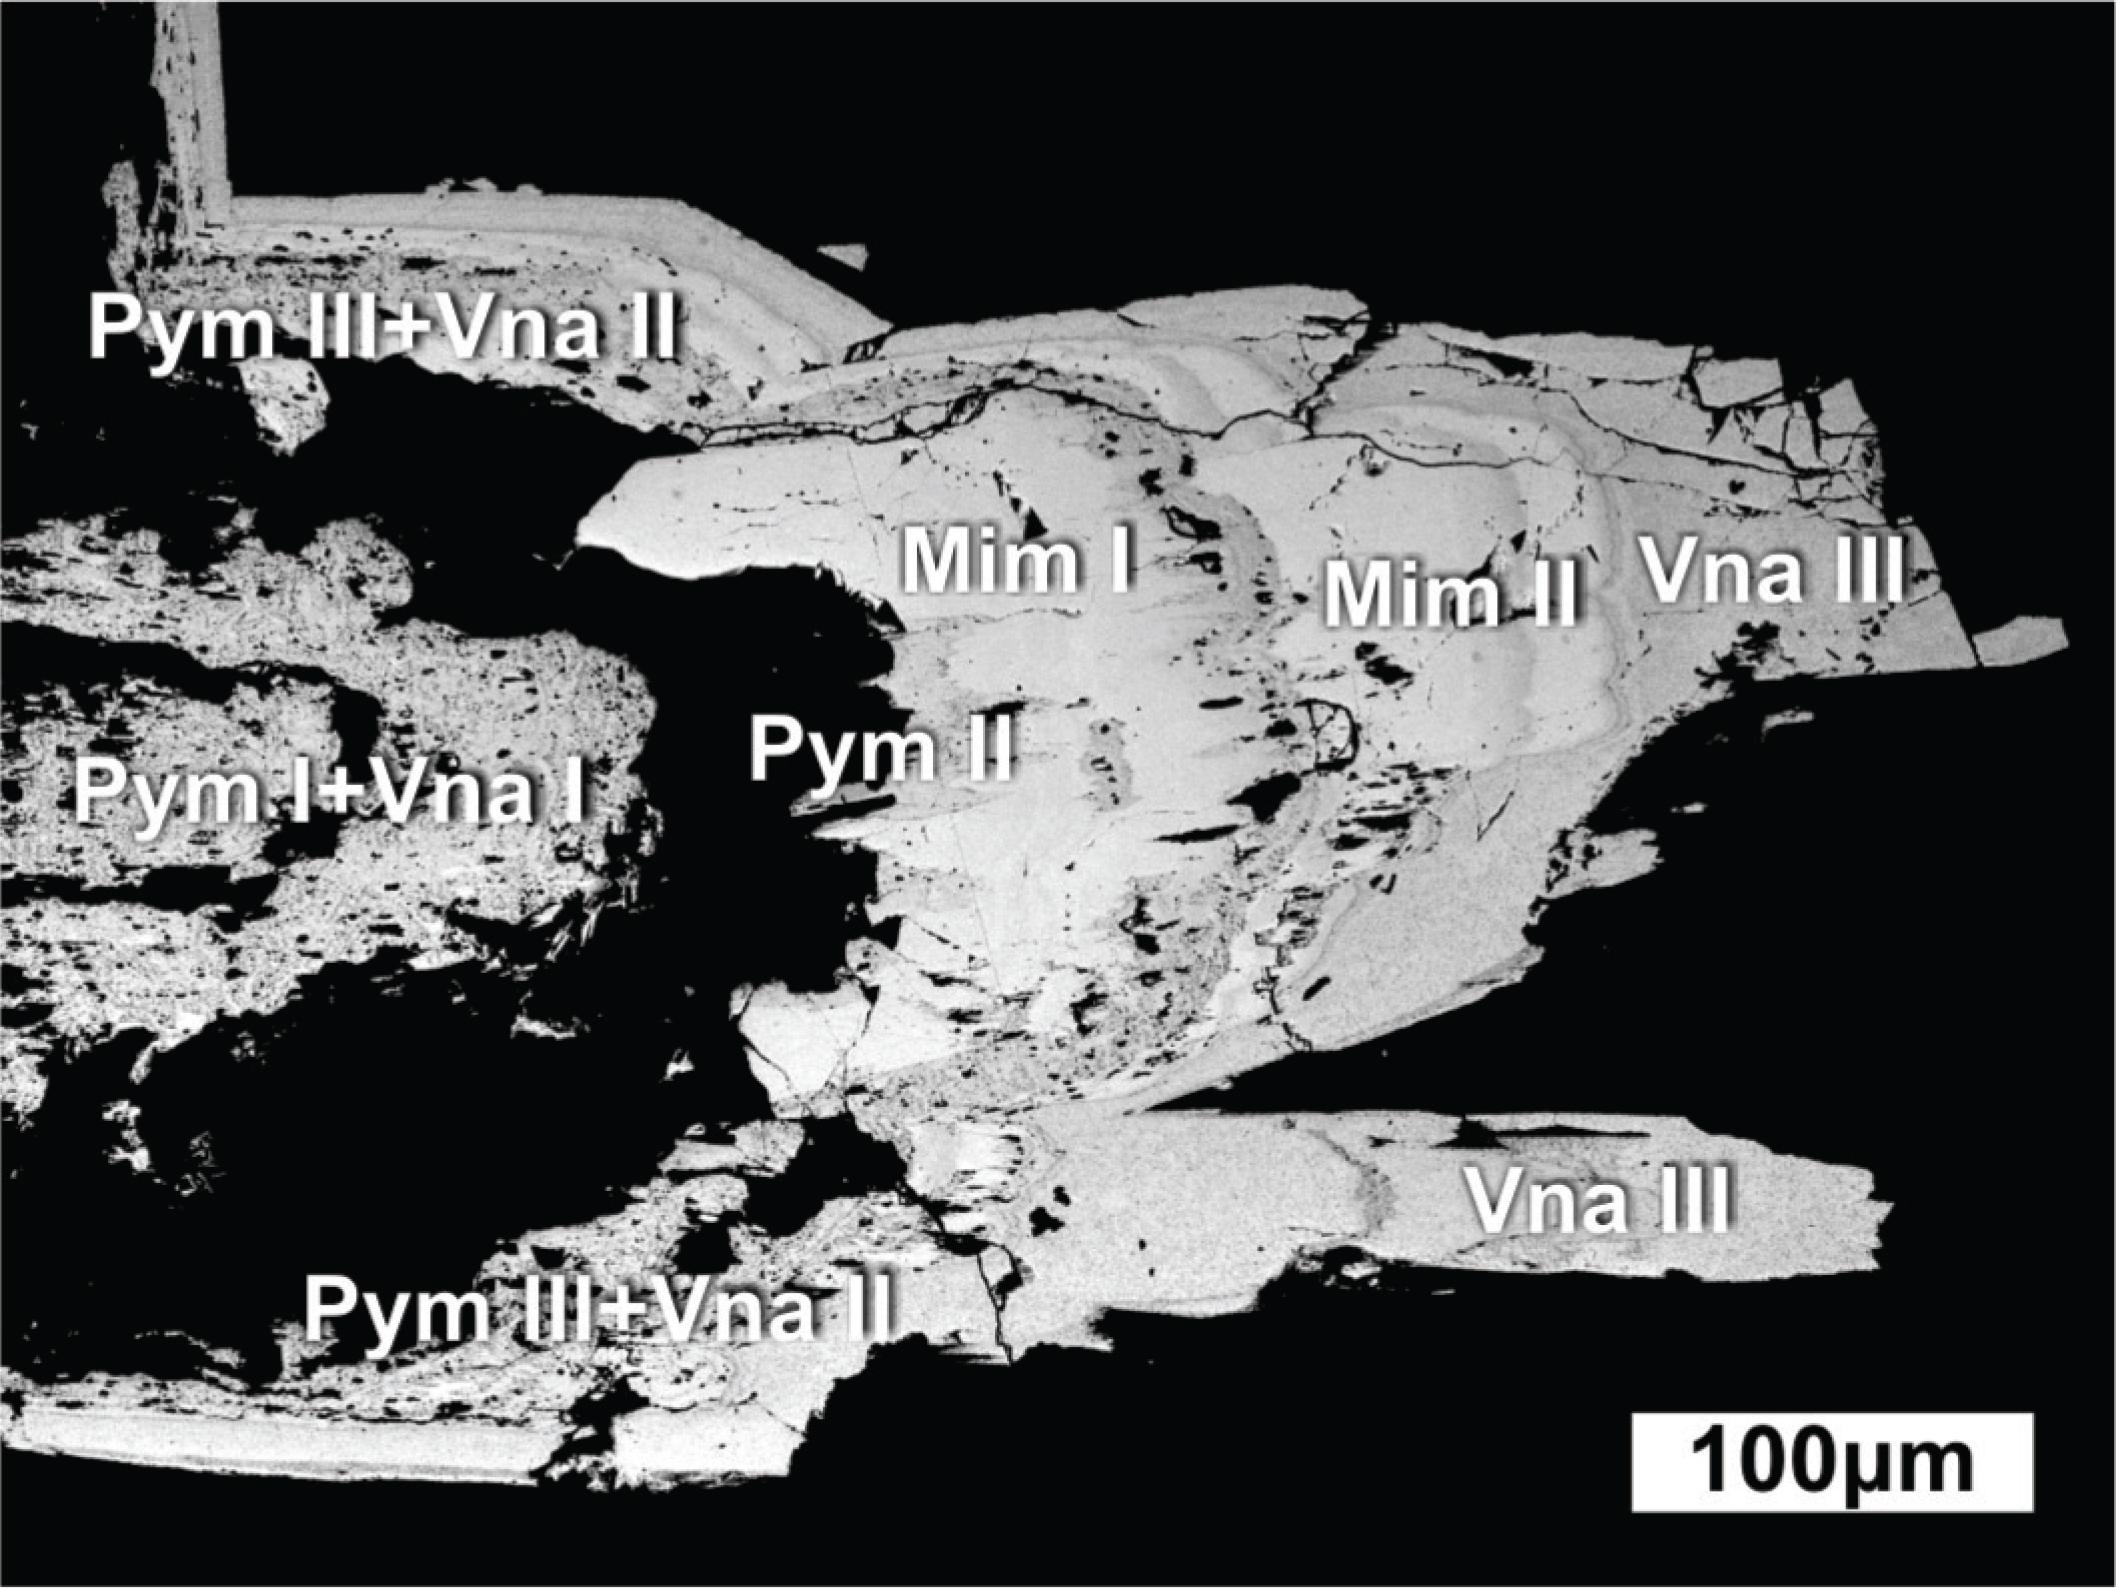
Figure 6.

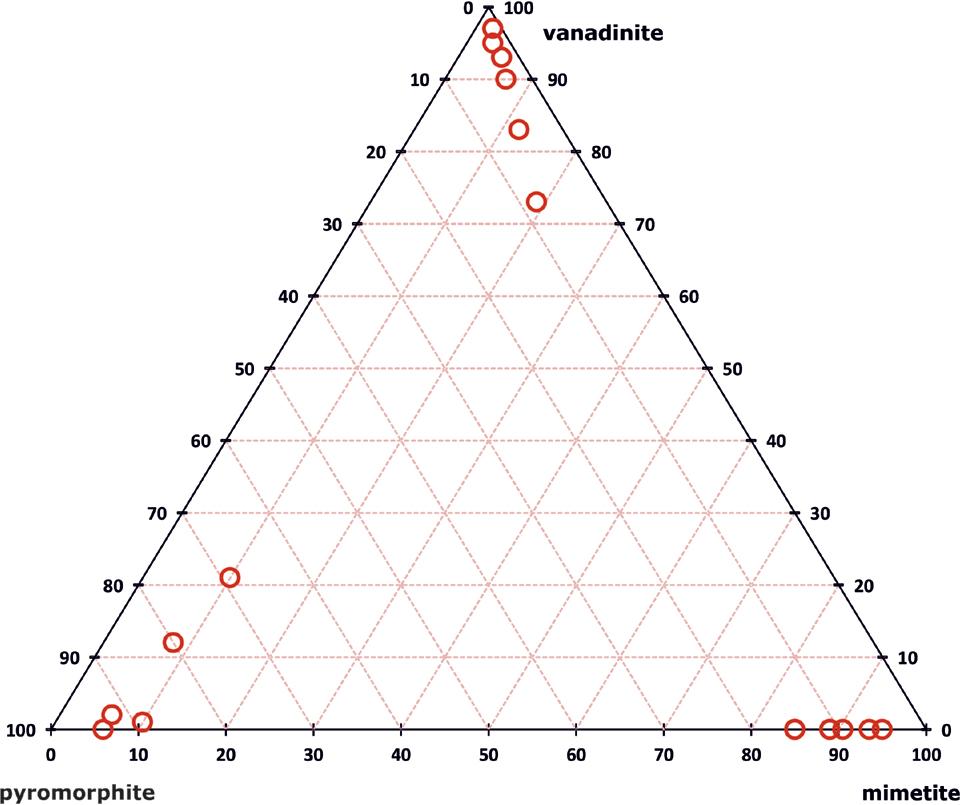
Figure 7.

Figure 8.
EPMA data for three types of mimetite crystals from Grodziszcze_
| Crystal I | Crystal II | Crystal III | |||||||
|---|---|---|---|---|---|---|---|---|---|
| interior | rim | interior | rim | sectors: | |||||
| Average* n = 4 | 1 | 2 | 3 | Average* n = 5 | 1 | 2 | 1 n = 2 | 2 n = 2 | |
| wt% | |||||||||
| SiO2 | 0.07 | 0.11 | 0.22 | 0.27 | 0.21 | 0.22 | 0.13 | 0.20 | 0.25 |
| Bi2O3 | 0.35 | 0.23 | 0.37 | 0.14 | 0.39 | 0.27 | 0.28 | 0.27 | 0.23 |
| PbO | 73.04 | 74.30 | 73.13 | 74.37 | 73.36 | 74.56 | 73.62 | 73.34 | 74.08 |
| CaO | 0.08 | 0.34 | 0.41 | 0.24 | 0.21 | 0.27 | 0.77 | 0.38 | 0.21 |
| P2O5 | 0.19 | 1.62 | 2.24 | 3.26 | 0.93 | 1.40 | 2.04 | 1.67 | 1.08 |
| As2O5 | 22.13 | 20.17 | 19.08 | 17.39 | 21.13 | 20.23 | 19.82 | 20.31 | 20.83 |
| V2O5 | 0.02 | 0.06 | 0.06 | 0.10 | 0.02 | 0.00 | 0.00 | 0.01 | 0.04 |
| SO3 | 0.06 | 0.05 | 0.15 | 0.15 | 0.07 | 0.05 | 0.05 | 0.09 | 0.04 |
| Cl | 2.28 | 2.20 | 2.32 | 2.28 | 2.23 | 2.19 | 2.24 | 2.19 | 2.21 |
| H2Oc | 0.02 | 0.05 | 0.02 | 0.03 | 0.04 | 0.05 | 0.05 | 0.06 | 0.04 |
| Total | 98.24 | 99.13 | 98.00 | 98.23 | 98.59 | 99.24 | 99.00 | 98.52 | 99.01 |
| 2Cl=O | 0.51 | 0.50 | 0.52 | 0.51 | 0.50 | 0.49 | 0.51 | 0.49 | 0.50 |
| Totalc | 97.73 | 98.63 | 97.48 | 97.72 | 98.09 | 98.75 | 98.49 | 98.03 | 98.51 |
| apfu based on 12.5 anions | |||||||||
| Bi | 0.023 | 0.015 | 0.023 | 0.009 | 0.025 | 0.027 | 0.018 | 0.017 | 0.015 |
| Pb | 4.963 | 4.933 | 4.842 | 4.913 | 4.911 | 4.977 | 4.824 | 4.843 | 4.944 |
| Ca | 0.022 | 0.090 | 0.108 | 0.063 | 0.043 | 0.069 | 0.201 | 0.100 | 0.056 |
| Σ | 5.008 | 5.038 | 4.973 | 4.985 | 4.978 | 5.063 | 5.043 | 4.960 | 5.014 |
| P | 0.041 | 0.338 | 0.466 | 0.677 | 0.196 | 0.294 | 0.420 | 0.347 | 0.227 |
| As | 2.921 | 2.601 | 2.453 | 2.231 | 2.747 | 2.623 | 2.523 | 2.605 | 2.700 |
| V | 0.003 | 0.010 | 0.010 | 0.010 | 0.003 | 0.000 | 0.000 | 0.002 | 0.007 |
| Si | 0.018 | 0.027 | 0.054 | 0.066 | 0.052 | 0.055 | 0.032 | 0.098 | 0.062 |
| S | 0.011 | 0.009 | 0.028 | 0.028 | 0.013 | 0.009 | 0.009 | 0.017 | 0.007 |
| Σ | 2.994 | 2.986 | 3.011 | 3.012 | 3.011 | 2.980 | 2.984 | 3.019 | 3.003 |
| Cl | 0.975 | 0.920 | 0.967 | 0.948 | 0.940 | 0.920 | 0.924 | 0.910 | 0.928 |
| OHc | 0.025 | 0.080 | 0.033 | 0.052 | 0.060 | 0.080 | 0.076 | 0.090 | 0.072 |
| Pym | 1 | 12 | 16 | 23 | 7 | 10 | 14 | 12 | 8 |
| Mim | 99 | 88 | 84 | 77 | 93 | 90 | 86 | 88 | 92 |
| Vna | 0 | 0 | 0 | 0 | 0 | - | - | 0 | 0 |
EPMA data for three regions within the polymineral mimetite-pyromorphite-vanadinite crystal shown in Fig_ 5_
| Regions | core | intermediate | ||||||||
|---|---|---|---|---|---|---|---|---|---|---|
| Spots: | 1 PymI +VnaI | 2 PymI +VnaI | 3 PymI +VnaI | 4 PymI +VnaI | 5 PymI +VnaI | 6 MimI | 7 MimI | 8 MimI | 9 MimI | 10 PymIII |
| wt% | ||||||||||
| SiO2 | 0.04 | 0.06 | 0.08 | 0.11 | 0.22 | 0.13 | 0.09 | 0.19 | 0.31 | 0.04 |
| Bi2O3 | 0.23 | 0.49 | 0.42 | 0.46 | 0.31 | 0.46 | 0.30 | 0.42 | 0.20 | 0.29 |
| PbO | 79.60 | 78.58 | 77.71 | 79.09 | 75.97 | 73.67 | 74.64 | 74.13 | 72.47 | 78.89 |
| CaO | 0.13 | 0.56 | 0.26 | 0.23 | 0.17 | 0.13 | 0.14 | 0.12 | 0.53 | 0.34 |
| FeO | 0.00 | 0.00 | 0.00 | 0.00 | 0.13 | 0.00 | 0.10 | 0.07 | 0.00 | 0.00 |
| ZnO | 0.00 | 0.00 | 0.14 | 0.00 | 0.00 | 0.11 | 0.00 | 0.07 | 0.00 | 0.00 |
| P2O5 | 14.23 | 13.78 | 12.20 | 10.40 | 1.13 | 0.88 | 1.52 | 0.72 | 1.34 | 14.13 |
| As2O5 | 1.44 | 1.40 | 1.91 | 2.42 | 4.37 | 20.97 | 19.88 | 20.98 | 20.61 | 1.32 |
| V2O5 | 0.11 | 0.36 | 2.27 | 4.01 | 13.65 | 0.00 | 0.07 | 0.00 | 0.00 | 0.00 |
| SO3 | 0.09 | 0.05 | 0.17 | 0.09 | 0.16 | 0.00 | 0.00 | 0.06 | 0.08 | 0.03 |
| Cl | 2.39 | 2.35 | 2.36 | 2.33 | 2.11 | 2.31 | 2.26 | 2.26 | 2.20 | 2.32 |
| H2Oc | 0.04 | 0.05 | 0.05 | 0.06 | 0.09 | 0.01 | 0.02 | 0.02 | 0.05 | 0.05 |
| Total | 98.30 | 97.68 | 97.57 | 99.20 | 98.31 | 98.67 | 99.02 | 99.04 | 97.79 | 97.41 |
| 2Cl = O | 0.54 | 0.53 | 0.53 | 0.53 | 0.48 | 0.52 | 0.51 | 0.51 | 0.50 | 0.52 |
| Totalcor | 97.76 | 97.15 | 97.04 | 98.67 | 97.83 | 98.15 | 98.51 | 98.53 | 97.29 | 96.89 |
| apfu based on 12.5 anions | ||||||||||
| Bi | 0.02 | 0.04 | 0.04 | 0.03 | 0.03 | 0.04 | 0.03 | 0.04 | 0.02 | 0.03 |
| Pb | 4.95 | 4.92 | 4.84 | 4.93 | 4.89 | 4.98 | 5.03 | 5.01 | 4.81 | 4.96 |
| Ca | 0.03 | 0.14 | 0.06 | 0.06 | 0.04 | 0.03 | 0.04 | 0.03 | 0.14 | 0.09 |
| Fe | 0.00 | 0.00 | 0.00 | 0.00 | 0.03 | 0.00 | 0.02 | 0.01 | 0.00 | 0.00 |
| Zn | 0.00 | 0.00 | 0.02 | 0.00 | 0.00 | 0.02 | 0.00 | 0.01 | 0.00 | 0.00 |
| Σ | 5.00 | 5.07 | 5.00 | 5.05 | 4.99 | 5.07 | 5.12 | 5.10 | 5.21 | 5.28 |
| P | 2.78 | 2.71 | 2.39 | 2.04 | 0.23 | 0.19 | 0.32 | 0.15 | 0.28 | 2.80 |
| As | 0.17 | 0.17 | 0.23 | 0.29 | 0.55 | 2.75 | 2.60 | 2.75 | 2.66 | 0.16 |
| V | 0.02 | 0.06 | 0.35 | 0.61 | 2.16 | 0.00 | 0.01 | 0.00 | 0.00 | 0.00 |
| Si | 0.01 | 0.01 | 0.02 | 0.03 | 0.05 | 0.03 | 0.02 | 0.05 | 0.08 | 0.01 |
| S | 0.02 | 0.01 | 0.03 | 0.02 | 0.03 | 0.00 | 0.00 | 0.01 | 0.01 | 0.01 |
| Σ | 3.00 | 2.94 | 3.01 | 2.96 | 3.02 | 2.97 | 2.91 | 2.96 | 3.19 | 3.10 |
| Cl | 0.94 | 0.93 | 0.93 | 0.91 | 0.85 | 0.98 | 0.96 | 0.96 | 0.92 | 0.92 |
| OHc | 0.06 | 0.08 | 0.07 | 0.09 | 0.15 | 0.02 | 0.04 | 0.04 | 0.08 | 0.08 |
| Pym | 94 | 92 | 80 | 69 | 8 | 6.5 | 11 | 5 | 9.5 | 95 |
| Mim | 6 | 6 | 8 | 10 | 19 | 93.5 | 89 | 95 | 90.5 | 5 |
| Vna | 0 | 2 | 12 | 21 | 73 | 0 | 0 | 0 | 0 | 0 |
| Regions | intermediate | outermost | ||||||||
| Spots: | 11 MimII | 12 MimII | 13 MimII | 14 VnaIII | 15 VnaIII | 16 VnaIII | 17 VnaIII | 18 VnaIII | 19 VnaIII | 20 VnaIII |
| SiO2 | 0.09 | 0.07 | 0.01 | 0.14 | 0.17 | 0.26 | 0.32 | 0.28 | 0.38 | 0.43 |
| Bi2O3 | 0.36 | 0.17 | 0.37 | 0.39 | 0.43 | 0.37 | 0.32 | 0.15 | 0.52 | 0.29 |
| PbO | 73.53 | 75.15 | 73.98 | 75.41 | 75.67 | 76.00 | 76.39 | 76.94 | 75.39 | 75.46 |
| CaO | 0.57 | 0.21 | 0.21 | 0.04 | 0.03 | 0.05 | 0.01 | 0.03 | 0.10 | 0.05 |
| FeO | 0.00 | 0.04 | 0.16 | 0.11 | 0.00 | 0.00 | 0.01 | 0.00 | 0.05 | 0.18 |
| ZnO | 0.00 | 0.08 | 0.16 | 0.00 | 0.00 | 0.00 | 0.01 | 0.00 | 0.05 | 0.18 |
| P2O5 | 1.40 | 2.09 | 1.59 | 0.37 | 0.26 | 0.31 | 0.20 | 0.21 | 0.70 | 0.49 |
| As2O5 | 20.59 | 19.49 | 20.25 | 1.38 | 0.93 | 1.31 | 0.55 | 0.58 | 3.10 | 1.58 |
| V2O5 | 0.11 | 0.05 | 0.08 | 19.46 | 19.11 | 18.99 | 20.09 | 19.46 | 16.81 | 17.54 |
| SO3 | 0.14 | 0.09 | 0.07 | 0.07 | 0.03 | 0.08 | 0.05 | 0.15 | 0.03 | 0.02 |
| Cl | 2.18 | 2.32 | 2.03 | 2.21 | 2.17 | 2.27 | 2.22 | 2.15 | 2.15 | 2.15 |
| H2Oc | 0.06 | 0.02 | 0.09 | 0.11 | 0.10 | 0.09 | 0.11 | 0.11 | 0.11 | 0.10 |
| Total | 99.03 | 99.78 | 99.00 | 99.69 | 98.90 | 99.73 | 100.28 | 100.06 | 99.39 | 98.37 |
| 2Cl = O | 0.49 | 0.52 | 0.46 | 0.50 | 0.49 | 0.51 | 0.49 | 0.49 | 0.49 | 0.49 |
| Totalcor | 98.54 | 99.26 | 98.54 | 99.19 | 98.41 | 99.22 | 99.79 | 99.57 | 98.90 | 97.88 |
| apfu based on 12.5 anions | ||||||||||
| Bi | 0.03 | 0.02 | 0.03 | 0.03 | 0.04 | 0.03 | 0.03 | 0.01 | 0.05 | 0.03 |
| Pb | 4.84 | 4.96 | 4.91 | 4.55 | 4.69 | 4.64 | 4.61 | 4.70 | 4.63 | 4.72 |
| Ca | 0.15 | 0.06 | 0.06 | 0.01 | 0.01 | 0.01 | 0.00 | 0.01 | 0.02 | 0.01 |
| Fe | 0.00 | 0.01 | 0.03 | 0.02 | 0.00 | 0.00 | 0.00 | 0.00 | 0.01 | 0.04 |
| Zn | 0.00 | 0.01 | 0.03 | 0.00 | 0.00 | 0.00 | 0.00 | 0.00 | 0.01 | 0.03 |
| Σ | 4.87 | 5.06 | 5.06 | 4.61 | 4.74 | 4.68 | 4.64 | 4.72 | 4.72 | 4.83 |
| P | 0.29 | 0.43 | 0.33 | 0.07 | 0.05 | 0.06 | 0.04 | 0.04 | 0.14 | 0.10 |
| As | 2.63 | 2.50 | 2.61 | 0.16 | 0.11 | 0.16 | 0.06 | 0.07 | 0.37 | 0.19 |
| V | 0.02 | 0.01 | 0.01 | 2.88 | 2.91 | 2.85 | 2.97 | 2.92 | 2.53 | 2.70 |
| Si | 0.02 | 0.02 | 0.00 | 0.03 | 0.04 | 0.06 | 0.07 | 0.06 | 0.09 | 0.10 |
| S | 0.03 | 0.02 | 0.01 | 0.01 | 0.01 | 0.01 | 0.01 | 0.04 | 0.01 | 0.00 |
| Σ | 2.99 | 2.98 | 2.96 | 3.15 | 3.12 | 3.14 | 3.15 | 3.13 | 3.14 | 3.09 |
| Cl | 0.90 | 0.96 | 0.85 | 0.84 | 0.85 | 0.87 | 0.84 | 0.83 | 0.83 | 0.85 |
| OHc | 0.10 | 0.04 | 0.15 | 0.16 | 0.15 | 0.13 | 0.16 | 0.17 | 0.17 | 0.15 |
| Pym | 15 | 15 | 11 | 2 | 2 | 2 | 1 | 1.3 | 5 | 3 |
| Mim | 85 | 85 | 89 | 5 | 3 | 5 | 2 | 2.3 | 12 | 7 |
| Vna | 0 | 0 | 0 | 93 | 95 | 93 | 97 | 96.4 | 83 | 90 |