
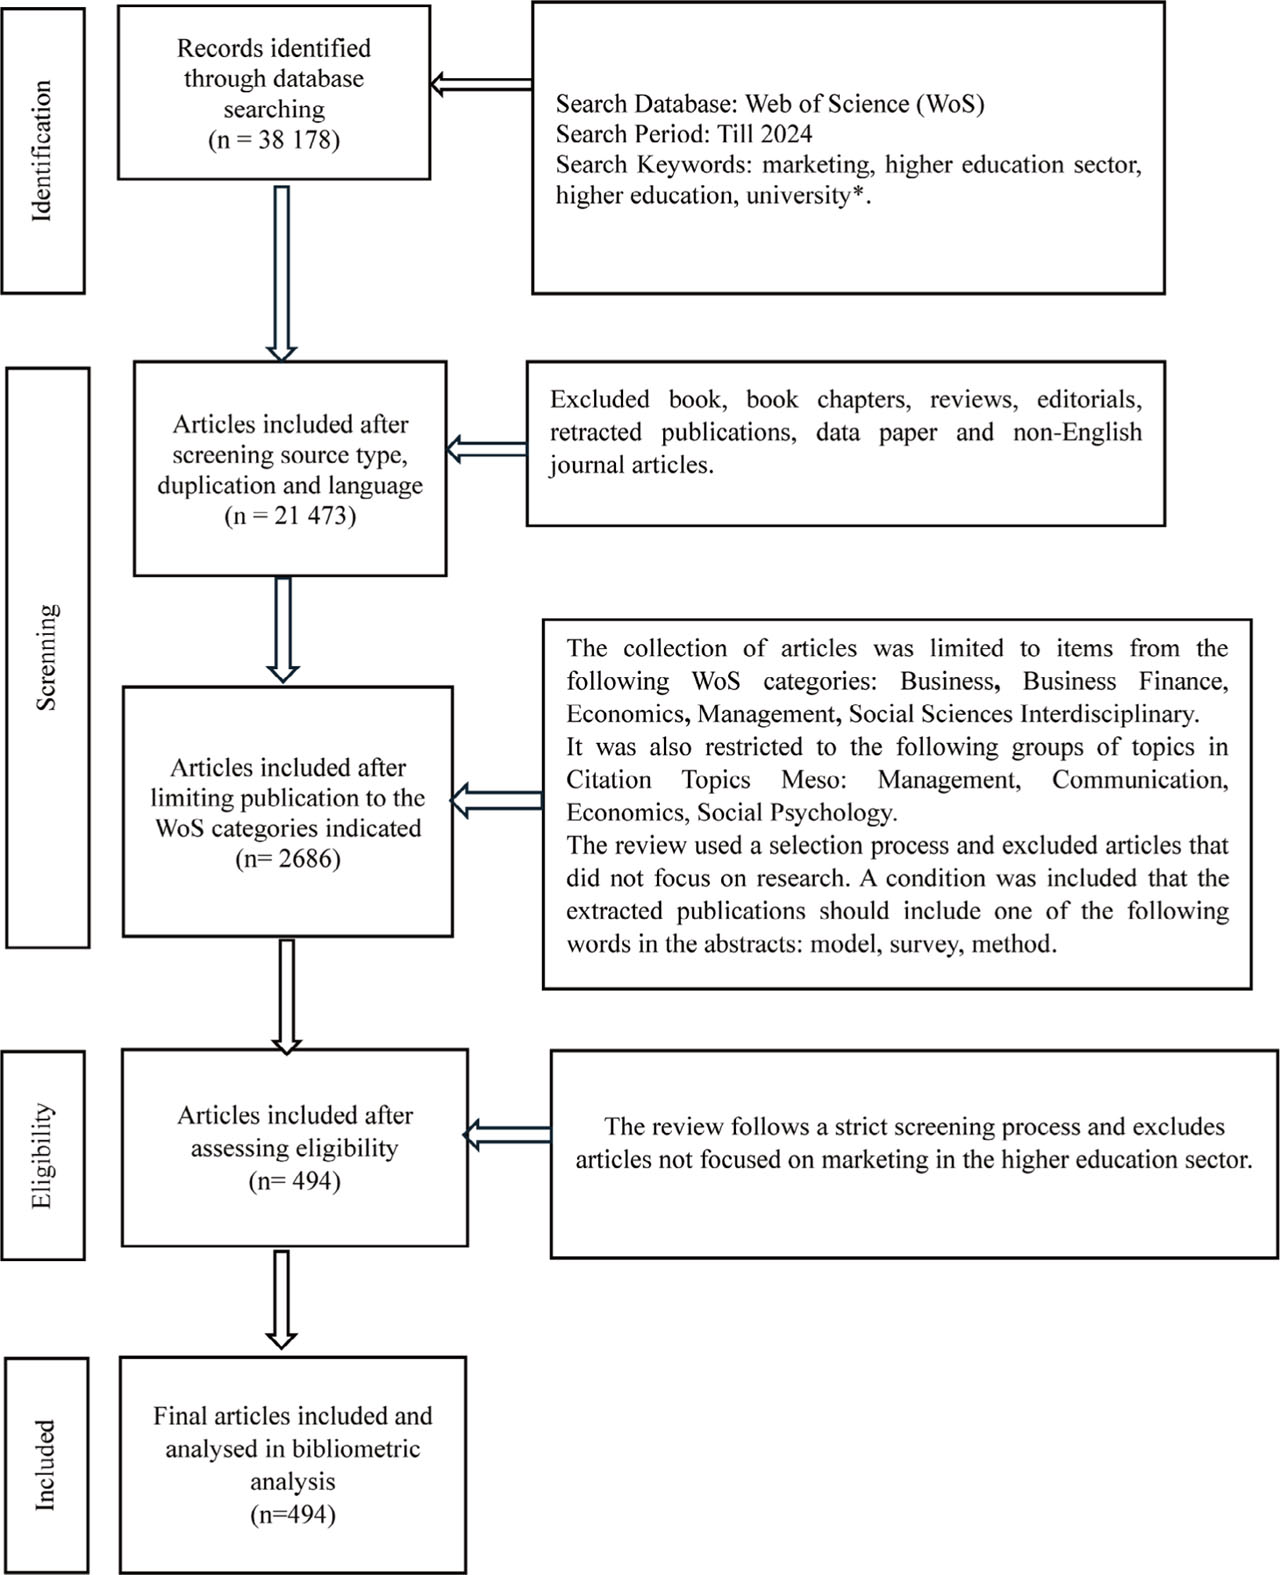
Figure 1.
Stages reflecting the literature search and selection process (PRISMA protocol).
Source: based on Moher et al. (2009).
Table 1.
Basic information on the generated set of documents.
| Description | Results | Description | Results |
|---|---|---|---|
| MAIN INFORMATION ABOUT DATA | DOCUMENT CONTENTS | ||
| Timespan | 1999–2024 | Keywords Plus (ID) | 766 |
| Sources (Journals, Books, etc.) | 207 | Author’s Keywords (DE) | 1361 |
| Documents | 494 | AUTHORS | |
| Annual Growth Rate % | 10.8 | Authors | 1134 |
| Document Average Age | 7 | Authors of single-authored docs | 78 |
| Average citations per doc | 16.36 | AUTHORS COLLABORATION | |
| References | 20969 | Single-authored docs | 87 |
| Co-Authors per Doc | 2.69 | ||
| International co-authorships % | 27.33 | ||
Table 2.
Basic information on the generated set of documents and the identified sub-periods.
| Description | 1st period | 2nd period | 3rd period | 4th period |
|---|---|---|---|---|
| Timespan | 1999–2009 | 2010–2014 | 2015–2019 | 2020–2024 |
| Sources (journals, book, etc) | 15 | 52 | 104 | 80 |
| Documents | 42 | 99 | 177 | 176 |
| Average Growth Rate (%) | 17.46 | 9.78 | 20.9 | −6.49 |
| Average citations per doc | 36.64 | 23.42 | 17.38 | 6.523 |
| References | 1813 | 4218 | 7854 | 10160 |
| Keywords Plus (ID) | 85 | 201 | 389 | 455 |
| Author’s Keywords | 123 | 350 | 573 | 627 |
| Authors | 91 | 208 | 440 | 508 |
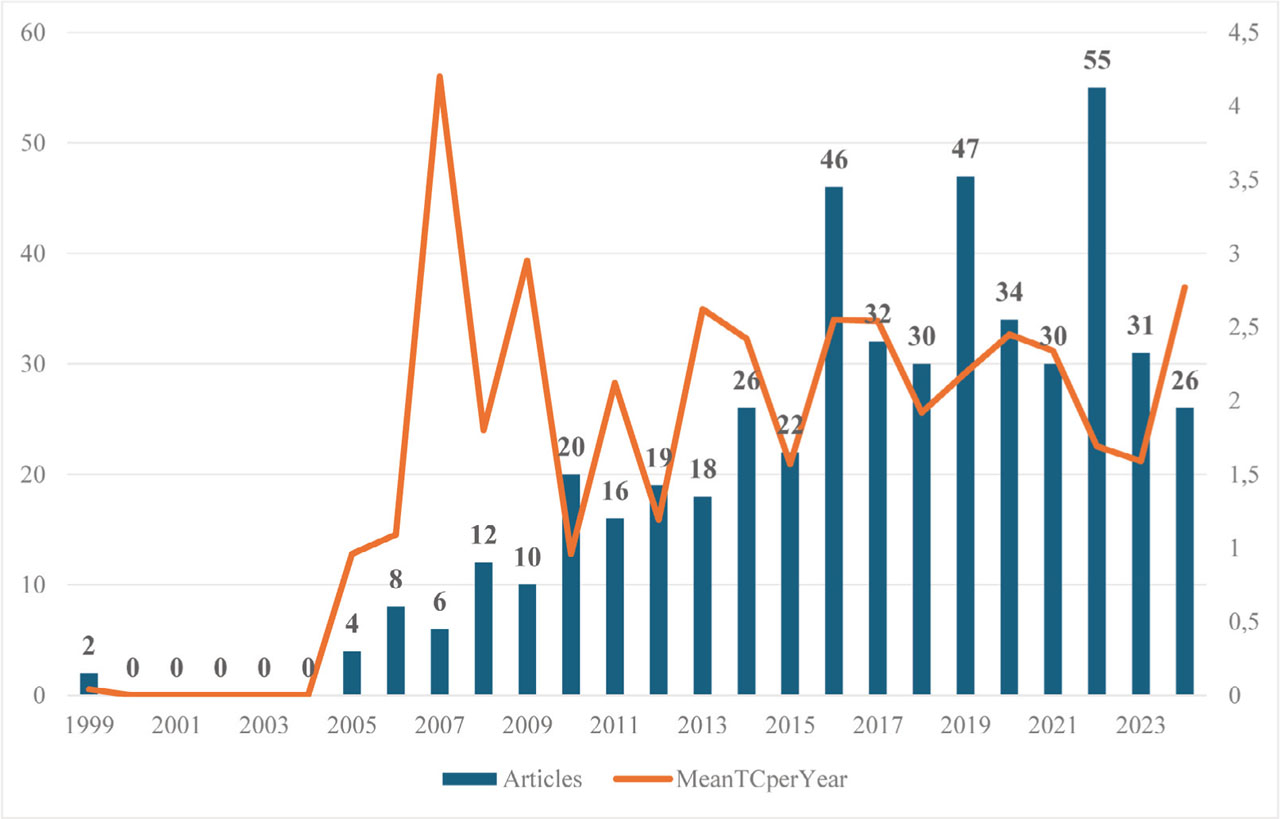
Figure 2.
Number of publications on marketing research in higher education activities in the WoS database over the period 1991–2024. Source: based on bibliometric analysis in Biblioshiny.
Table 3.
Relevance of higher education marketing journals.
| Source | Articles | h_index | g_index | m_index | TC | PY_start | Bradford’s Law Zone | |
|---|---|---|---|---|---|---|---|---|
| 1 | Journal of Marketing for Higher Education | 132 | 30 | 47 | 1.50 | 2819 | 2005 | Zone 1 (core) |
| 2 | International Journal of Educational Management | 34 | 15 | 23 | 0.75 | 596 | 2005 | Zone 1 (core) |
| 3 | Asia Pacific Journal of Marketing and Logistics | 11 | 11 | 11 | 0.58 | 392 | 2006 | Zone 2 |
| 4 | Journal of Business Research | 11 | 11 | 11 | 0.61 | 844 | 2007 | Zone 2 |
| 5 | Journal of Marketing Management | 5 | 5 | 5 | 0.36 | 151 | 2011 | Zone 2 |
Table 4.
The 5 most influential authors of publications on marketing in higher education.
| Author | h_index | g_index | m_index | TC | NP | PY_start | |
|---|---|---|---|---|---|---|---|
| 1 | Chris Chapleo | 5 | 6 | 0,36 | 114 | 6 | 2011 |
| 2 | Tamer Elsharnouby | 5 | 6 | 0,50 | 164 | 6 | 2015 |
| 3 | Emmanuel Mogaji | 4 | 5 | 0,44 | 60 | 5 | 2016 |
| 4 | Norazlyn Kamal Basha | 3 | 3 | 0,30 | 34 | 3 | 2015 |
| 5 | Riza Casidy | 3 | 3 | 0,25 | 74 | 3 | 2013 |
Table 5.
The 10 most cited publications in the research area analysed.
| Publication | Local Citations | Global Citations | |
|---|---|---|---|
| 1 | Hemsley-Brown, J., & Goonawardana, S. (2007). Brand harmonization in the international higher education market. | 42 | 158 |
| 2 | Bennett, R., & Ali-Choudhury, R. (2009). Prospective students’ perceptions of university brands: An empirical study | 31 | 91 |
| 3 | Helgesen, Ø. (2008). Marketing for higher education: A relationship marketing approach | 25 | 103 |
| 4 | Lowrie, A. (2007). Branding higher education: Equivalence and difference in developing identity | 24 | 76 |
| 5 | Mourad, M., Ennew, C., & Kortam, W. (2011). Brand equity in higher education | 23 | 88 |
| 6 | Constantinides, E., & Zinck Stagno, M. C. (2011). Potential of the social media as instruments of higher education marketing: A segmentation study | 21 | 121 |
| 7 | Clark, M., Fine, M. B., & Scheuer, C. L. (2017). Relationship quality in higher education marketing: the role of social media engagement | 21 | 83 |
| 8 | Paswan, A. K., & Ganesh, G. (2009). Higher education institutions: Satisfaction and loyalty among international students | 20 | 77 |
| 9 | Rauschnabel, P. A., Krey, N., Babin, B. J., & Ivens, B. S. (2016). Brand management in higher education: the university brand personality scale | 20 | 117 |
| 10 | Peruta, A., & Shields, A. B. (2017). Social media in higher education: understanding how colleges and universities use Facebook | 20 | 110 |
Table 6.
The 15 most frequently occurring author keywords.
| Keywords | Frequency of occurrence | Keywords | Frequency of occurrence | ||
|---|---|---|---|---|---|
| 1 | brand | 96 | 9 | value | 25 |
| 2 | student satisfaction | 75 | 10 | marketing communication | 17 |
| 3 | image | 50 | 11 | market orientation | 16 |
| 4 | social media | 44 | 12 | marketing strategy | 16 |
| 5 | service quality | 39 | 13 | internal marketing | 14 |
| 6 | student loyalty | 29 | 14 | trust | 12 |
| 7 | relationship marketing | 26 | 15 | WoM (word of mouth) | 11 |
| 8 | digital marketing | 25 |
Table 7.
Evolution of research topics on marketing in higher education.
| 1999–2009 | 2010–2014 | 2015–2019 | 2020–2024 | |
|---|---|---|---|---|
| Dominant research themes identified |
|
|
|
|
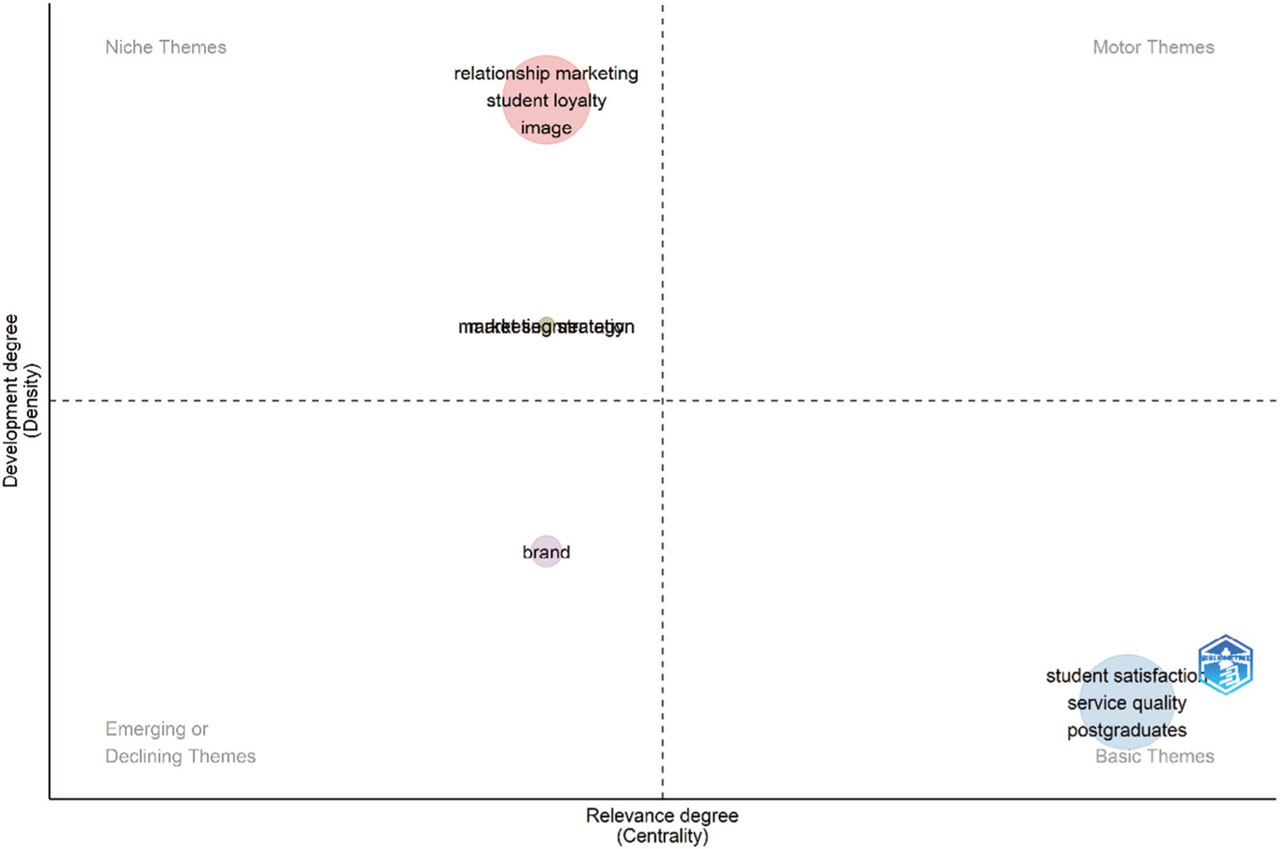
Figure 3.
Thematic map for the period 1999–2009. Source: based on bibliometric analysis in Biblioshiny.
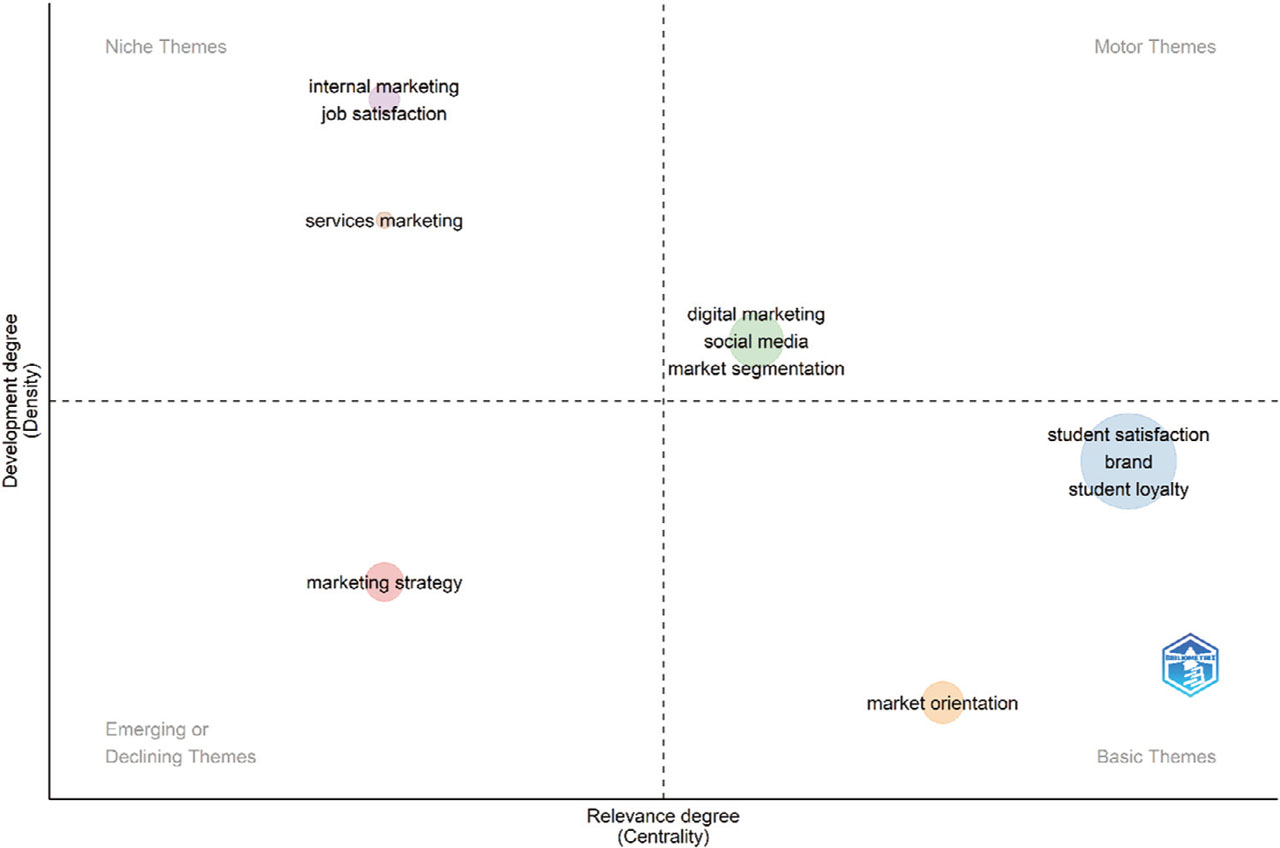
Figure 4.
Thematic map for the period 2010–2014. Source: based on bibliometric analysis in Biblioshiny.
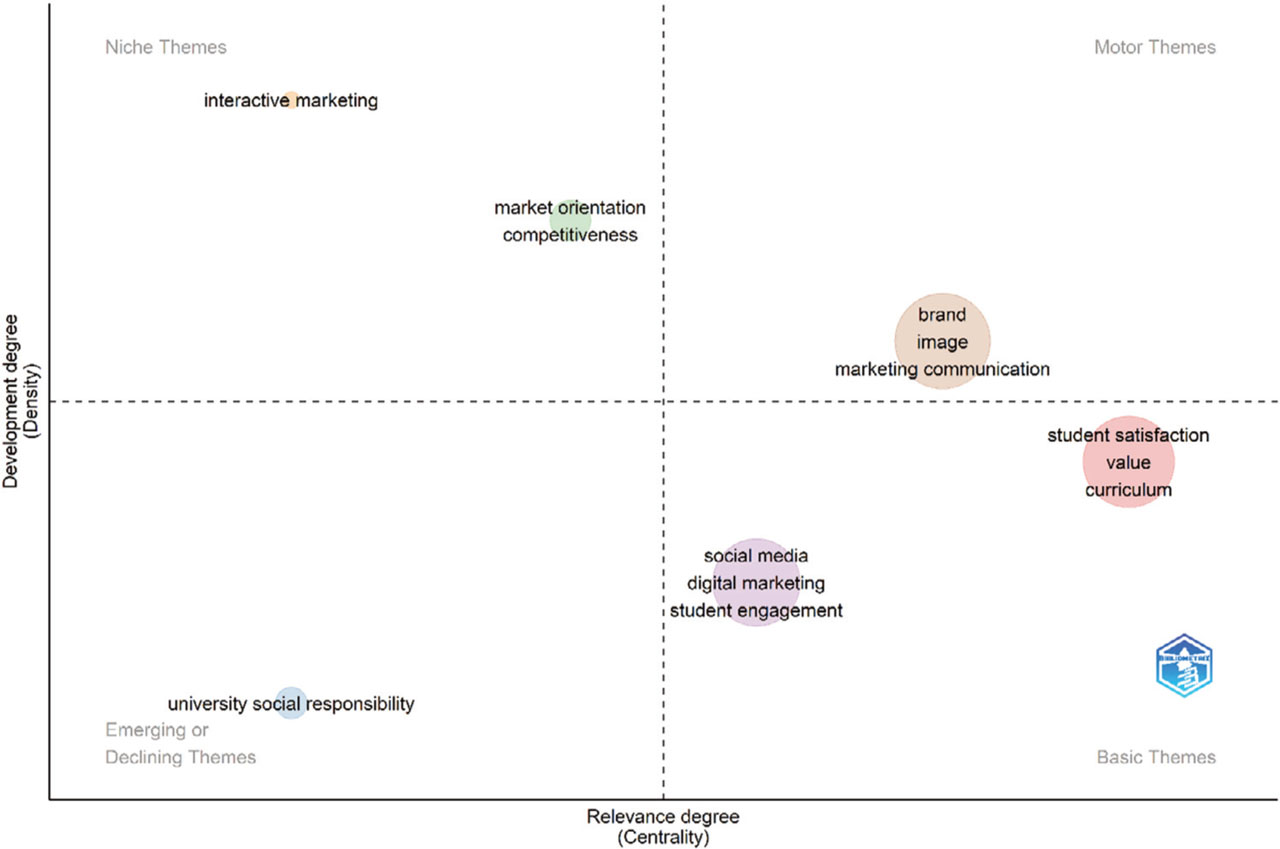
Figure 5.
Thematic map for the period 2015–2019. Source: based on bibliometric analysis in Biblioshiny.
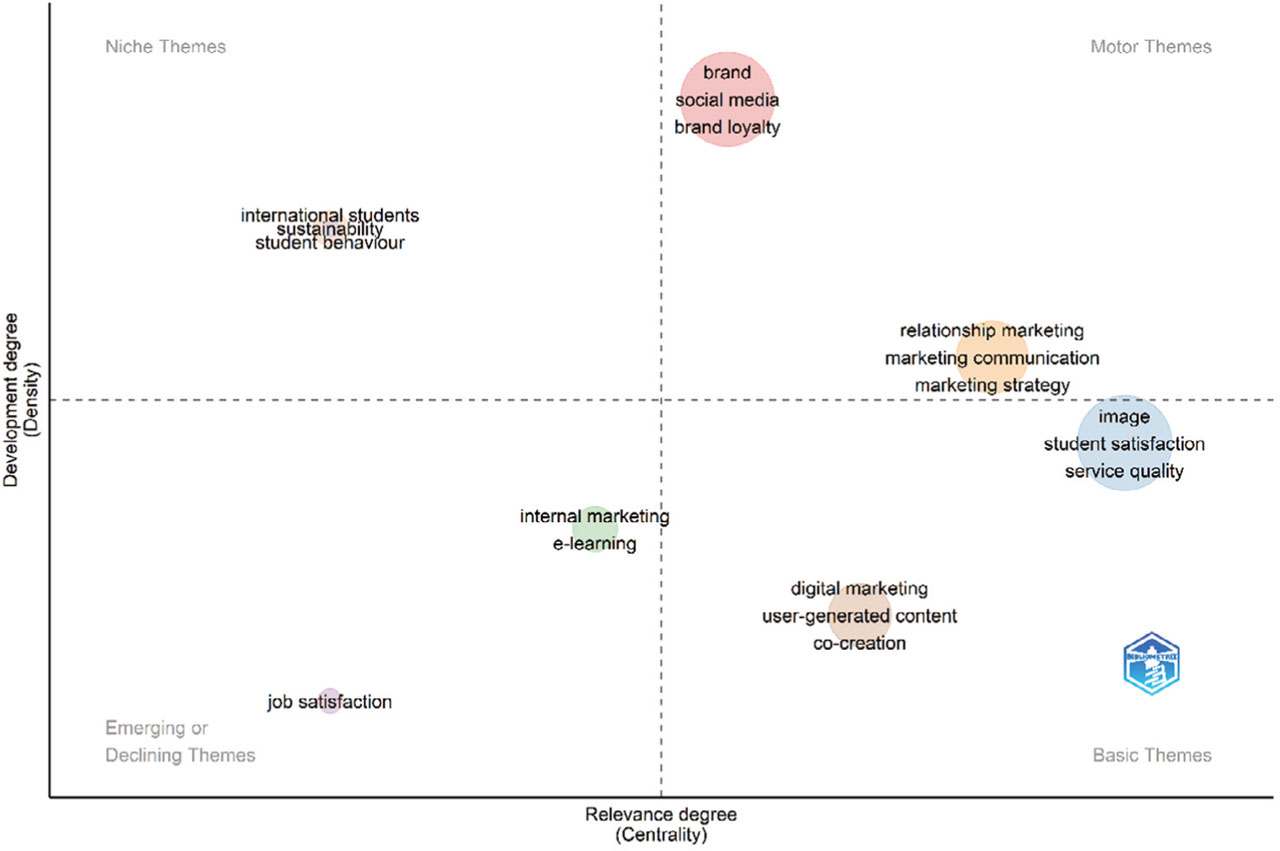
Figure 6.
Thematic map for the period 2020–2024. Source: based on bibliometric analysis in Biblioshiny.
Table 8.
Summary of Citation Analysis and Research Topics Identified in the Field of “Marketing in Higher Education”.
| Basic Data | Citation Analysis | Identification of Research Topics by Period |
|---|---|---|
|
|
|