
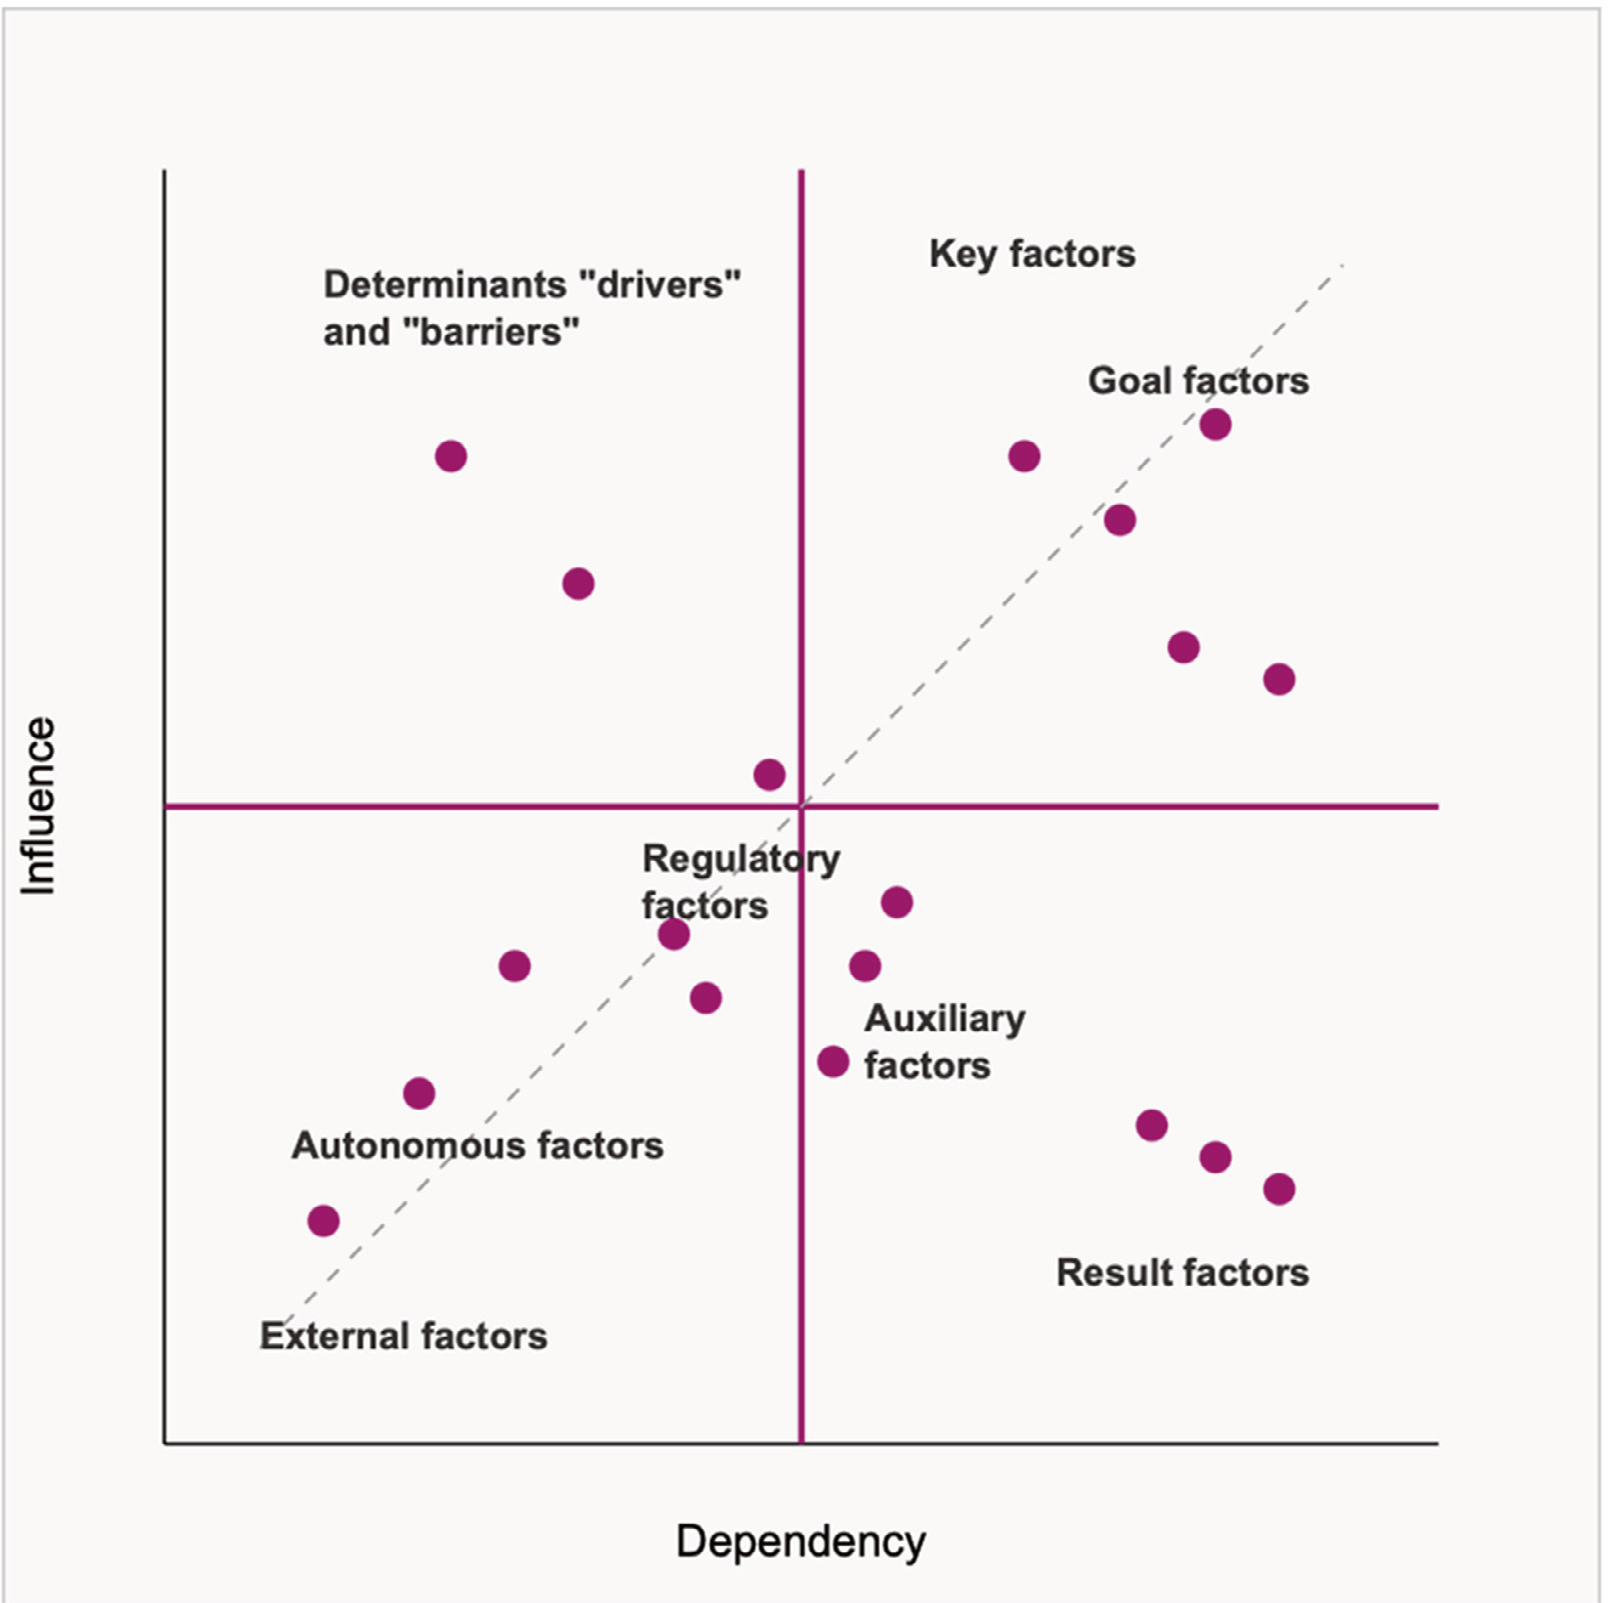
Figure 1.
The arrangement of factors influencing a research area: an example output of structural analysis.
Source: based on figure in Nazarko et al. (2011, p. 16).
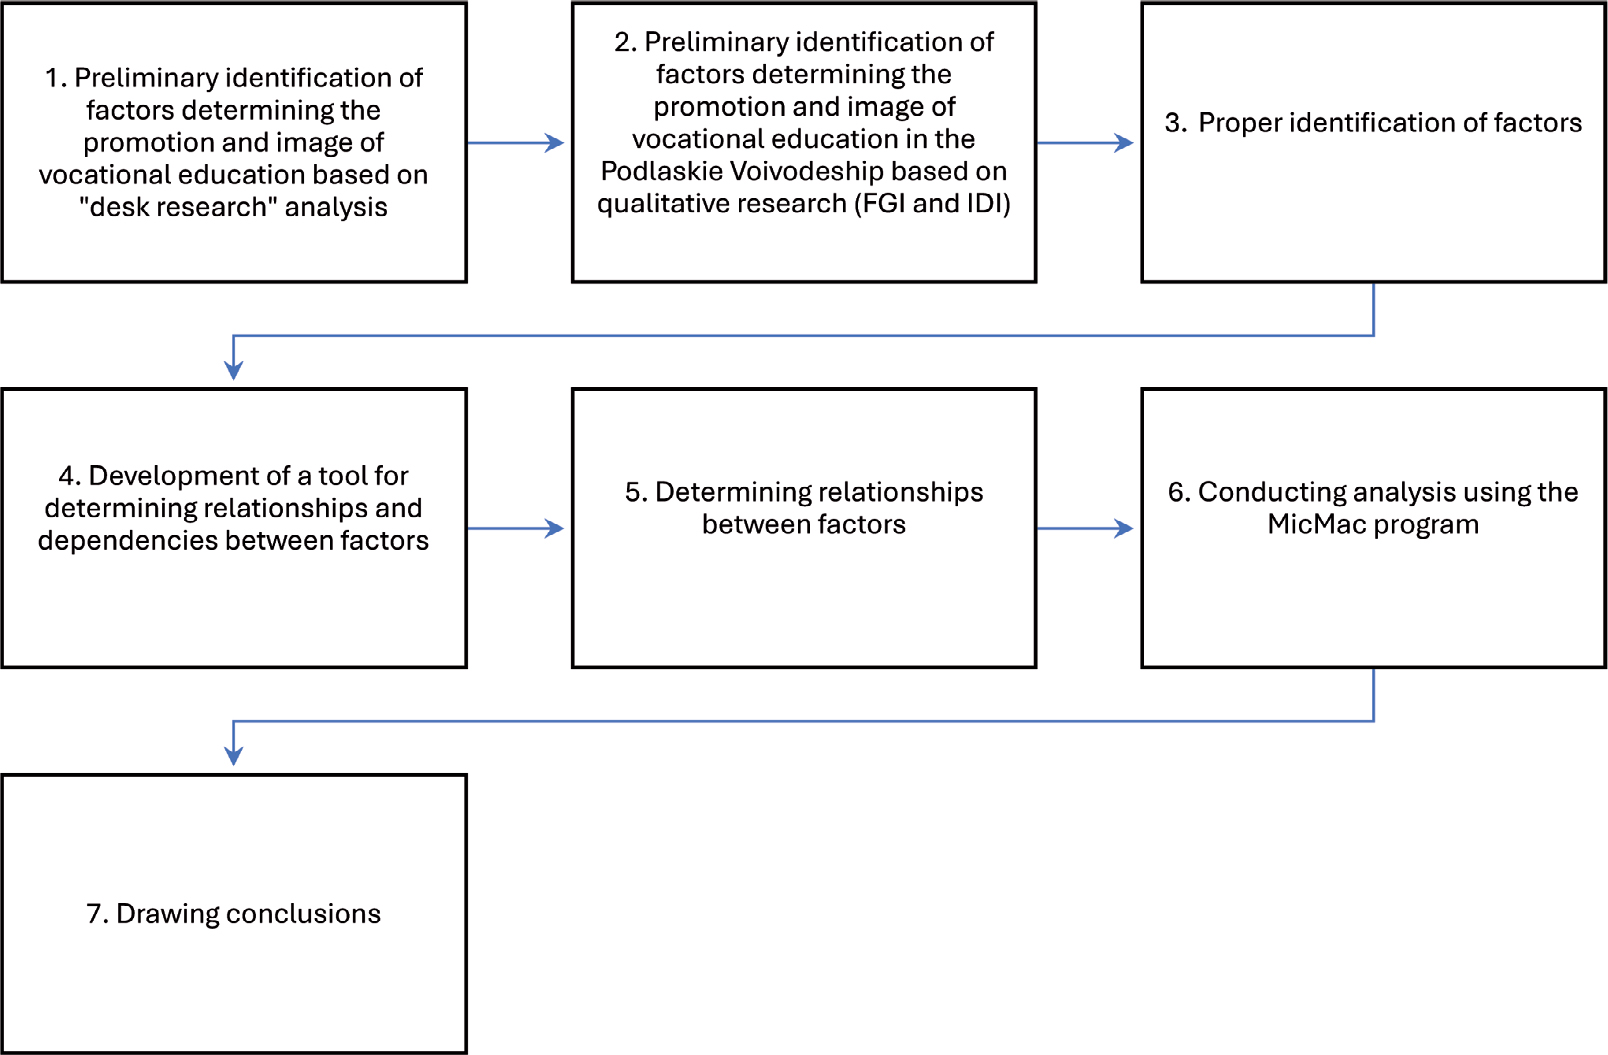
Figure 2.
The research procedure for structural analysis.
Table 1.
Factors determining the image and promotional activity of vocational schools in the Podlaskie Voivodeship.
| No | Factor | Acronym |
|---|---|---|
| 1 | employment needs of employers | ENE |
| 2 | systemic solutions within vocational education in Poland | SSV |
| 3 | demographic situation | DS |
| 4 | competition in the education market | CEM |
| 5 | level of economic development in the region | EDR |
| 6 | the recruitment system for vocational schools | RS |
| 7 | generational attitudes of youth (students) | YA |
| 8 | parents’ attitudes (especially mothers’) toward vocational education | PA |
| 9 | development of new technologies, including AI | DNT |
| 10 | development of social media | DSM |
| 11 | initiative-taking capacity of vocational schools | ITC |
| 12 | strength of the relationship between vocational schools and employers | RVE |
| 13 | strength of the relationship between vocational schools and local governments | RVG |
| 14 | mission and values of vocational schools | MV |
| 15 | awareness of vocational schools’ promotional needs | APN |
| 16 | strength of the relationship between vocational schools and alumni | RVA |
Table 2.
Degree of mutual influence among factors determining the image and promotion of vocational education in the Podlaskie Voivodeship – expert evaluations.
| ENE | SSV | DS | CEM | EDR | RS | YA | PA | DNT | DSM | ITC | RVE | RVG | MV | APN | RVA | |
|---|---|---|---|---|---|---|---|---|---|---|---|---|---|---|---|---|
| ENE | 0 | 3 | 0 | 2 | 2 | 2 | 3 | 1 | 2 | 2 | 2 | 3 | 2 | 2 | 3 | 2 |
| SSV | 1 | 0 | 0 | 2 | 2 | 2 | 1 | 2 | 2 | 1 | 2 | 3 | 3 | 2 | 2 | 1 |
| DS | 3 | 2 | 0 | 2 | 2 | 2 | 2 | 2 | 1 | 1 | 2 | 2 | 2 | 2 | 2 | 1 |
| CEM | 3 | 2 | 0 | 0 | 2 | 2 | 2 | 2 | 2 | 3 | 3 | 3 | 3 | 3 | 3 | 2 |
| EDR | 3 | 2 | 2 | 2 | 0 | 2 | 2 | 2 | 3 | 1 | 2 | 3 | 2 | 2 | 2 | 1 |
| RS | 2 | 1 | 0 | 3 | 2 | 0 | 1 | 1 | 1 | 1 | 2 | 2 | 2 | 2 | 3 | 1 |
| YA | 2 | 1 | 1 | 3 | 2 | 2 | 0 | 2 | 2 | 3 | 3 | 2 | 1 | 3 | 3 | 2 |
| PA | 1 | 1 | 2 | 2 | 1 | 1 | 2 | 0 | 0 | 2 | 2 | 1 | 1 | 2 | 3 | 0 |
| DNT | 3 | 1 | 0 | 3 | 2 | 1 | 2 | 0 | 0 | 3 | 2 | 1 | 1 | 2 | 2 | 1 |
| DSM | 1 | 1 | 0 | 2 | 1 | 0 | 3 | 2 | 2 | 0 | 2 | 2 | 1 | 2 | 3 | 2 |
| ITC | 1 | 1 | 0 | 3 | 2 | 1 | 3 | 2 | 1 | 2 | 0 | 3 | 2 | 3 | 3 | 3 |
| RVE | 3 | 1 | 0 | 3 | 2 | 1 | 2 | 2 | 1 | 2 | 3 | 0 | 2 | 3 | 3 | 2 |
| RVG | 1 | 1 | 0 | 2 | 2 | 1 | 1 | 1 | 0 | 0 | 2 | 1 | 0 | 1 | 2 | 1 |
| MV | 1 | 0 | 0 | 2 | 1 | 1 | 2 | 2 | 0 | 2 | 3 | 3 | 2 | 0 | 2 | 2 |
| APN | 2 | 1 | 0 | 3 | 2 | 0 | 3 | 2 | 1 | 3 | 3 | 3 | 2 | 3 | 0 | 3 |
| RVA | 0 | 0 | 0 | 2 | 0 | 0 | 2 | 2 | 0 | 1 | 1 | 1 | 1 | 2 | 2 | 0 |
Table 3.
Characteristics of the direct influence matrix.
| Indicator | Value |
|---|---|
| Matrix Dimensions | 16 × 16 |
| Number of zeros (no influence) | 42 |
| Number of ones (weak influence) | 58 |
| Number of twos (moderate influence) | 106 |
| Number of threes (strong influence) | 50 |
| Degree of fill | 84% |
Table 4.
Summary of direct influence strengths between factors in structural analysis.
| No | Acronym | Factor | Total influence strength | Total dependency strength |
|---|---|---|---|---|
| 1 | ENE | employment needs of employers | 31 | 27 |
| 2 | SSV | systemic solutions within vocational education in Poland | 26 | 18 |
| 3 | DS | demographic situation | 28 | 5 |
| 4 | CEM | competition in the education market | 35 | 36 |
| 5 | EDR | level of economic development in the region | 31 | 25 |
| 6 | RS | the recruitment system for vocational schools | 24 | 18 |
| 7 | YA | generational attitudes of youth (students) | 32 | 31 |
| 8 | PA | parents’ attitudes (especially mothers’) toward vocational education | 21 | 25 |
| 9 | DNT | development of new technologies, including AI | 24 | 18 |
| 10 | DSM | development of social media | 24 | 27 |
| 11 | ITC | initiative-taking capacity of vocational schools | 30 | 34 |
| 12 | RVE | strength of the relationship between vocational schools and employers | 30 | 33 |
| 13 | RVG | strength of the relationship between vocational schools and local governments | 16 | 27 |
| 14 | MV | mission and values of vocational schools | 23 | 34 |
| 15 | APN | awareness of vocational schools’ promotional needs | 31 | 38 |
| 16 | RVA | Strength of the relationship between vocational schools and alumni | 14 | 24 |
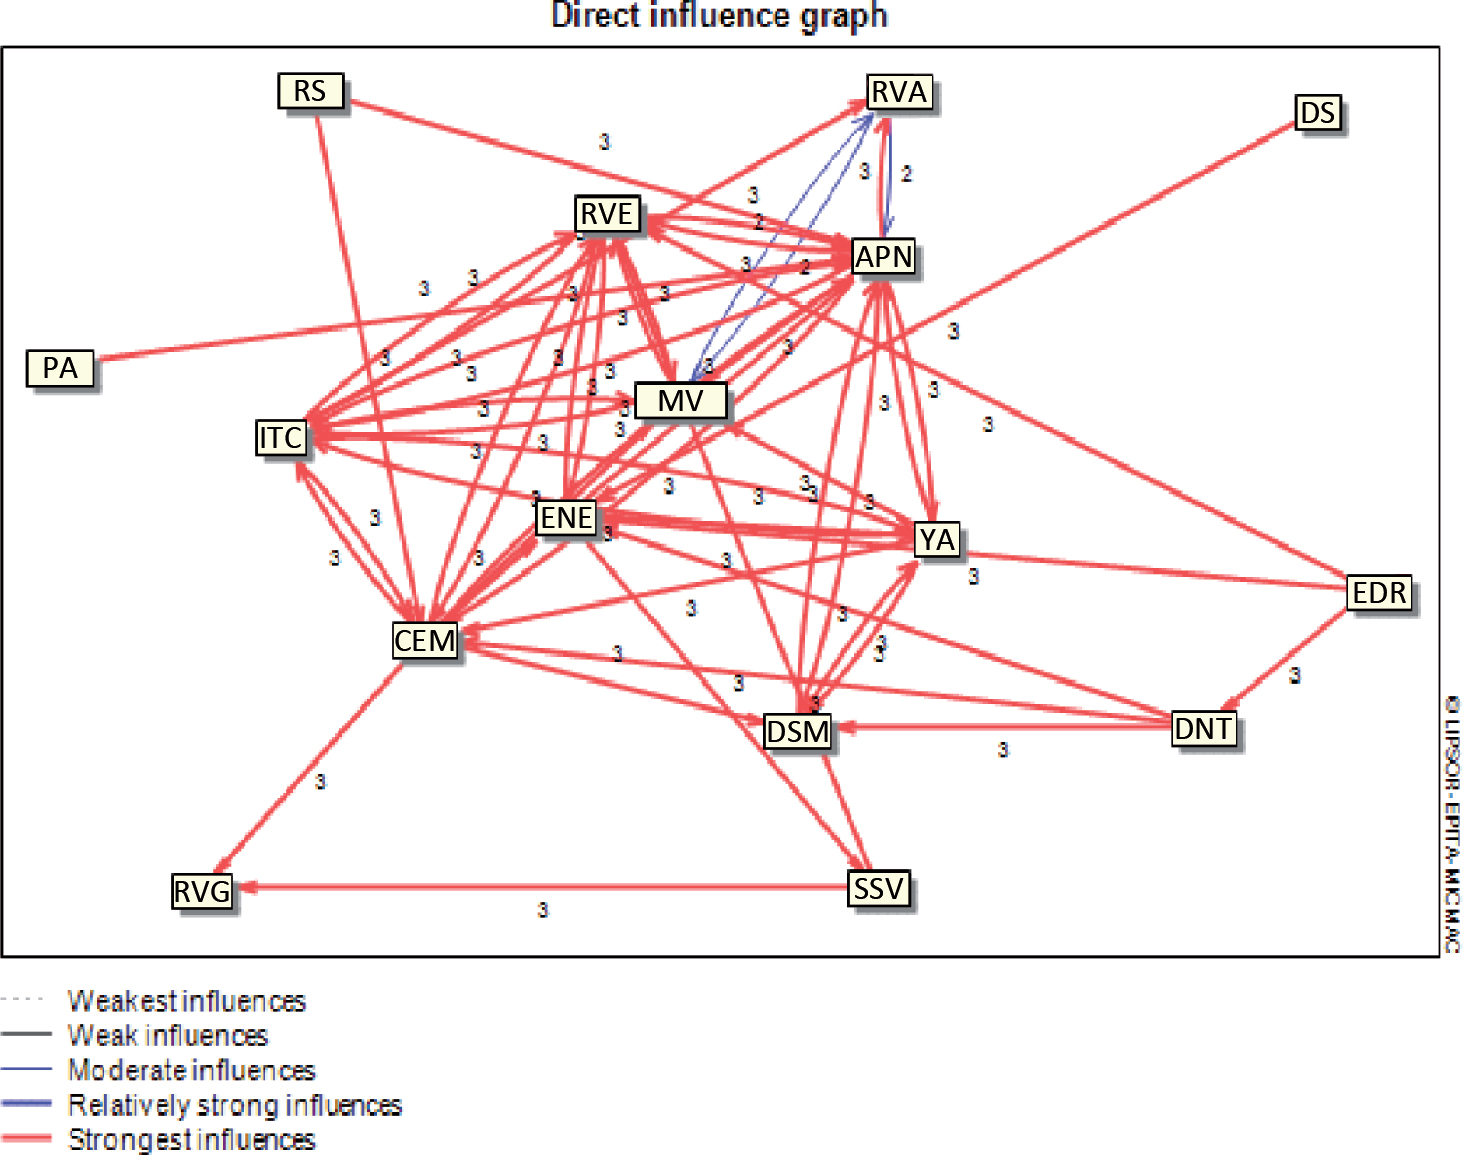
Figure 3.
Graph of direct interactions.
(drawn up in Mic-Mac)
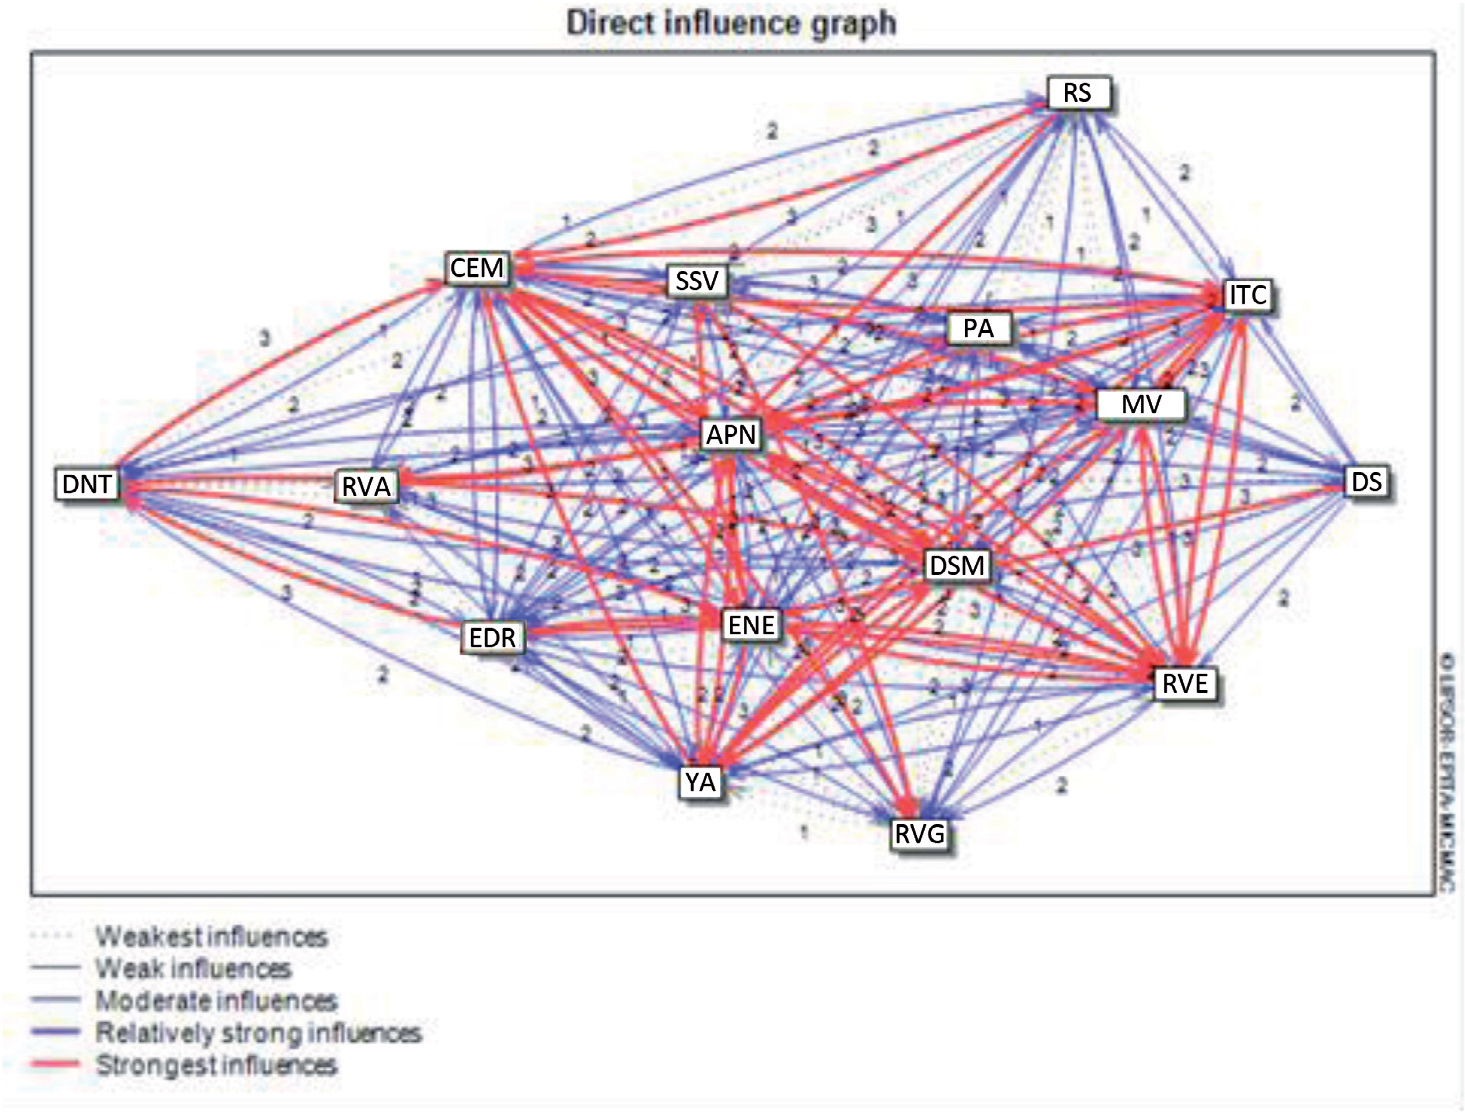
Figure 4.
Network of direct interactions among factors determining the promotion and image of vocational education in the Podlaskie Voivodeship.
(drawn up in Mic-Mac)
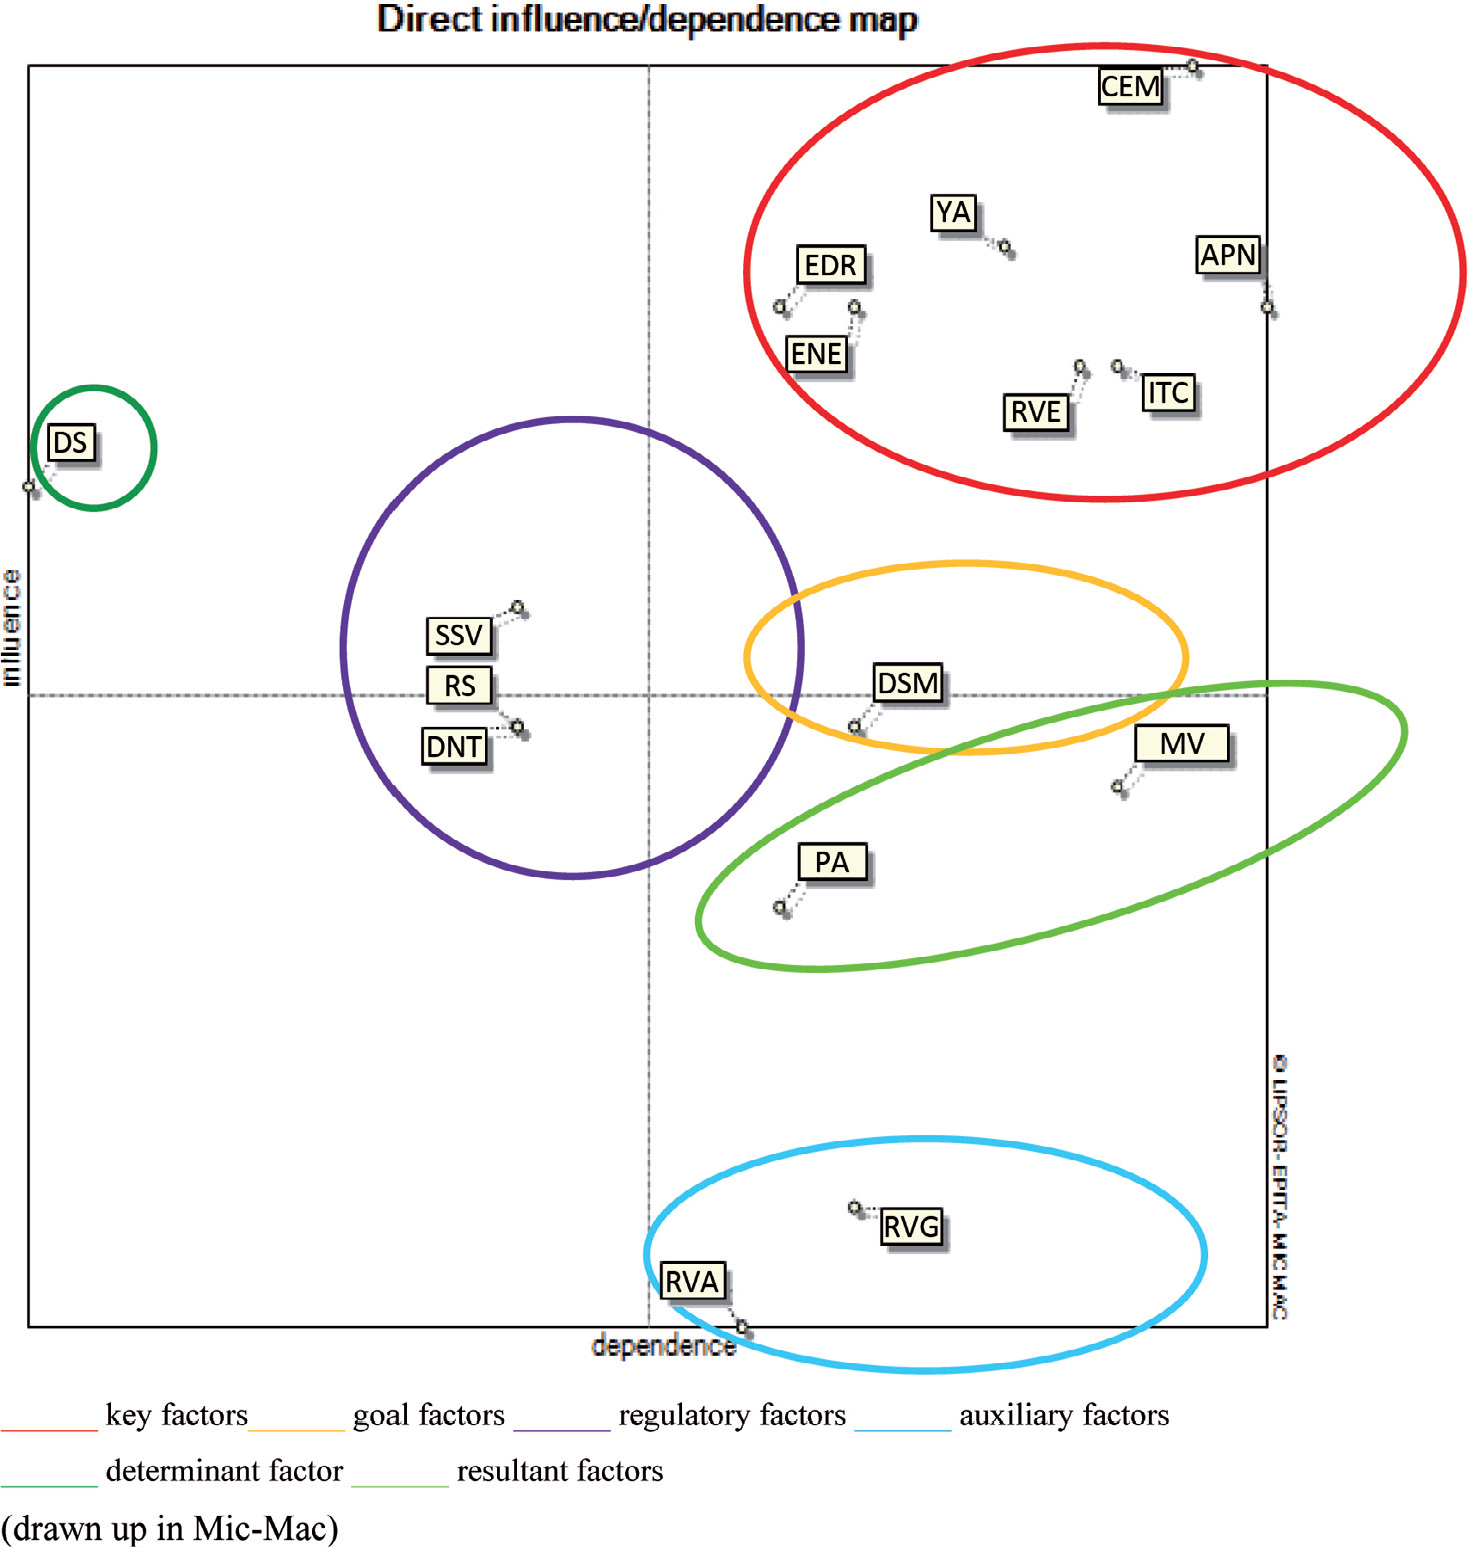
Figure 5.
Map of structural analysis factors based on direct interactions.
(drawn up in Mic-Mac)