
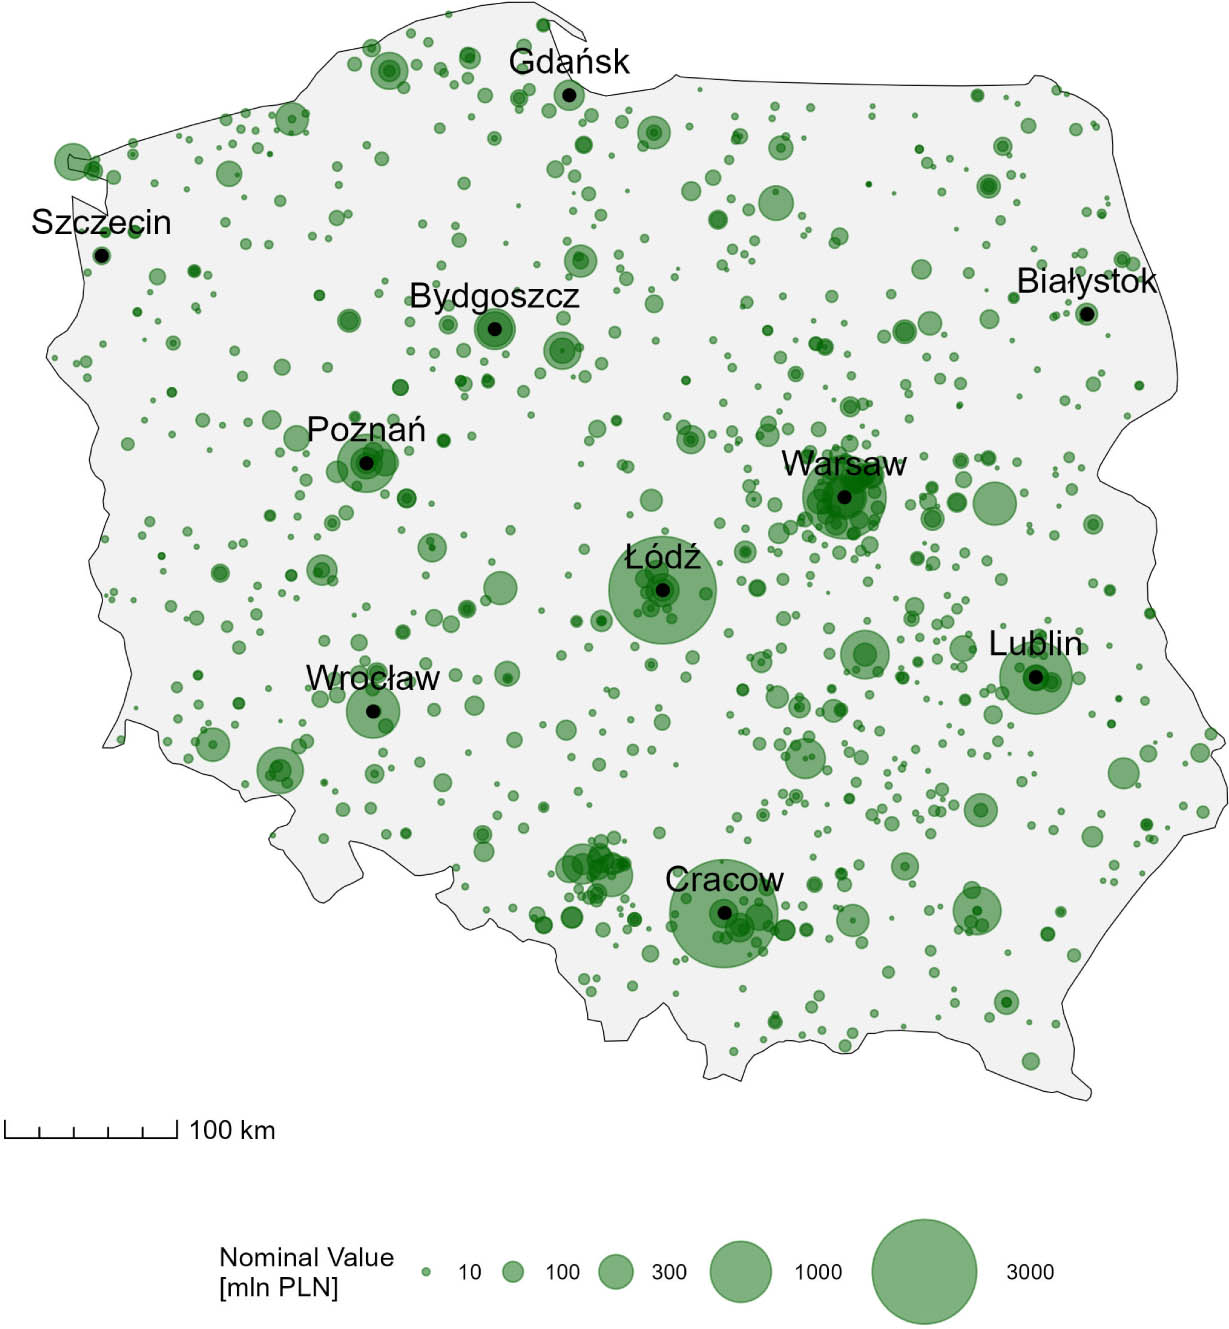
Figure 1.
Spatial distribution of municipal bonds in Poland – outstanding nominal value per single issuing entity as of the end of 2024
Source: Own elaboration based on the RIO database
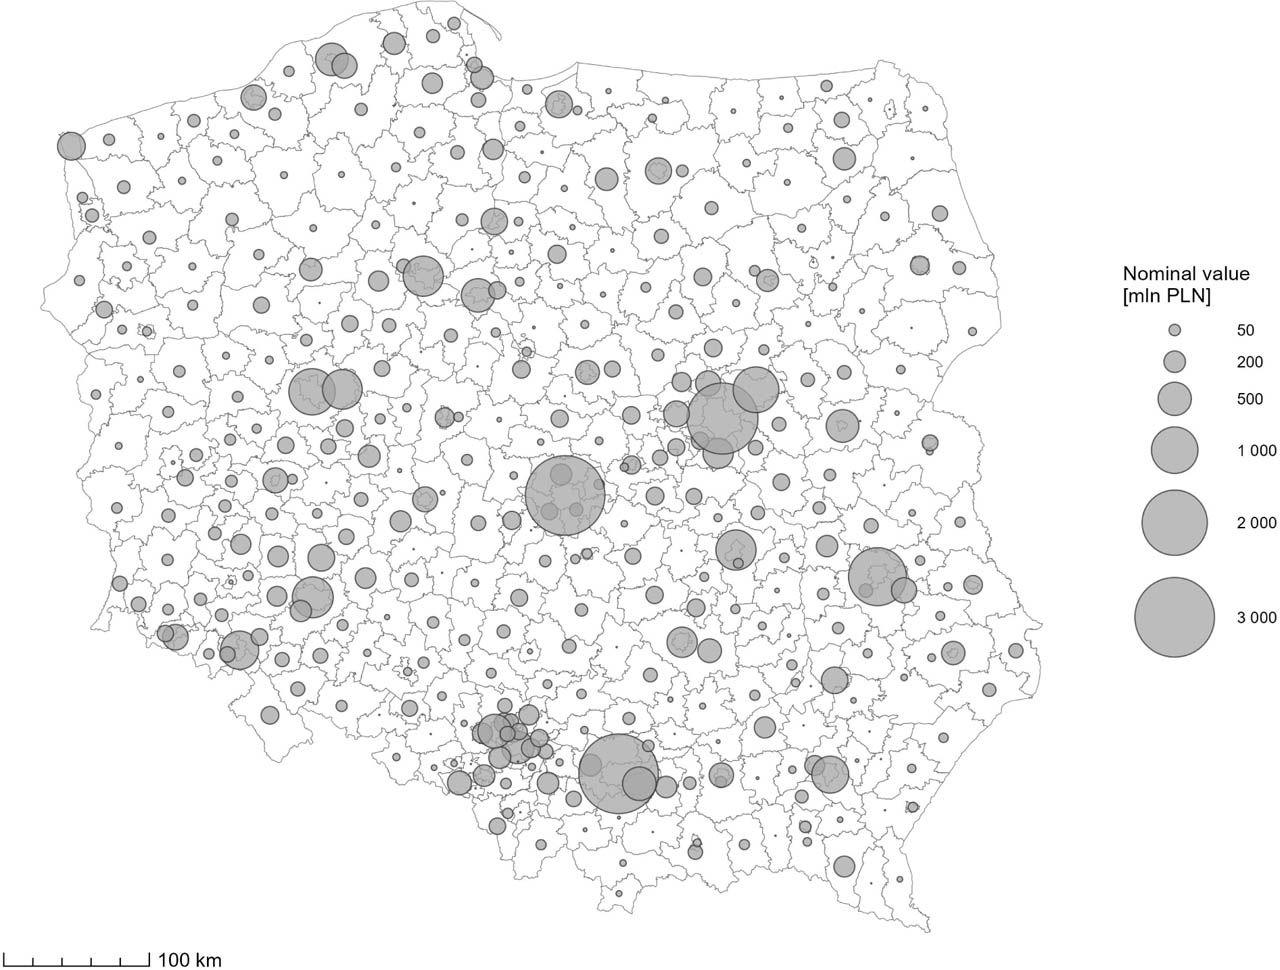
Figure 2.
Aggregated total value of municipal bonds outstanding per county as of the end of 2024
Source: Own elaboration
Table 1.
Results of OLS model estimation
| Variable | Coefficient | Robust Std. Error | t-student | p-value |
|---|---|---|---|---|
| Intercept | 4.923 | 2.881 | 1.71 | 0.088 |
| Population(log) | 0.831 | 0.351 | 2.37 | 0.018* |
| Distance(log) | −0.559 | 0.118 | −4.73 | < 0.001*** |
| Debt service(log) | 6.592 | 0.873 | 7.55 | < 0.001*** |
| EU funds(log) | −0.368 | 0.204 | −1.81 | 0.072 |
| PIT revenue(log) | −0.970 | 0.384 | −2.53 | 0.012* |
| Migration balance(log) | 0.173 | 0.056 | 3.09 | 0.002** |
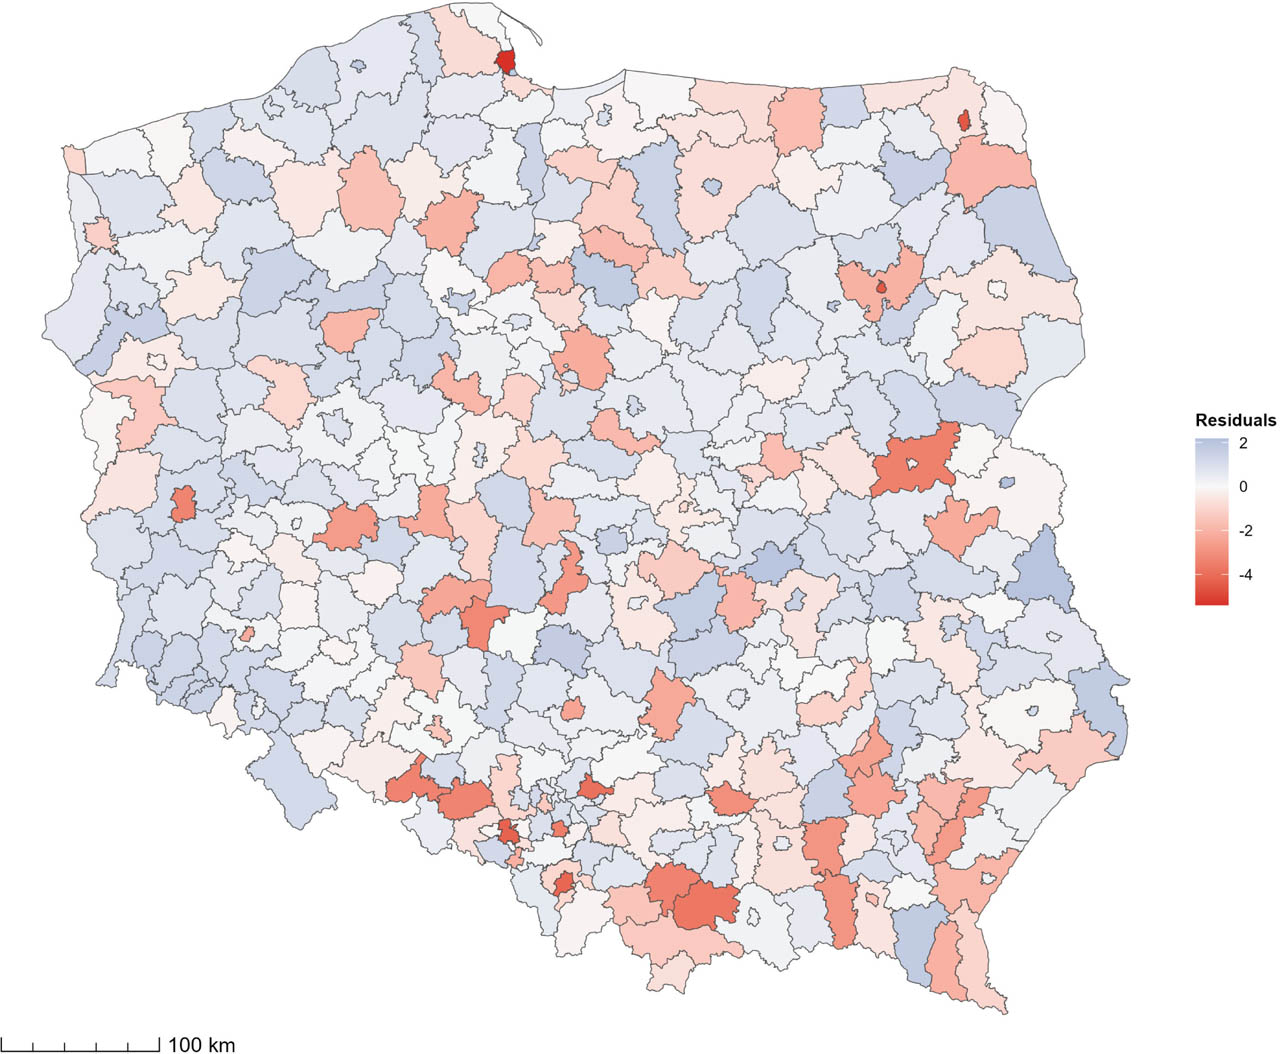
Figure 3.
Spatial distribution of residuals of the OLS model
Source: Own elaboration