
Figure 1.
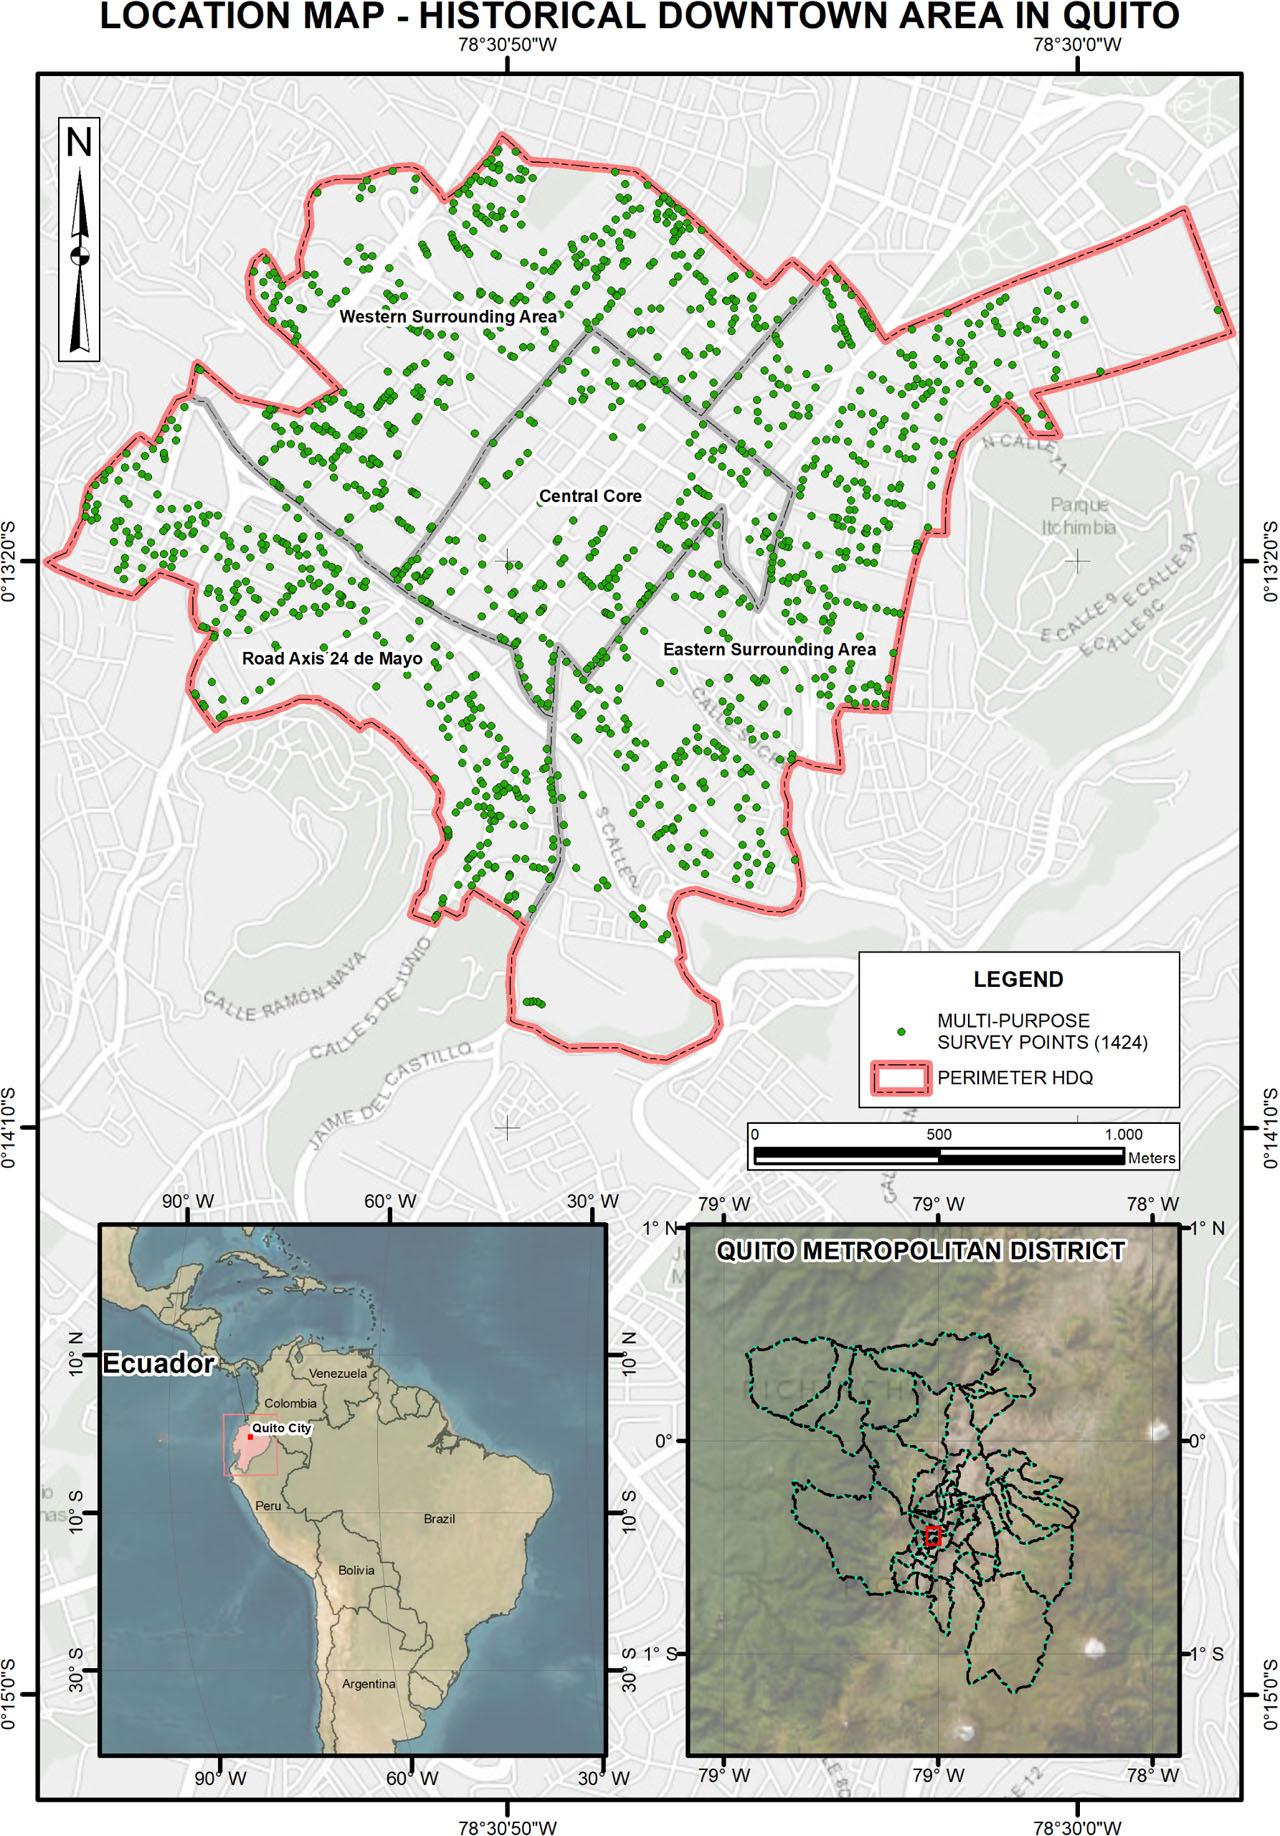
Figure 2.
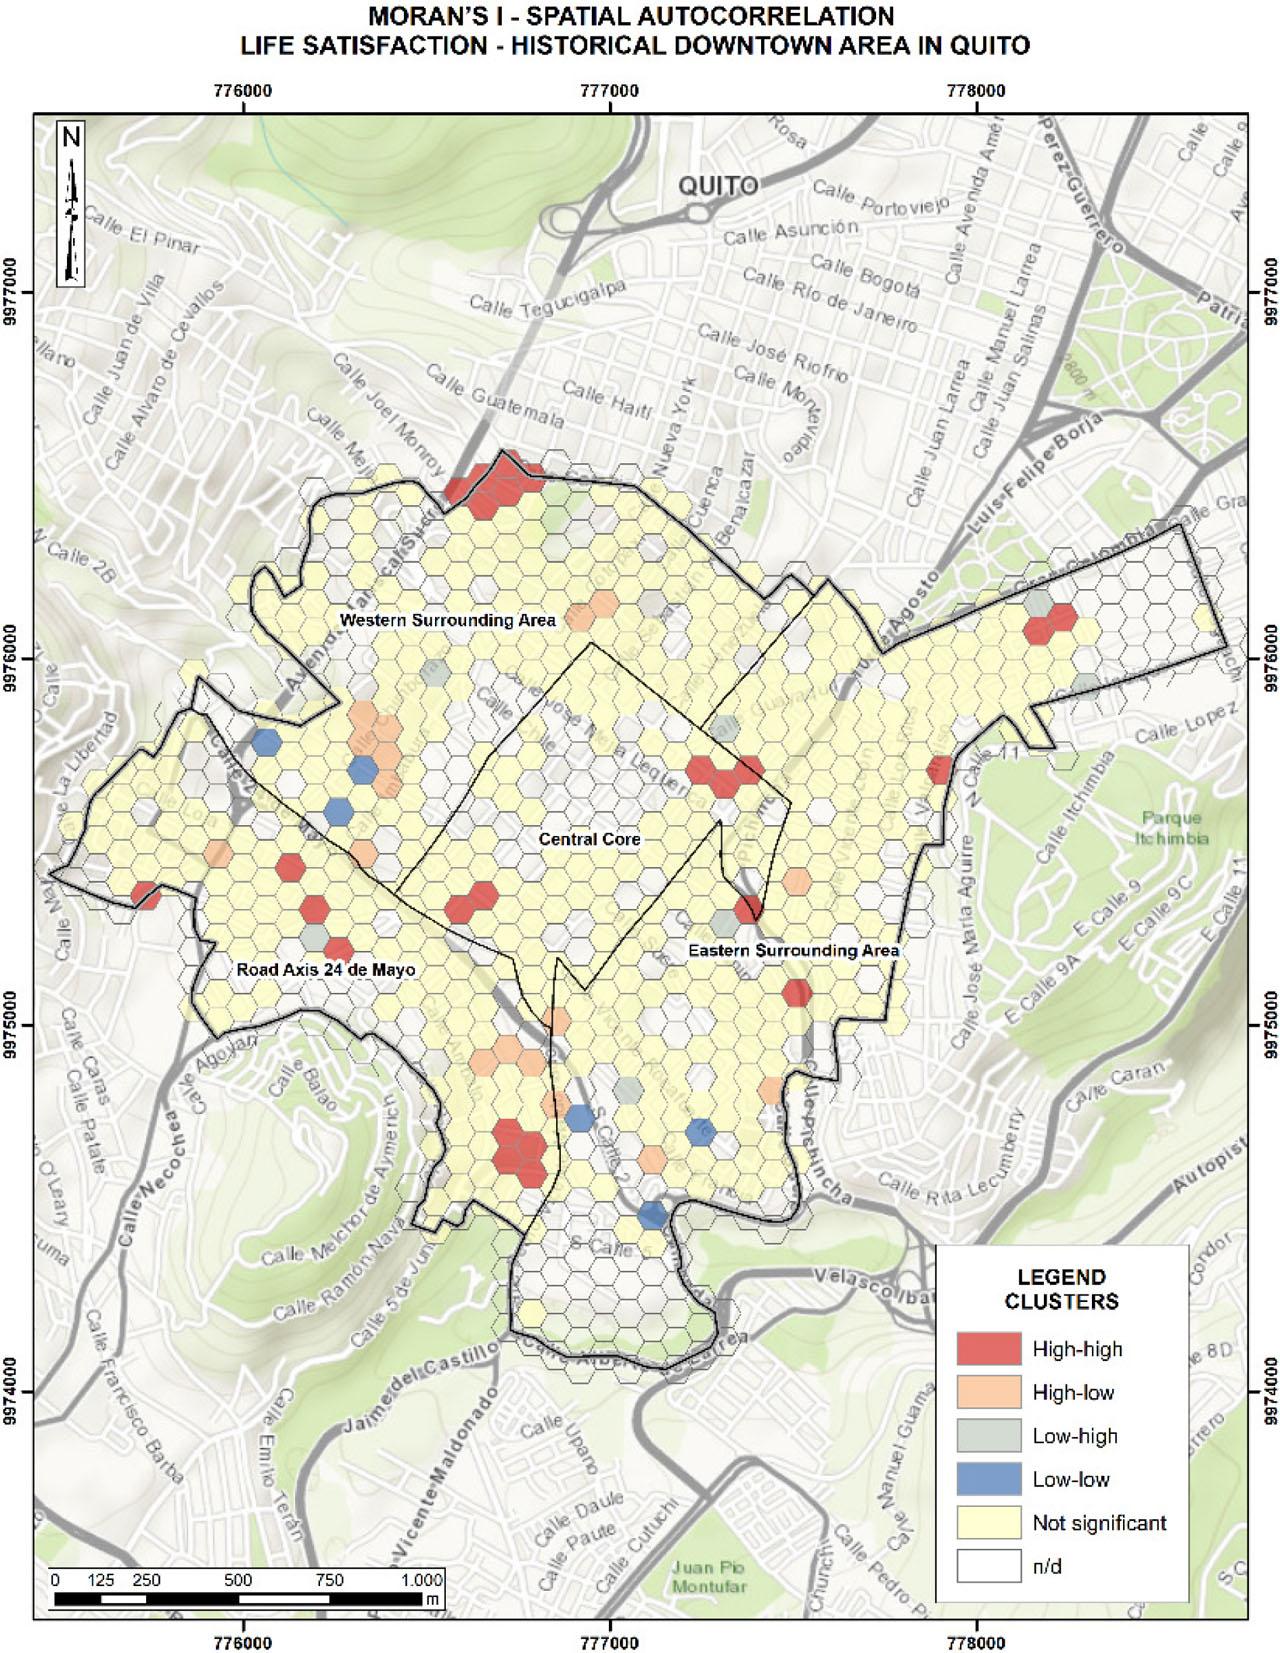
Figure 3.
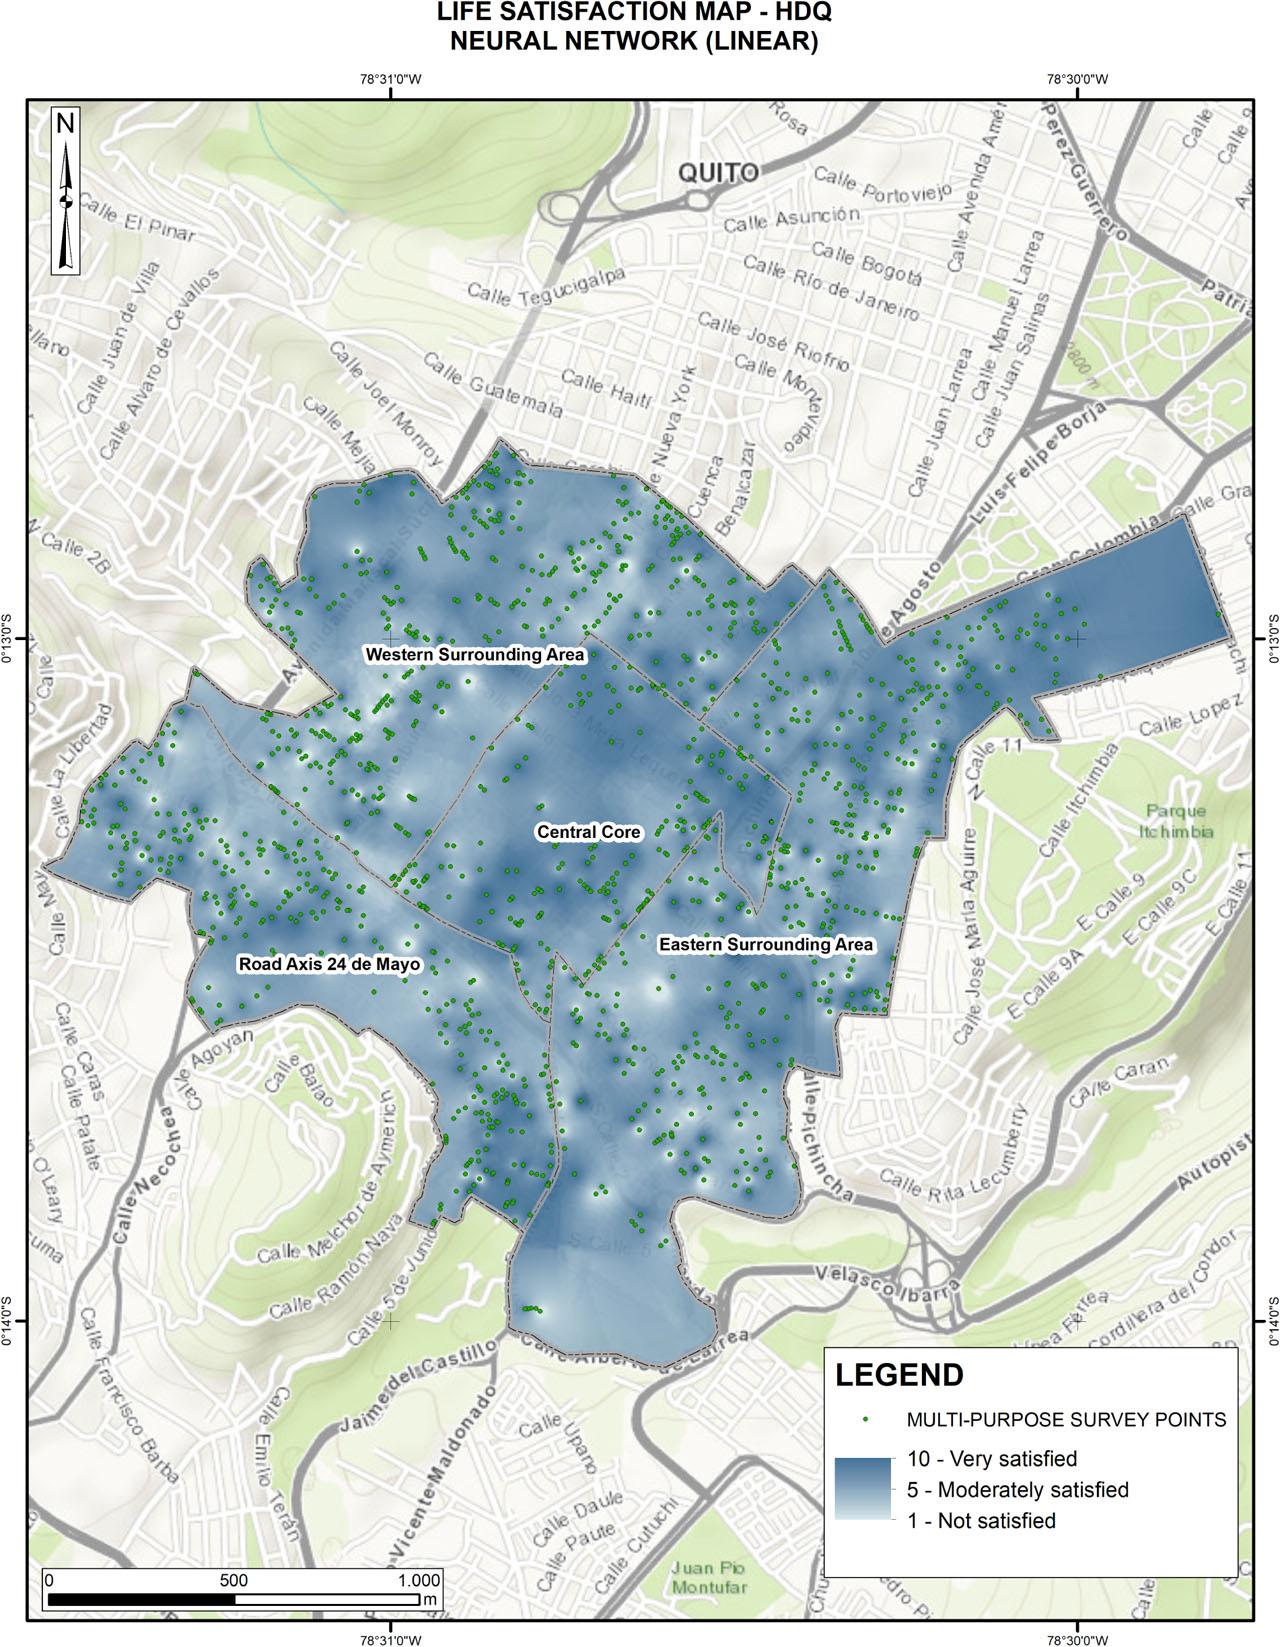
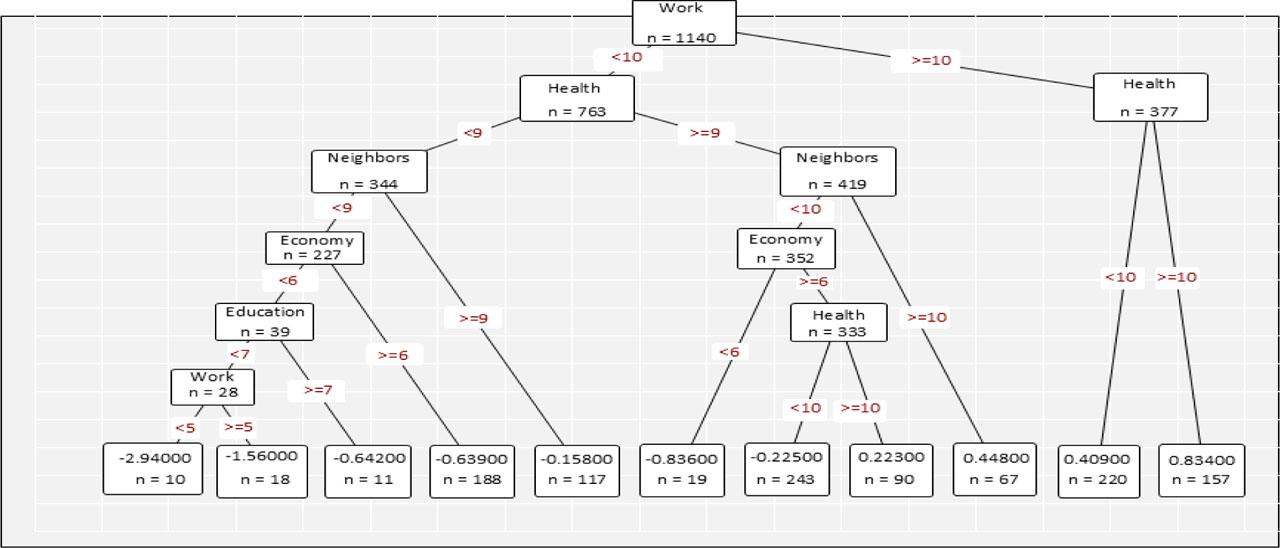
Figure 4.
Variables used for the analyses
| Variable |
|---|
| Satisfaction with life |
| Education |
| Health |
| Socioeconomic status |
| Household conditions |
| Work |
| Interaction with neighbours |
| Environmental conditions |
Results of the regression models
| Artificial Neural Network | Decision Tree | ||
|---|---|---|---|
| RMSE: 0.804 | RMSE: 0.822 | ||
| Variable | Relative Importance | Variable | Relative Importance |
| Health | 23.90 | Work | 26.06 |
| Work | 18.20 | Health | 18.55 |
| Socioeconomic status | 14.20 | Socioeconomic status | 17.21 |
| Interaction with neighbours | 12.90 | Household conditions | 15.35 |
| Environmental conditions | 11.30 | Interaction with neighbours | 11.18 |
| Household conditions | 10.50 | Education | 9.42 |
| Education | 9.00 | Environmental conditions | 0.23 |