
The historical downtown area in Quito (HDQ), which was declared a UNESCO World Cultural Heritage Site in 1978, is recognised as one of the best-preserved urban complexes in the world, and has a valuable cultural, architectural, and artistic legacy. However, in the past three decades, this area has experienced a pronounced process of deterioration and abandonment caused by a series of social, economic, and environmental factors which have contributed to the migration of its resident population (Carrión 2001). The process of depopulation and deterioration is not exclusive to the HDQ; in fact, many historical centres in Latin American cities face similar challenges (González, Biffis & Etulain 2018). These spaces have shown limited resilience to the processes of urban modernisation and globalisation, which demand adaptation at a faster pace than these heritage core areas can sustain. The HDQ has undergone a significant transformation in its population and urban dynamics, shifting from being the central hub of the city to becoming an increasingly segregated and isolated area within a network of urban centralities (Naranjo Serrano et al. 2020).
In 1990 the population of the HDQ was approximately 60,000, a figure which dropped to 40,587 in 2010 and further declined to 29,509 inhabitants by 2022 (INEC 2022). In this context, the HDQ has become a critical case study for decision-makers and researchers. The integration of the HDQ into the city's functional system has not been fully clarified and has posed a significant challenge for urban planning and territorial management. Thus, the HDQ should be treated as a complex and dynamic system in which multiple interrelated variables influence the sustainability and liveability of the urban residents (Evans et al. 2010).
Complex phenomena (e.g., life satisfaction) can be understood through multiple dimensions and predictive variables, as suggested by Goldin (2015) and Evans et al. (2010). Advanced computational techniques, combined with spatial analysis, can be useful for modelling social phenomena which have traditionally been difficult to quantify. Artificial intelligence (AI), which includes machine learning (ML), has experienced rapid development over the past 15 years, and its applicability has expanded to various fields, including the social sciences. Chen et al. (2021) point out that ML has facilitated the development of predictive models in disciplines such as sociology, economics, and urban planning. ML models can learn and improve predictions from large volumes of data, offering an effective approach to analysing complex social phenomena such as life satisfaction (Di Franco & Santurro 2021).
Gualda (2022) highlights how computational social sciences, supported by spatial analysis, can generate results which serve as valuable tools for decision-making in urban management. Quantitative and spatial information can also transform the social imagination of historical centres whose regeneration has been prioritised in territorial development agendas at the governmental level (MIDUVI 2016). It is crucial to understand life satisfaction as a dynamic process influenced by physical, environmental, cultural, and economic factors. According to Gordón et al. (2018), countries and cities with high human development indices tend to have higher levels of life satisfaction, reflecting the effectiveness of policies in areas such as health, education, and economic income.
Satisfaction with life could be defined as a subjective form of quality of life. It can also be referred to as ‘appreciation of life’, ‘subjective wellbeing’, or ‘happiness’, and is considered both an internal quality of life (personal, subjective) and a life outcome (the result of multiple conditions) (Veenhoven 2000). Subjective wellbeing, or life satisfaction, can be measured through indicators which define a quantified perspective on personal satisfaction. Thus, the statistical analysis of life satisfaction can be descriptive, but also inferential, in the sense that it allows for the development of models which can be spatially visualised.
Smith (1973), Gómez et al. (2001), and Lucero et al. (2007) highlight that a spatial perspective can be useful in complementing the integrated assessment of subjective well-being. The concepts of territory/geographical space and life satisfaction are increasingly aligned and should be conceptually linked. Leva (2005) and Pacione (2003) mention that the higher the territorial quality of a locality, the greater the well-being or quality of life of its residents. Territory can be considered a contributing factor to life satisfaction—not necessarily a direct determinant, but rather a conditioning element which provides both environmental (physical-natural) and social opportunities, playing an active role within the social structure (Lucero et al. 2007).
The study of the impact of different factors (e.g., social, economic, environmental) on the subjective quality of life (including satisfaction with life) using machine learning techniques is still limited and constitutes an emerging field, having expanded significantly only in the past two years. For instance, Sharma, Gill, and Jangra (2024) applied machine learning approaches to classifying individuals' levels of happiness. Rodríguez and Cabrera-Barona (2024) applied ordinal logistic regression, random forests, and support vector machines to assess the impact of several domains on satisfaction with life. Kim et al. (2024) used several machine learning algorithms (such as support vector machines, Gaussian Naïve Bayes, and decision trees) to study how the quality of an individual's life is impacted by individual-level factors and lifestyle patterns. Narayanan et al. (2025) performed stepwise linear regression, elastic net regression, and random forests to predict life satisfaction.
In general, it can be affirmed that there is no standardised criterion for preferring one machine learning method over another for studying subjective quality of life, including life satisfaction. Additionally, the application of machine learning techniques to study the complexity of concepts such as life satisfaction is an emerging field which needs to be further developed. Furthermore, most existing studies examine urban, subjective well-being across broad spatial units (such as cities or regions), rather than at the intra-urban level.
In this sense, new research needs to bridge several knowledge gaps, such as the lack of studies which test and compare machine learning methods to validate and replicate the findings of previous work, the need to identify patterns of life satisfaction at finer spatial scales, and the importance of uncovering the granular drivers of satisfaction with life. Comparing different machine learning models is important to ensure the robustness of results, and to ensure that the findings are not dependent on the characteristics or restrictions of a single algorithm.
The objectives of this study are to determine which perceptions of socioeconomic factors influence the perceptions of life satisfaction within an intra-urban area, specifically, the historical downtown area in Quito (HDQ), by applying and comparing machine learning models. Additionally, the study aims to assess the spatial patterns of life satisfaction within the study area.
The HDQ (Figure 1) comprises an urban centrality made up of 376 hectares of built-up area. Approximately 46.76% of this area is used for residential housing, while the remaining 53.24% is allocated to various other purposes, including cultural, commercial, and entertainment uses (MDMQ 2011).
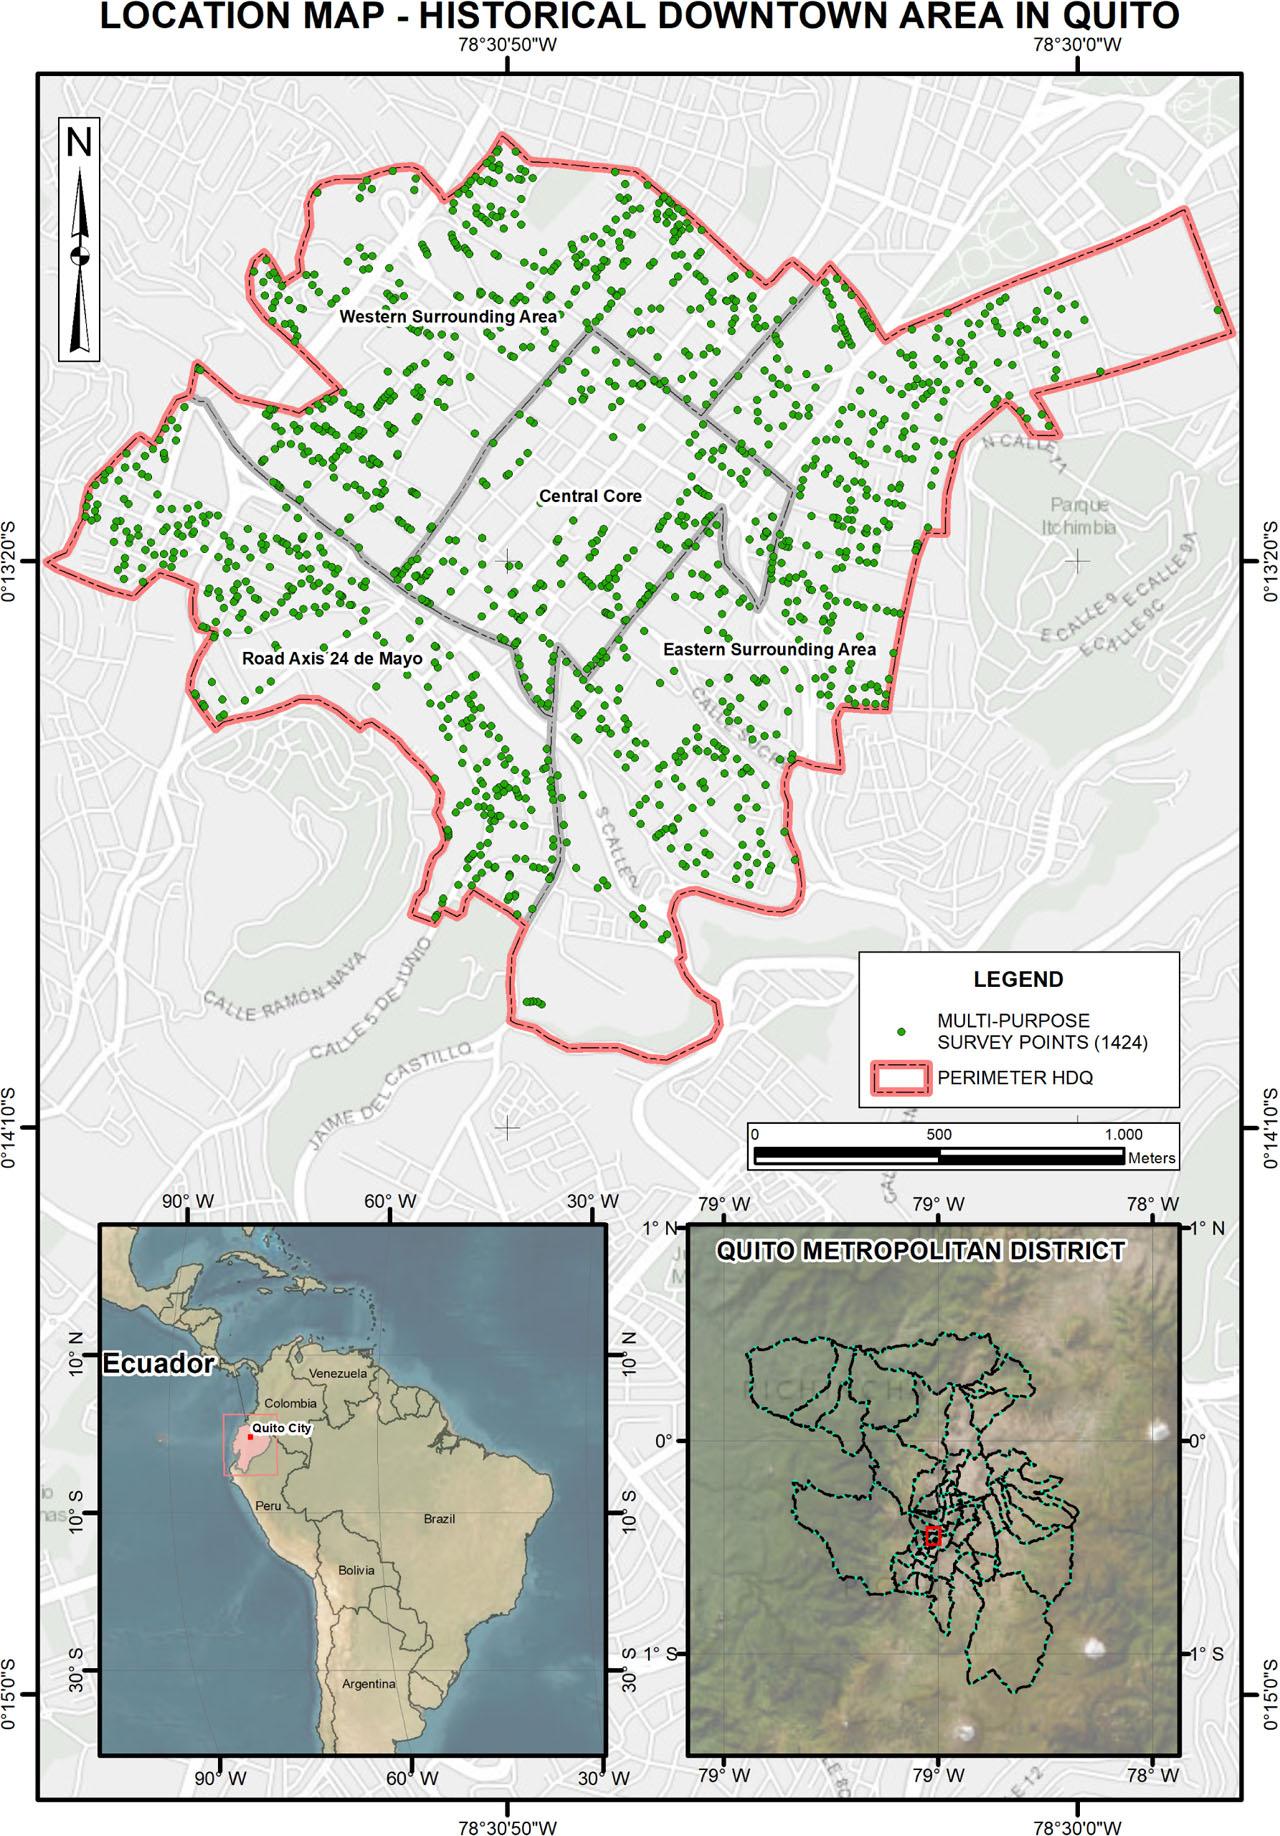
Study area and sampling points
Source: own elaboration
The multipurpose survey conducted in 2016 by the City Institute for Research (an institute affiliated with the municipality of Quito) serves as the primary data source for this study. The survey focused on the HDQ, and responses were provided by the heads of households (ICQ 2016). The heads of households also provided sociodemographic information about all household members. A total of 1,967 individuals were surveyed, representing 6,240 people living in households. The survey had a confidence level of 95% with a margin of error of 2.1%. The sample was selected using a randomised methodology based on official household registries in the HDQ, and the survey achieved a response rate of 98%.
The questions regarding the different types of satisfaction were developed in consultation with experts in the fields of urban studies, psychology, and statistics, and were pre-tested in the study area to ensure clarity and contextual relevance. The sampling approach used is common in household-based surveys, as household heads are generally assumed to possess adequate knowledge about their household's living conditions and the circumstances of family members. Consequently, the responses provided by the heads of households are considered to reflect the conditions and perceptions of the entire household. Therefore, the results can be reasonably generalised to the population of Quito's historic downtown area, within the established margin of error and confidence level.
At the household level, gender distribution was nearly equal, with 49.94% men and 50.06% women. In terms of household age composition, the highest representation was found in the 25–54 age group, which accounted for over 45% of the sample and included the core economically active population. Youth aged 15–24 represented approximately 11%, children under 15 comprised roughly 18%, while older adults aged 60 and above made up about 17%. Ethnically, 82.61% identified as mixed-race (mestizo), followed by 10.47% Indigenous, 3.51% White, 1.12% Afro-Ecuadorian, and the remainder belonging to other ethnic groups. In terms of education, 31.82% of household residents had completed secondary education, while 17.62% had obtained higher education degrees. Additionally, 81.14% of household heads reported being employed. Regarding household income (in US dollars), 17.34% of households reported monthly incomes below $330, while 25.67% earned between $331 and $524. Overall, 65.89% of households earn less than $800 per month, while only 4.37% reported earnings above $1,300.
After data cleaning, the final sample size considered for analysis was reduced to 1,424 heads of households; this was due to the removal of incomplete or inconsistent responses. Using a 95% confidence level, the corresponding margin of error was 2.5%. Despite the reduction in sample size, the margin of error remained low and within acceptable thresholds for this study.
Table 1 presents the satisfaction variables used in this study. All variable values ranged from 1 to 10, with 1 indicating ‘not satisfied at all’ and 10 indicating ‘highly satisfied’.
Variables used for the analyses
| Variable |
|---|
| Satisfaction with life |
| Education |
| Health |
| Socioeconomic status |
| Household conditions |
| Work |
| Interaction with neighbours |
| Environmental conditions |
Source: own elaboration
Prior to calculating the local spatial autocorrelation, the global Moran's I metric was applied to the life satisfaction variable using 999 permutations. The result yielded a Moran's I p-value of 0.001, confirming the presence of global spatial clustering and justifying the subsequent application of local Moran's I. In this study, both the global and local Moran's I metrics were calculated using the open-source software GeoDa.
Local Moran's I was used to assess the local spatial patterns of life satisfaction. It is the most widely used local spatial autocorrelation metric. This index is statistically rigorous (significance is tested via permutations) and the results are highly intuitive. The index can identify spatial clusters as well as spatial outliers. Through this assessment, hotspots of life satisfaction can be detected. This metric is expressed as (Anselin 1995; Zhang et al. 2008):
Two machine learning methods were applied as regression models under a supervised learning approach: decision trees and artificial neural networks. These methods were chosen for their flexibility and robustness in handling non-linear relationships. Decision trees and small-scale artificial neural networks are well-suited to datasets of modest size (typically comprising more than 1,000 but fewer than 5,000 data points), making them appropriate for this study's sample.
These models were calculated using the open-source software JASP. The basic idea behind a decision tree is to identify decision points where the independent variables divide the dataset into two subsets in a way which minimises the mean squared error (MSE). This regression method evaluates the features of the dataset and trains a model using a tree-based structure, applying a binary splitting criterion at each node (Cerulli 2023), where the decision parameters are selected based on a least squares criterion (Suthaharan 2016). A root node is the attribute which maximises the expected error reduction (Rathore and Kumar 2016). The fit of a decision tree can be performed through recursive binary splitting, which defines two splitting regions based on the minimisation of the residual sum of squares (RSS) within those regions (Cerulli 2023):
An artificial neural network can function as a regression model, operating as a multi-layered regression framework (Cerulli 2023) with observable inputs (features) and outputs which can be binary, categorical, or numerical (Abiodun et al. 2018). Considering only one hidden layer, the artificial neural network can be expressed as (Cerulli 2023):
The spatial visualisation of results was produced using ArcGIS software.
Figure 2 presents the local Moran's I values for life satisfaction. When multiple observations with high life satisfaction values are spatially clustered, they form a hotspot. Conversely, clusters of low values indicate coldspots. Several life satisfaction hotspots can be observed. For instance, three hotspots are located in the western sections of the HDQ, specifically, in the western surrounding area and along the road axis ‘24 de Mayo’; while one additional hotspot appears in the central area, corresponding to the central core.
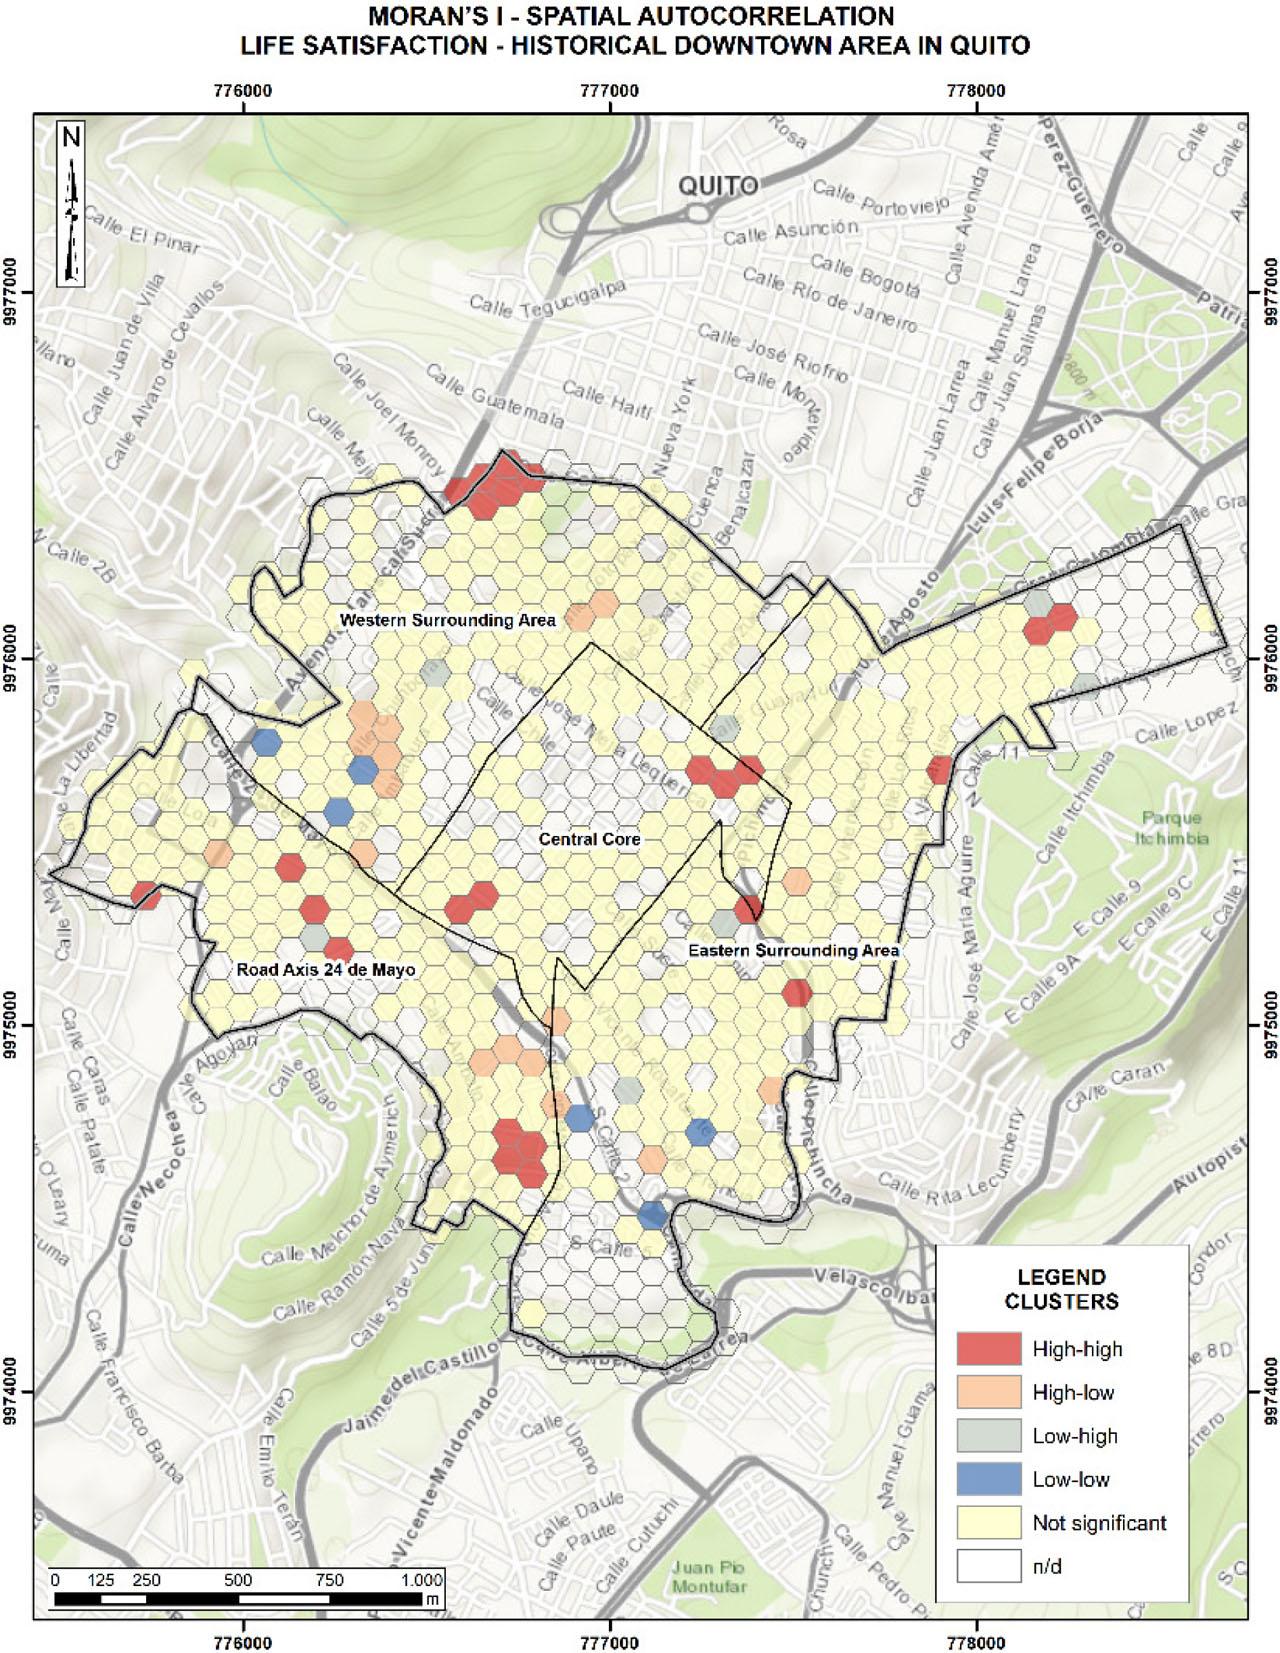
Local Moran's I for the satisfaction with life variable
Source: own elaboration
Table 2 presents the results of the applied models. The root mean square errors (RMSE) and the coefficients of determination (R2) for both regression models are similar, although the artificial neural network model exhibits a lower error rate than the decision tree. The RMSE provides the measure of prediction accuracy by quantifying the average deviation between the actual observed values and the predicted values, taking into account the life satisfaction rating scale. For example, for an observed value of 9, the artificial neural network model can yield a predicted range of between 8.196 and 9.804.
Results of the regression models
| Artificial Neural Network | Decision Tree | ||
|---|---|---|---|
| RMSE: 0.804 | RMSE: 0.822 | ||
| Variable | Relative Importance | Variable | Relative Importance |
| Health | 23.90 | Work | 26.06 |
| Work | 18.20 | Health | 18.55 |
| Socioeconomic status | 14.20 | Socioeconomic status | 17.21 |
| Interaction with neighbours | 12.90 | Household conditions | 15.35 |
| Environmental conditions | 11.30 | Interaction with neighbours | 11.18 |
| Household conditions | 10.50 | Education | 9.42 |
| Education | 9.00 | Environmental conditions | 0.23 |
Source: own elaboration
Satisfaction with health, work, and socioeconomic status are the variables which have the greatest influence on explaining satisfaction with life. This finding is notable, as the two distinct models produced similar results. Regarding the R2 metric, it can be noted that approximately 37% of the variation in life satisfaction is explained by the variables with the highest relative importance. The relative importance of a predictor refers to the percentage improvement in the model's explanatory power which is attributed to each independent variable. This analysis helps identify the degree of influence which each variable exerts on the dependent variable, whether statistically significant or not. It is important to note that this evaluation is not directly related to predictive accuracy, but rather to the contribution of each variable to the model's explanatory structure (Grömping 2006).
Figure 3 provides a spatial representation of the predicted values of life satisfaction, generated using the artificial neural network and supported by inverse distance weighting (IDW) interpolation. The map shows that most of the HDQ displays predicted values ranging from 5 to 10, indicating a significant presence of moderate to high levels of life satisfaction across the study area.
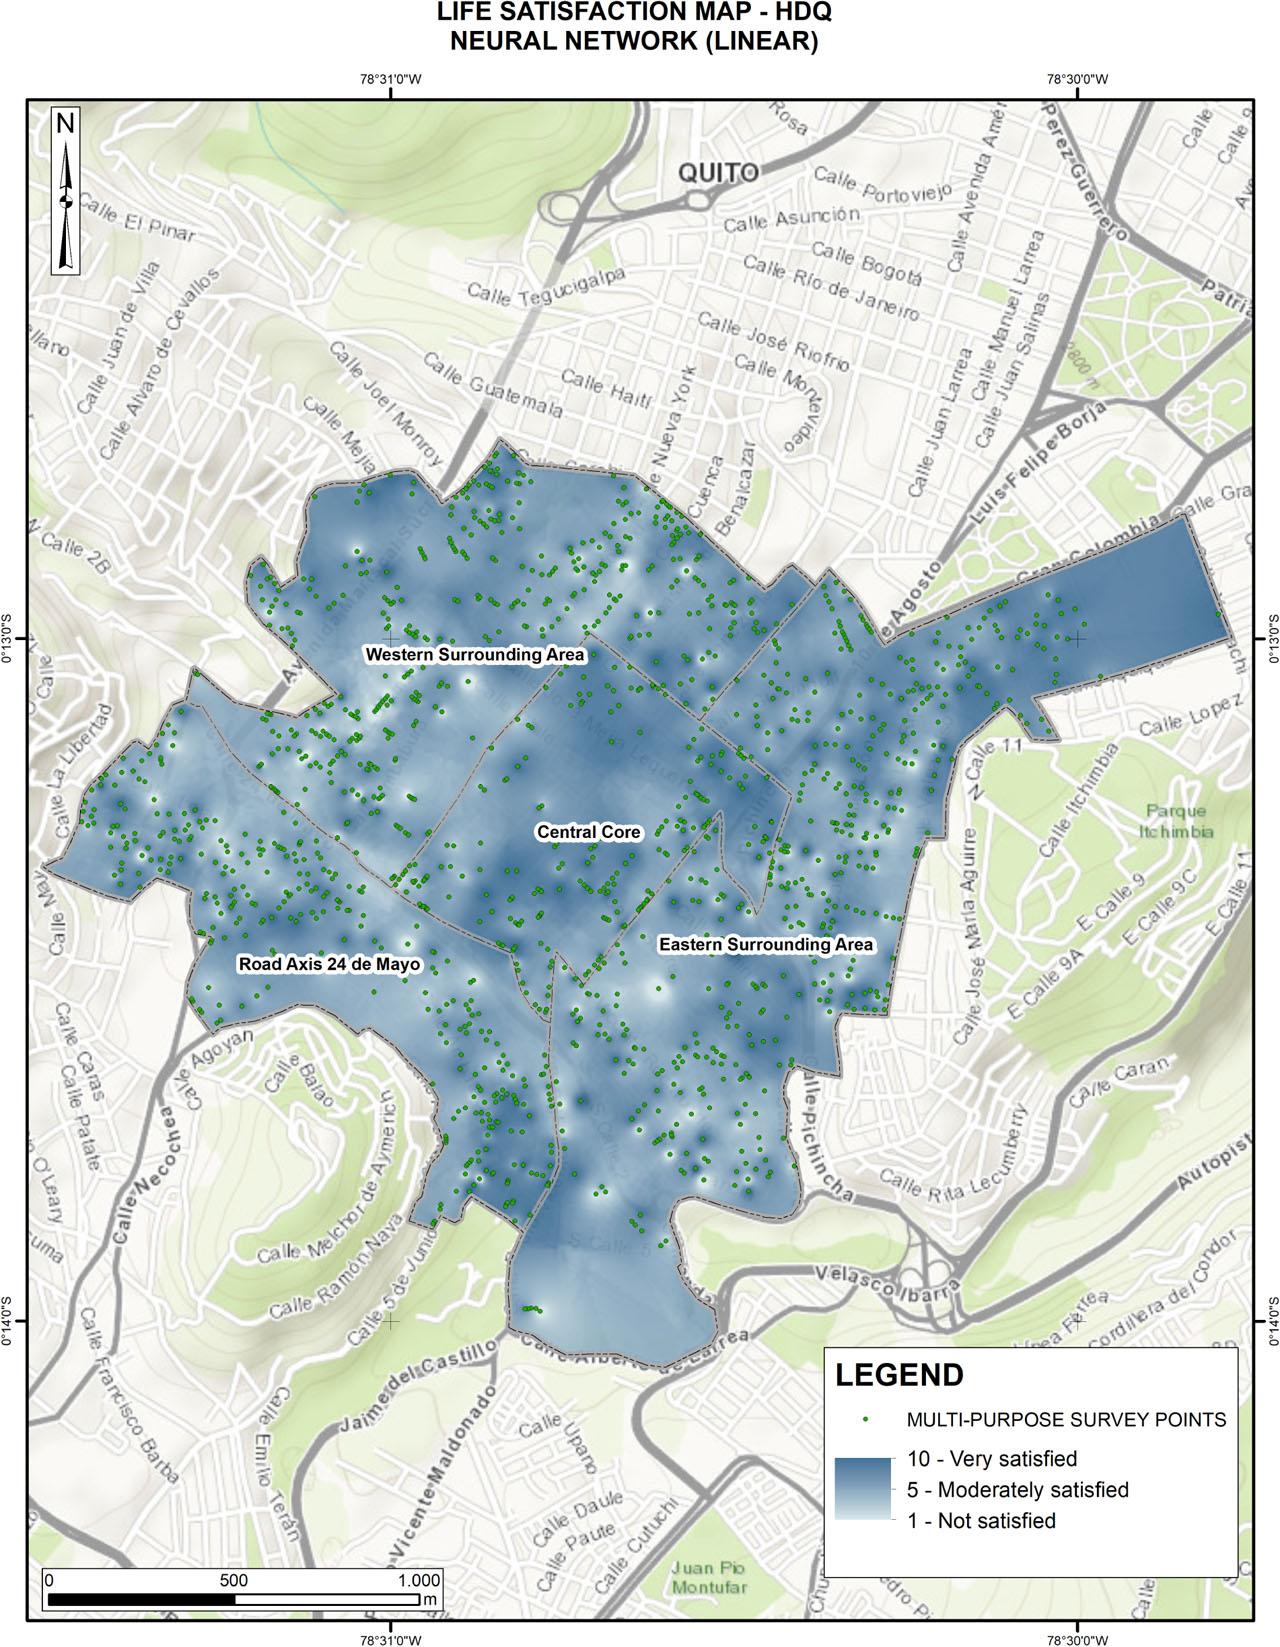
Satisfaction with life (artificial neural network predictions)
Source: own elaboration
One of the most interesting results of this study is the output of the decision tree model, as it explicitly reveals the logic underlying the construction of high or low perceptions of life satisfaction. This model aligns with the relative importance values, illustrating how hierarchical cut-off points and decision rules are established to ultimately determine whether an individual exhibits a high or low level of life satisfaction.
Figure 4 illustrates a case in which an interviewee reported being highly satisfied with both their work (score of 10) and health (score of 10), leading to a straightforward conclusion of high overall life satisfaction without the need to consider additional dimensions. However, something which is truly insightful lies in the profiles of individuals who initially rate their satisfaction with work below 10 and their satisfaction with health below 9. In these cases, the decision tree branches further, incorporating additional factors and combinations—such as low satisfaction with socioeconomic status (<6) and with education (<7), which systematically contribute to lower predicted levels of life satisfaction.
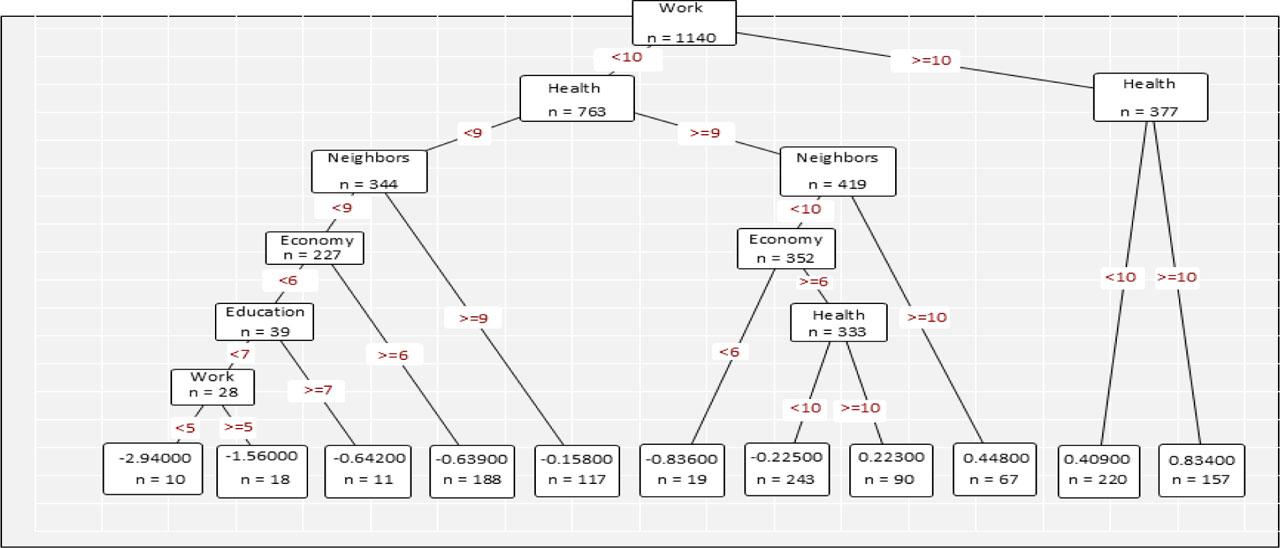
Decision tree
Source: own elaboration
Concepts such as life satisfaction, happiness, and well-being can be explored through both qualitative and philosophical lenses, emphasising individual narratives and offering a deep examination of the subjective experience, both in terms of measurement and interpretation. However, quantitative analysis provides us with the capacity to generalise findings and identify large-scale patterns, enabling the discovery of trends and relationships which might remain hidden in qualitative research. This not only enriches the understanding of the variables under study but also provides robust empirical evidence to support theories and arguments in disciplines such as psychology, sociology, and spatial analysis.
Satisfaction with life is one important dimension of quality of life and refers to psychological (or subjective) wellbeing (Tonón 2008). The present research finds that subjective wellbeing is primarily associated with satisfaction with health and work, and with the individual's socioeconomic status. These findings are in line with previous research. For instance, using a machine learning approach, Shen et al. (2023) found that subjective social status is a strong predictor of life satisfaction. Rodríguez and Cabrera-Barona (2024), for the same area examined in this study, found that satisfaction with work, satisfaction with household conditions, and satisfaction with health, significantly influence life satisfaction. Additionally, health satisfaction, expressed using different measures, such as health-related quality of life or self-rated oral health, has been found to be associated with satisfaction with life (Benyamini et al. 2004, Garrido et al. 2013). Our study expands the methodological framework proposed by Rodríguez and Cabrera-Barona (2024) by incorporating a regression which is based on an artificial neural network, a non-linear approach not explored in the previous work. Furthermore, this study introduces spatial autocorrelation analysis, enabling the identification of statistically significant clusters and spatial outliers for life satisfaction. Overall, the research provides a complementary and more spatially explicit perspective on life satisfaction in Quito's historical downtown area.
Satisfaction with work, expressed as career satisfaction, and satisfaction with life are positively associated both cross-sectionally and longitudinally (Hagmaier et al. 2018). Furthermore, life satisfaction is generally regarded as an outcome of various work-related variables (e.g., job satisfaction, career satisfaction) (Erdogan et al. 2012). There is a methodological challenge in measuring subjective well-being which has often been present when analysing area-level units, such as blocks and neighbourhoods (Lucero et al. 2007). While these forms of spatial representation are valid, this study quantitatively assesses subjective well-being at the individual level, offering a more precise analysis. The applied spatial autocorrelation approach provides a versatile tool for analysing and representing patterns of life satisfaction in the HDQ. This is particularly important for urban planning and resource allocation at the local level, as it enables the detection of geographic disparities in well-being and supports evidence-based decision-making to address these inequalities effectively.
In particular, the high, life satisfaction hotspots identified through local Moran's I tend to coincide with areas where the artificial neural network model predicts higher levels of life satisfaction, which is primarily associated with greater satisfaction in health, work, and socioeconomic status. The spatial patterns observed may indicate that there are emerging dynamics in urban differentiation and socio-spatial restructuring within the HDQ. For example, the presence of satisfaction hotspots in the western peripheral areas of the HDQ, such as the road axis ‘24 de Mayo’, may reflect the early stages of urban transformation, possibly driven by recent public and private investment. In contrast, coldspots and areas with moderate predicted life satisfaction may be linked to depopulation, economic decline, or a reduction in urban services within certain sectors of the HDQ.
Leva (2005) argues that the analysis of life satisfaction should be understood as one of the primary objectives of public policy, as it reflects the fulfilment of needs related to citizens’ well-being. In a context in which public demands are increasingly visible, raising living standards becomes a critical issue on the agendas of both local and national administrations. The key challenge lies in formulating policies which promote this improvement by ensuring equitable access to the resources necessary to meet population needs. In this context, the measurement of life satisfaction becomes essential. Indicators and analytical frameworks developed for this purpose must not only capture objective aspects, such as resource availability, but also account for the subjective dimension: this relates to personal perceptions and individual characteristics which influence living standards in a multidimensional manner (Tonon 2010).
Recognition that there is an imperfect relationship between objective living conditions and individuals’ perceptions of their quality of life, highlights the complexity of evaluating well-being. This is precisely where the application of methodological approaches such as machine learning and spatial analysis becomes highly relevant, as they enable the visualisation and assessment of both subjective and objective indicators. The findings of this research represent a valuable resource for policy- and decision-makers, offering more precise, data-driven insights which are aligned with the real conditions and lived experiences of residents in the HDQ.
Mouratidis (2021) indicates that studies, such as the present investigation, provide valuable insights for improving quality of life in urban environments, which is of particular relevance to city planning. The ongoing processes of population growth and urbanisation have led to a significant increase in urban populations worldwide, making quality of life a critical concern for an ever-growing number of residents. Simultaneously, changes in the physical, demographic, economic, and social characteristics of cities are increasingly shaped by the evolving needs of their inhabitants. Therefore, understanding the relationship between various dimensions and life satisfaction in urban contexts can play a fundamental role in guiding both current and future urban development.
This investigation has certain limitations. While satisfaction across different domains of quality of life was analysed, it may not be sufficient to fully capture the multidimensional and nuanced nature of subjective well-being. There are relevant factors not included in this study which may also contribute to subjective wellbeing, such as ‘experiencing new things’ or ‘making other people happy’, elements which reflect emotional fulfilment, personal growth, and social connection, which can be difficult to quantify using conventional survey instruments (Crous et al. 2018). Objective factors which influence urban quality of life may have been overlooked in this study. An emphasis on subjectivity, while valuable, can limit the comparability and generalisability of results, as not all subjective metrics are easily quantifiable or directly comparable across different demographic groups or urban contexts. Future research could complement this investigation by incorporating objective indicators into the analysis—such as those related to material conditions, infrastructure, and access to basic services. Integrating both subjective and objective metrics into quality-of-life assessments would provide a richer and more comprehensive understanding of urban living conditions, enhancing the reliability and policy relevance of such evaluations.
Another limitation of this study is its reliance on a single survey, which, while rich in information, has not been replicated in recent years. As a result, this temporal constraint may provide an incomplete view of the city, as certain socioeconomic and demographic changes may not be captured. However, we believe that the study identifies key factors concerning urban quality of life which can be generalised to other study areas and temporal contexts. Future analyses could build upon this work by scaling up the developed models to suit broader contexts in order to capture more complex and emerging urban patterns. This type of research has strong potential for replicability, as the analytical methodology can be extrapolated to other areas of interest within both the urban and rural zones of the metropolitan district of Quito (MDQ), as well as within other cities.
The results of this study can provide both theoretical and methodological guidance for future empirical research. Furthermore, the investigation offers evidence-based insights to support urban planning efforts in the HDQ. Decision-makers can use the generated information to design tools which facilitate the development and implementation of targeted action plans. The municipality, for example, could formulate specific proposals, plans, or programmes for priority areas within the HDQ. These efforts could focus on improving citizens’ health through community medical brigades, or, regarding work and the local economy, on creating dedicated spaces for organised commerce in areas where low satisfaction levels have been identified. Collectively, these actions could enhance the well-being of residents and help prevent further abandonment of and migration from the area.
The present study offers several contributions to the scientific literature in the fields of geography, subjective well-being (happiness) studies, and urban studies. It contributes to the limited body of research which applies machine learning models to the analysis of life satisfaction at the individual level within an intra-urban context. This study identifies spatial patterns and clusters (hotspots and coldspots) associated with life satisfaction, thus innovatively bridging quantitative geography and happiness studies. It also demonstrates how machine learning methods can support urban planning and decision-making by providing spatialised evidence of subjective well-being patterns and identifying key predictors of life satisfaction in urban environments. The intra-urban scale of the analysis challenges the dominant trend in subjective well-being research, which is typically conducted at national or city-wide levels.
Overall, this investigation provides actionable insights for public policy in historical urban areas and contributes to expanding paradigms in geography by integrating methodologies from data science, subjective wellbeing studies, urban studies, and the social sciences, to examine complex urban phenomena such as life satisfaction.