
Figure 1.
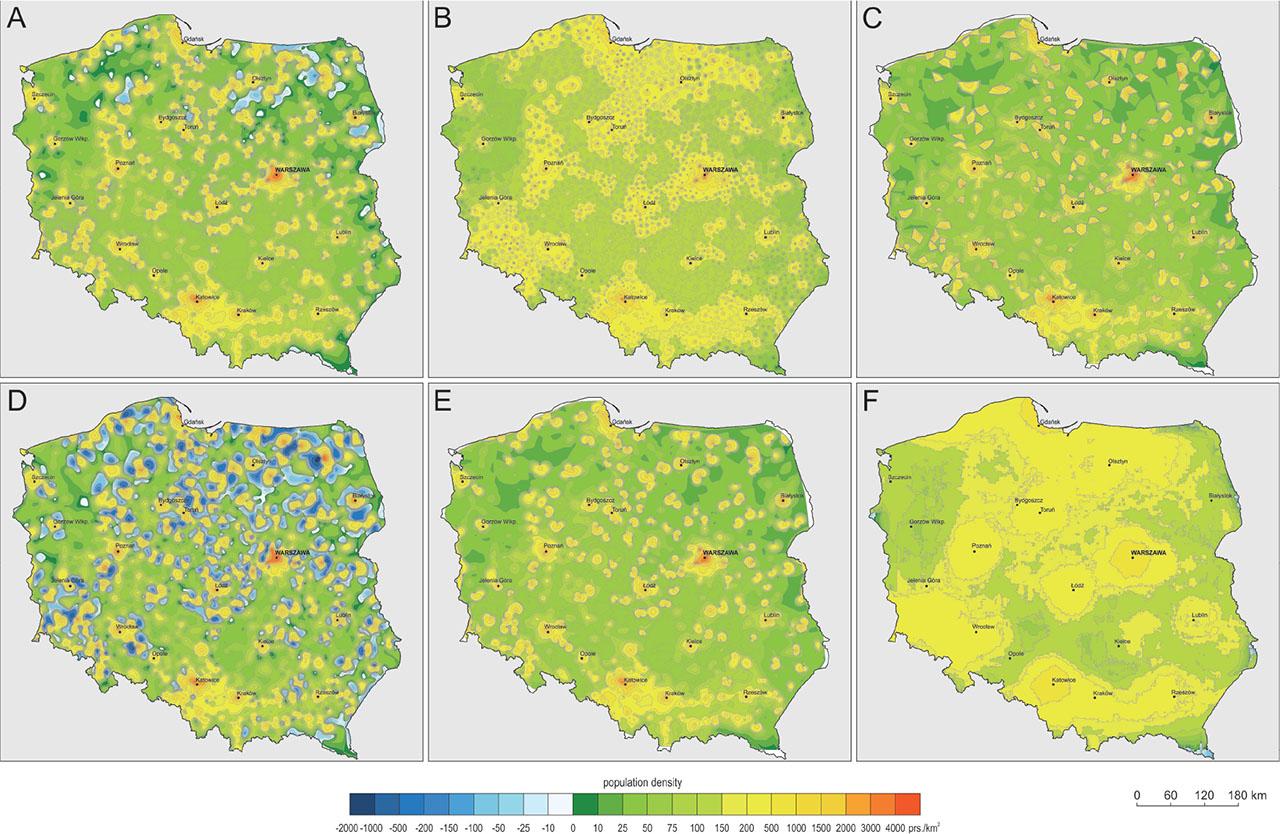
Figure 2.
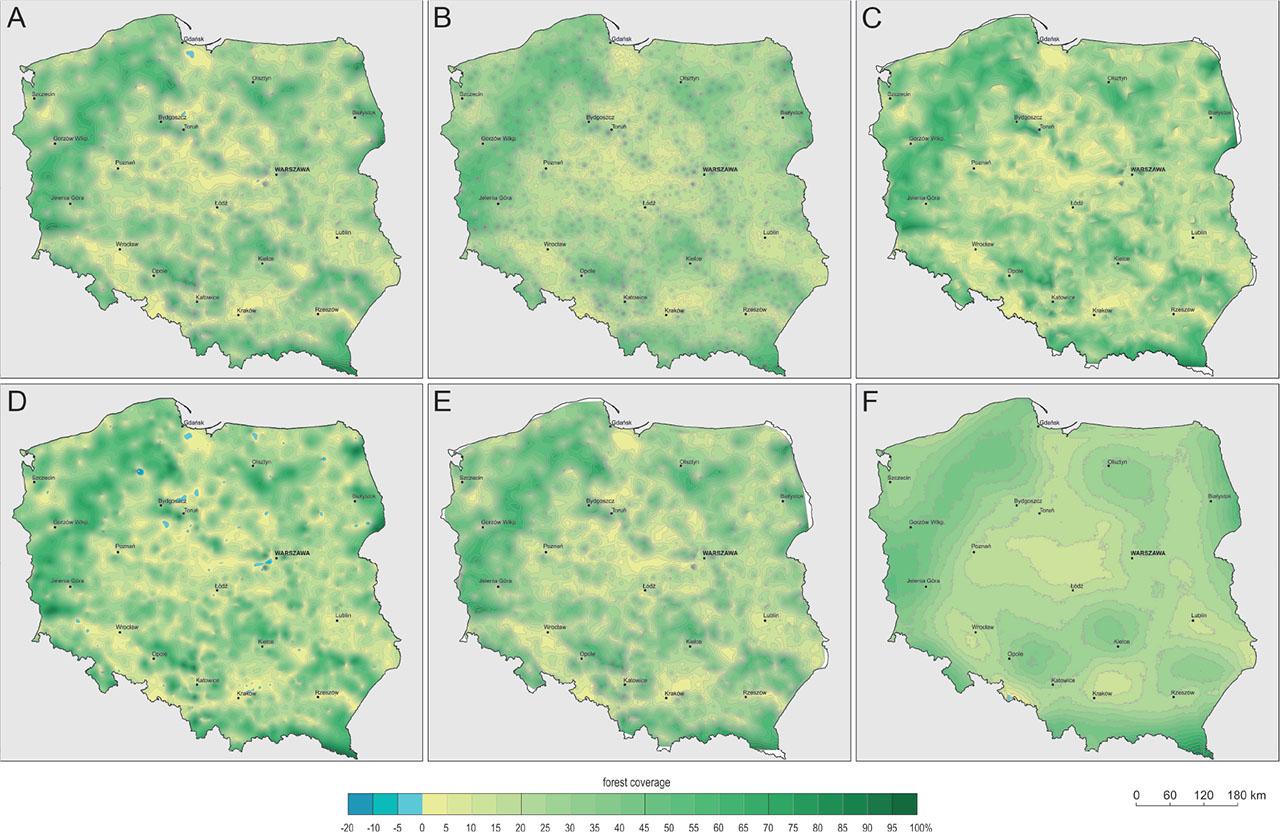
Figure 3.
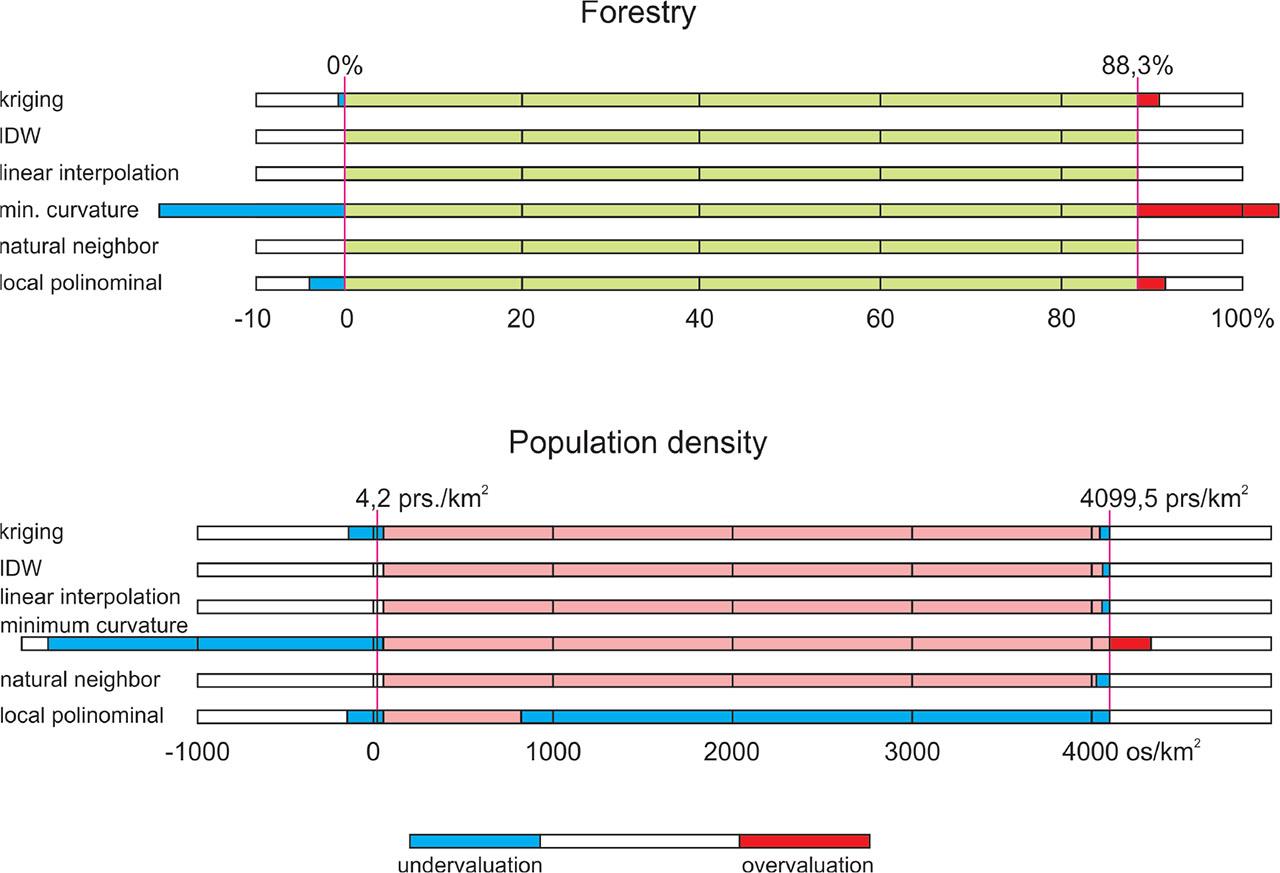
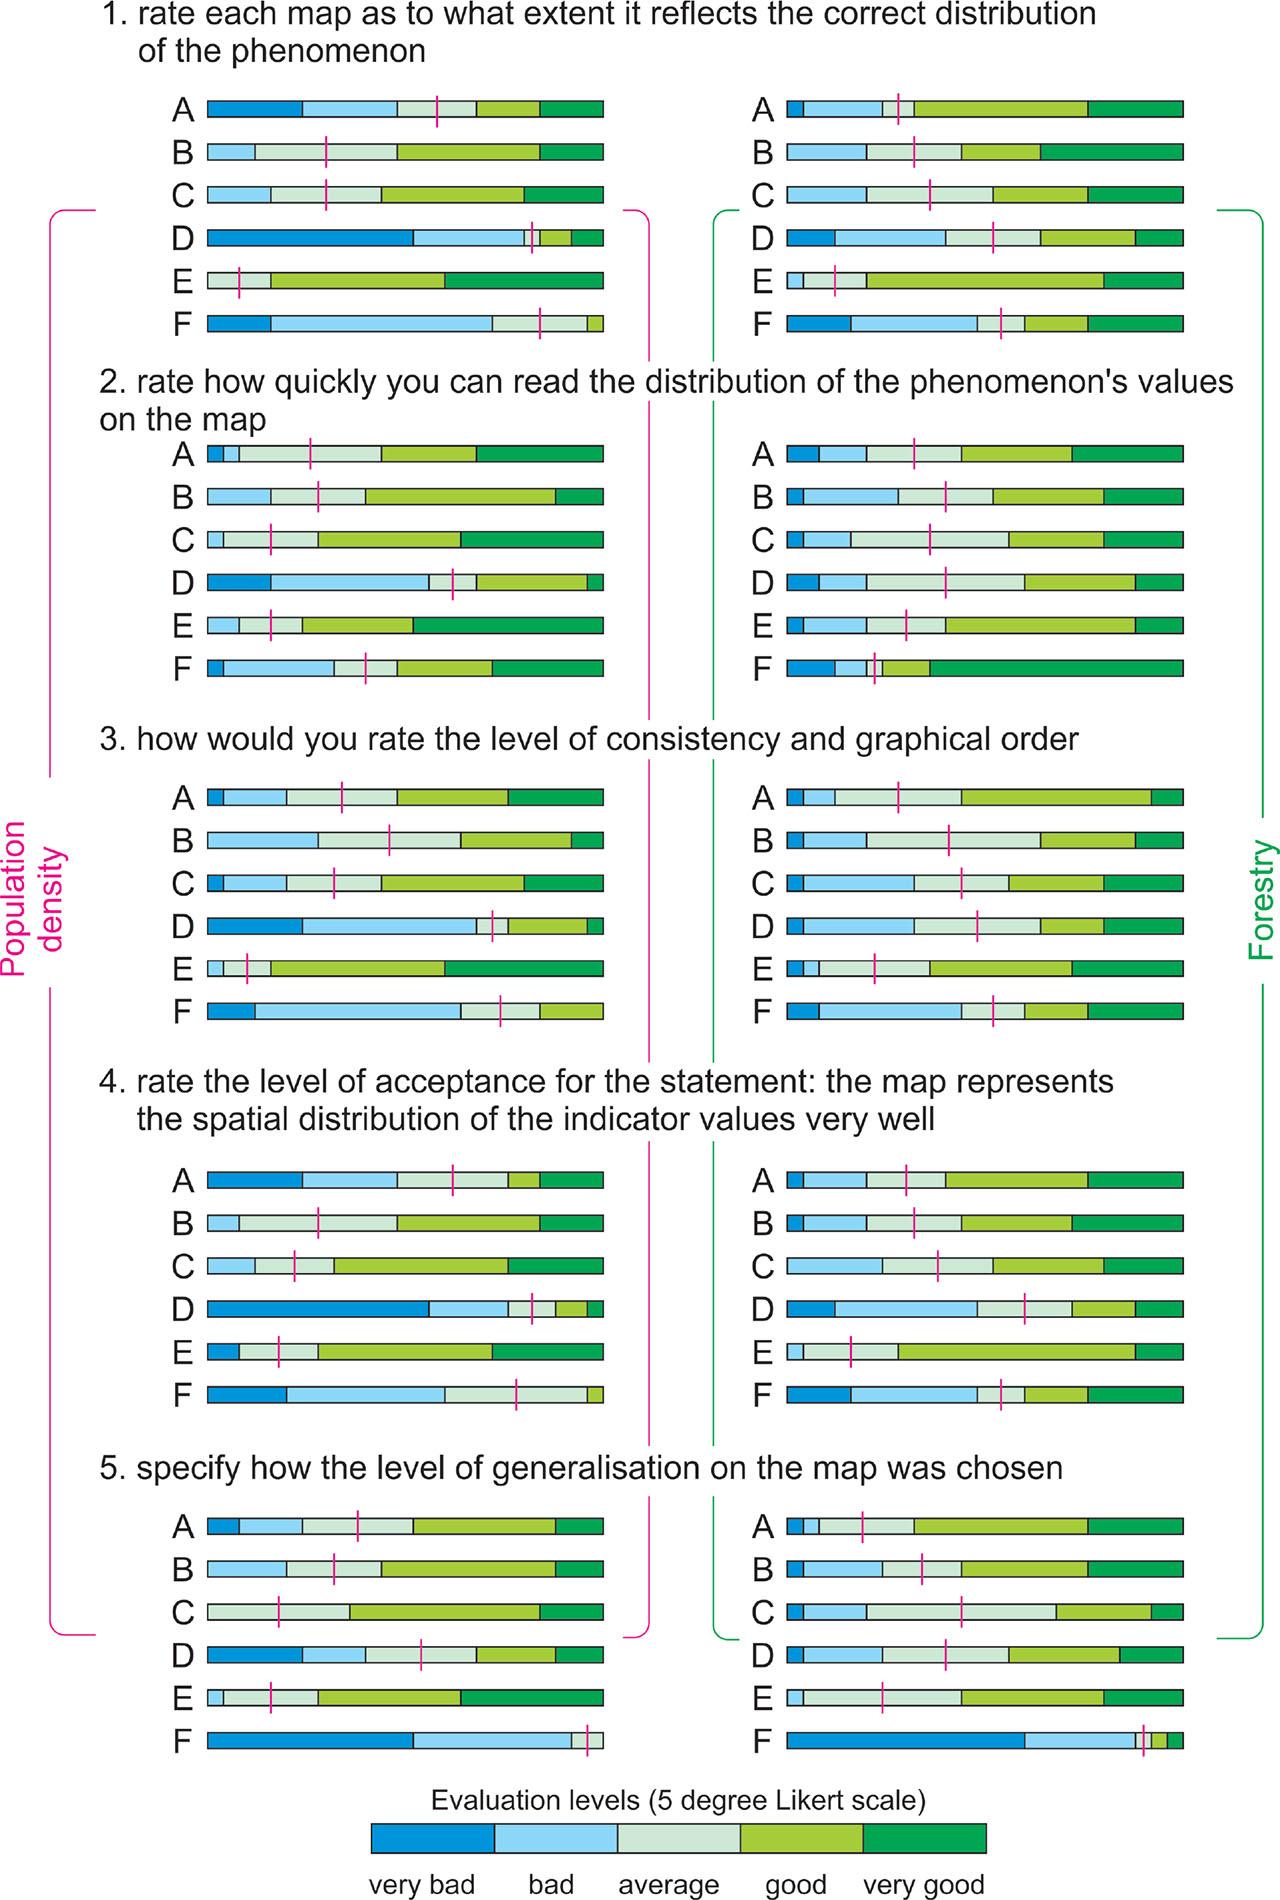
Figure 4.
Range of values of statistical plots representing forest cover and population density for six interpolation methods
| Data range | Interpolation method | |||||
|---|---|---|---|---|---|---|
| kriging | IDW | Linear interpolation | Minimum curvature | Natural neighbour | Local polynominal | |
| forest cover [%] | −0,6–90.7 | 0.01–88.3 | 0.05–88,3 | −20.9–103,8 | 0,05–88,3 | −3,36–91,4 |
| population density [prs./km2] | −140,9–4049,7 | 4,3–4067,4 | 4.3–4055,9 | −1847.9–4331.2 | 4.3–4026.1 | −148,5–836,3 |
Statistical volume of maps depending on the interpolation method used compared to the population of Poland
| Interpolation method | ||||||
|---|---|---|---|---|---|---|
| kriging | IDW | Linear interpolation | Minimum curvature | Natural neighbour | Local polynominal | |
| Volume [= residents] | 79 950 779 | 58 054 424 | 48 799 862 | 47 098 511 | 48 865 153 | 60 842 675 |
| too much about | +42 184 449 | +20 288 094 | +11 033 532 | +9 332 181 | +11 098 823 | +23 076 345 |
| Error [%] | 111, 7 | 53,7 | 29,2 | 24,7 | 29,4 | 61,1 |