
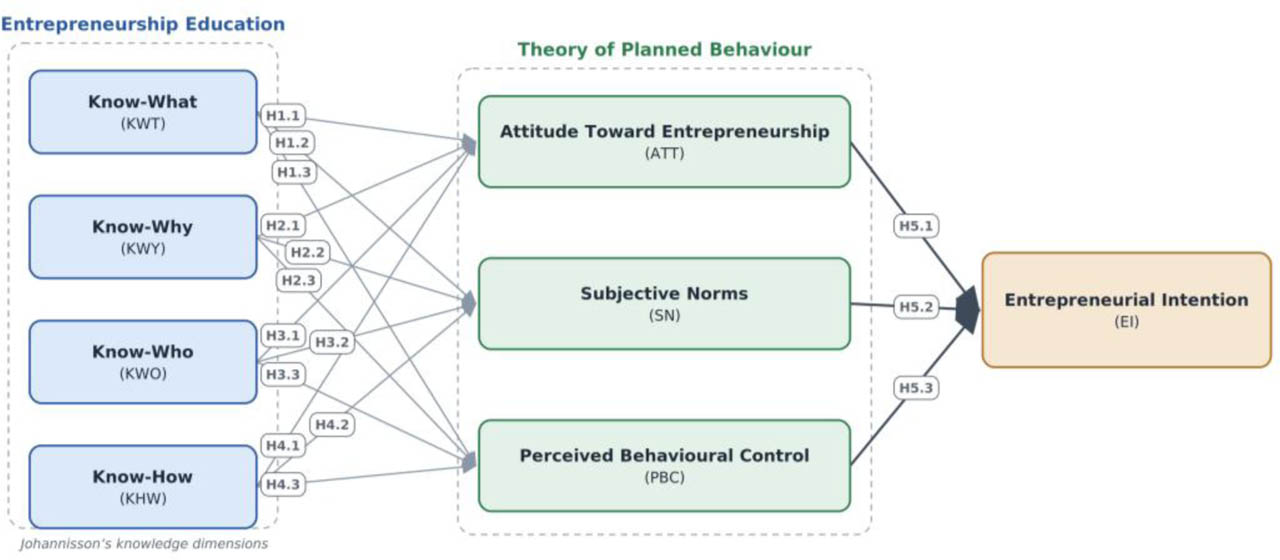
Figure 1.
Conceptual model of the study
Source: own processing
Table 1.
Measurement scales
| Construct (code) | Block | Items | Scale |
|---|---|---|---|
| Know-What (KWT) | Entrepreneurship Education | 5 | 1–7 Likert |
| Know-Why (KWY) | Entrepreneurship Education | 5 | 1–7 Likert |
| Know-Who (KWO) | Entrepreneurship Education | 5 | 1–7 Likert |
| Know-How (KHW) | Entrepreneurship Education | 5 | 1–7 Likert |
| Attitude (ATT) | TPB | 5 | 1–7 Likert |
| Subjective Norms (SN) | TPB | 7 | 1–7 Likert |
| Perceived Behavioral Control | TPB | 8 | 1–7 Likert |
| Entrepreneurial Intention (EI) | TPB | 6 | 1–7 Likert |
Table 2.
Demographic profile of respondents (n = 316)
| Variable | Category | N | % |
|---|---|---|---|
| Gender | Male | 118 | 37.3 |
| Female | 198 | 62.7 | |
| Age | 15–24 years | 230 | 72.8 |
| 25–39 years | 77 | 24.4 | |
| 40–55 years | 8 | 2.5 | |
| Over 55 years | 1 | 0.3 | |
| Marital status | Single | 289 | 91.5 |
| Married | 25 | 7.9 | |
| Divorced/Separated | 2 | 0.6 | |
| Widowed | 0 | 0.0 | |
| Academic level | First-year Bachelor’s (L1) | 4 | 1.3 |
| Second-year Bachelor’s (L2) | 21 | 6.6 | |
| Third-year Bachelor’s (L3) | 59 | 18.7 | |
| First-year Master’s (M1) | 27 | 8.5 | |
| Second-year Master’s (M2) | 200 | 63.3 | |
| PhD candidate | 5 | 1.6 | |
| Field of study | Economics, Business and Management | 129 | 40.8 |
| Technology | 63 | 19.9 | |
| Natural and Life/Earth Sciences | 31 | 9.8 | |
| Humanities and Social Sciences | 28 | 8.9 | |
| Sciences | 22 | 7.0 | |
| Language and Literature | 18 | 5.7 | |
| Law and Political Science | 14 | 4.4 | |
| Medicine | 11 | 3.5 | |
| Total | 316 | 100.0 | |
Table 3.
Outer loadings of the retained indicators
| Construct | Indicator | Outer loading |
|---|---|---|
| Attitude (ATT) | ATT1 | 0.859 |
| ATT2 | 0.904 | |
| ATT3 | 0.891 | |
| ATT4 | 0.704 | |
| Entrepreneurial Intention (EI) | EI1 | 0.832 |
| EI2 | 0.898 | |
| EI3 | 0.871 | |
| EI4 | 0.856 | |
| EI5 | 0.829 | |
| Know-What (KWT) | KWT1 | 0.809 |
| KWT2 | 0.880 | |
| KWT3 | 0.802 | |
| KWT4 | 0.856 | |
| KWT5 | 0.804 | |
| Know-Why (KWY) | KWY1 | 0.800 |
| KWY2 | 0.820 | |
| KWY3 | 0.809 | |
| KWY4 | 0.847 | |
| KWY5 | 0.856 | |
| Know-Who (KWO) | KWO1 | 0.825 |
| KWO2 | 0.860 | |
| KWO3 | 0.848 | |
| KWO4 | 0.780 | |
| KWO5 | 0.816 | |
| Know-How (KHW) | KHW1 | 0.852 |
| KHW2 | 0.889 | |
| KHW3 | 0.856 | |
| KHW4 | 0.812 | |
| KHW5 | 0.831 | |
| Perceived Behavioral Control (PBC) | PBC1 | 0.766 |
| PBC2 | 0.881 | |
| PBC3 | 0.883 | |
| PBC4 | 0.735 | |
| Subjective Norms (SN) | SN1 | 0.888 |
| SN2 | 0.899 | |
| SN3 | 0.910 |
Table 4.
Construct reliability and convergent validity
| Construct | Cronbach’s α | rho_a | rho_c | AVE |
|---|---|---|---|---|
| ATT | 0.862 | 0.882 | 0.907 | 0.711 |
| EI | 0.910 | 0.910 | 0.933 | 0.736 |
| KWT | 0.888 | 0.897 | 0.917 | 0.690 |
| KWY | 0.884 | 0.887 | 0.915 | 0.683 |
| KWO | 0.884 | 0.888 | 0.915 | 0.683 |
| KHW | 0.903 | 0.904 | 0.928 | 0.720 |
| PBC | 0.838 | 0.886 | 0.890 | 0.670 |
| SN | 0.883 | 0.895 | 0.927 | 0.809 |
Table 5.
Fornell–Larcker criterion
| Construct | ATT | EI | KHW | KWT | KWO | KWY | PBC | SN |
|---|---|---|---|---|---|---|---|---|
| ATT | 0.843 | |||||||
| EI | 0.714 | 0.858 | ||||||
| KHW | 0.632 | 0.562 | 0.849 | |||||
| KWT | 0.512 | 0.516 | 0.687 | 0.831 | ||||
| KWO | 0.604 | 0.592 | 0.647 | 0.623 | 0.826 | |||
| KWY | 0.660 | 0.641 | 0.659 | 0.700 | 0.711 | 0.827 | ||
| PBC | 0.544 | 0.598 | 0.473 | 0.366 | 0.407 | 0.449 | 0.819 | |
| SN | 0.422 | 0.432 | 0.298 | 0.297 | 0.448 | 0.384 | 0.370 | 0.899 |
Table 6.
Heterotrait–monotrait ratio (HTMT)
| Construct | ATT | EI | KHW | KWT | KWO | KWY | PBC |
|---|---|---|---|---|---|---|---|
| EI | 0.799 | ||||||
| KHW | 0.713 | 0.617 | |||||
| KWT | 0.577 | 0.566 | 0.764 | ||||
| KWO | 0.683 | 0.656 | 0.717 | 0.697 | |||
| KWY | 0.748 | 0.713 | 0.736 | 0.787 | 0.799 | ||
| PBC | 0.620 | 0.650 | 0.529 | 0.409 | 0.445 | 0.499 | |
| SN | 0.480 | 0.474 | 0.334 | 0.330 | 0.502 | 0.430 | 0.408 |
Table 7.
Collinearity of the internal model (VIF)
| Path | VIF | Path | VIF |
|---|---|---|---|
| KHW → ATT | 2.307 | KWY → ATT | 2.688 |
| KHW → PBC | 2.307 | KWY → PBC | 2.688 |
| KHW → SN | 2.307 | KWY → SN | 2.688 |
| KWT → ATT | 2.418 | ATT → EI | 1.543 |
| KWT → PBC | 2.418 | PBC → EI | 1.470 |
| KWT → SN | 2.418 | SN → EI | 1.259 |
| KWO → ATT/PBC/SN | 2.319 |
Table 8.
Coefficient of determination (R2)
| Construct | R2 | Adjusted R2 |
|---|---|---|
| ATT | 0.519 | 0.513 |
| EI | 0.582 | 0.579 |
| PBC | 0.261 | 0.251 |
| SN | 0.210 | 0.200 |
Table 9.
Effect sizes (f2)
| Predictor | → ATT | → PBC | → SN | → EI |
|---|---|---|---|---|
| KWT (Know-What) | 0.007 | 0.002 | 0.000 | — |
| KWY (Know-Why) | 0.112 | 0.026 | 0.011 | — |
| KWO (Know-Who) | 0.028 | 0.004 | 0.074 | — |
| KHW (Know-How) | 0.097 | 0.056 | 0.000 | — |
| ATT | — | — | — | 0.414 |
| PBC | — | — | — | 0.124 |
| SN | — | — | — | 0.024 |
Table 10.
Direct path coefficients (bootstrapping, 5,000 subsamples)
| Path | β (O) | Sample mean | Standard deviation | T statistics | p | 95% CI |
|---|---|---|---|---|---|---|
| ATT → EI | 0.516 | 0.519 | 0.052 | 9.878 | 0.000 | [0.418, 0.622] |
| PBC → EI | 0.276 | 0.274 | 0.053 | 5.229 | 0.000 | [0.167, 0.375] |
| SN → EI | 0.113 | 0.112 | 0.042 | 2.663 | 0.008 | [0.027, 0.196] |
| KWT → ATT | −0.090 | −0.088 | 0.068 | 1.321 | 0.186 | [−0.223, 0.042] |
| KWT → PBC | −0.055 | −0.053 | 0.083 | 0.654 | 0.513 | [−0.214, 0.112] |
| KWT → SN | −0.023 | −0.018 | 0.084 | 0.270 | 0.787 | [−0.181, 0.147] |
| KWY → ATT | 0.380 | 0.379 | 0.075 | 5.086 | <0.001 | [0.227, 0.525] |
| KWY → PBC | 0.227 | 0.227 | 0.092 | 2.480 | 0.013 | [0.044, 0.402] |
| KWY → SN | 0.156 | 0.151 | 0.104 | 1.494 | 0.135 | [−0.056, 0.348] |
| KWO → ATT | 0.177 | 0.179 | 0.067 | 2.644 | 0.008 | [0.052, 0.313] |
| KWO → PBC | 0.080 | 0.081 | 0.083 | 0.957 | 0.339 | [−0.083, 0.246] |
| KWO → SN | 0.369 | 0.373 | 0.089 | 4.127 | <0.001 | [0.201, 0.547] |
| KHW → ATT | 0.328 | 0.328 | 0.065 | 5.072 | <0.001 | [0.199, 0.456] |
| KHW → PBC | 0.309 | 0.308 | 0.074 | 4.165 | <0.001 | [0.167, 0.453] |
| KHW → SN | −0.027 | −0.031 | 0.089 | 0.304 | 0.761 | [−0.199, 0.143] |