
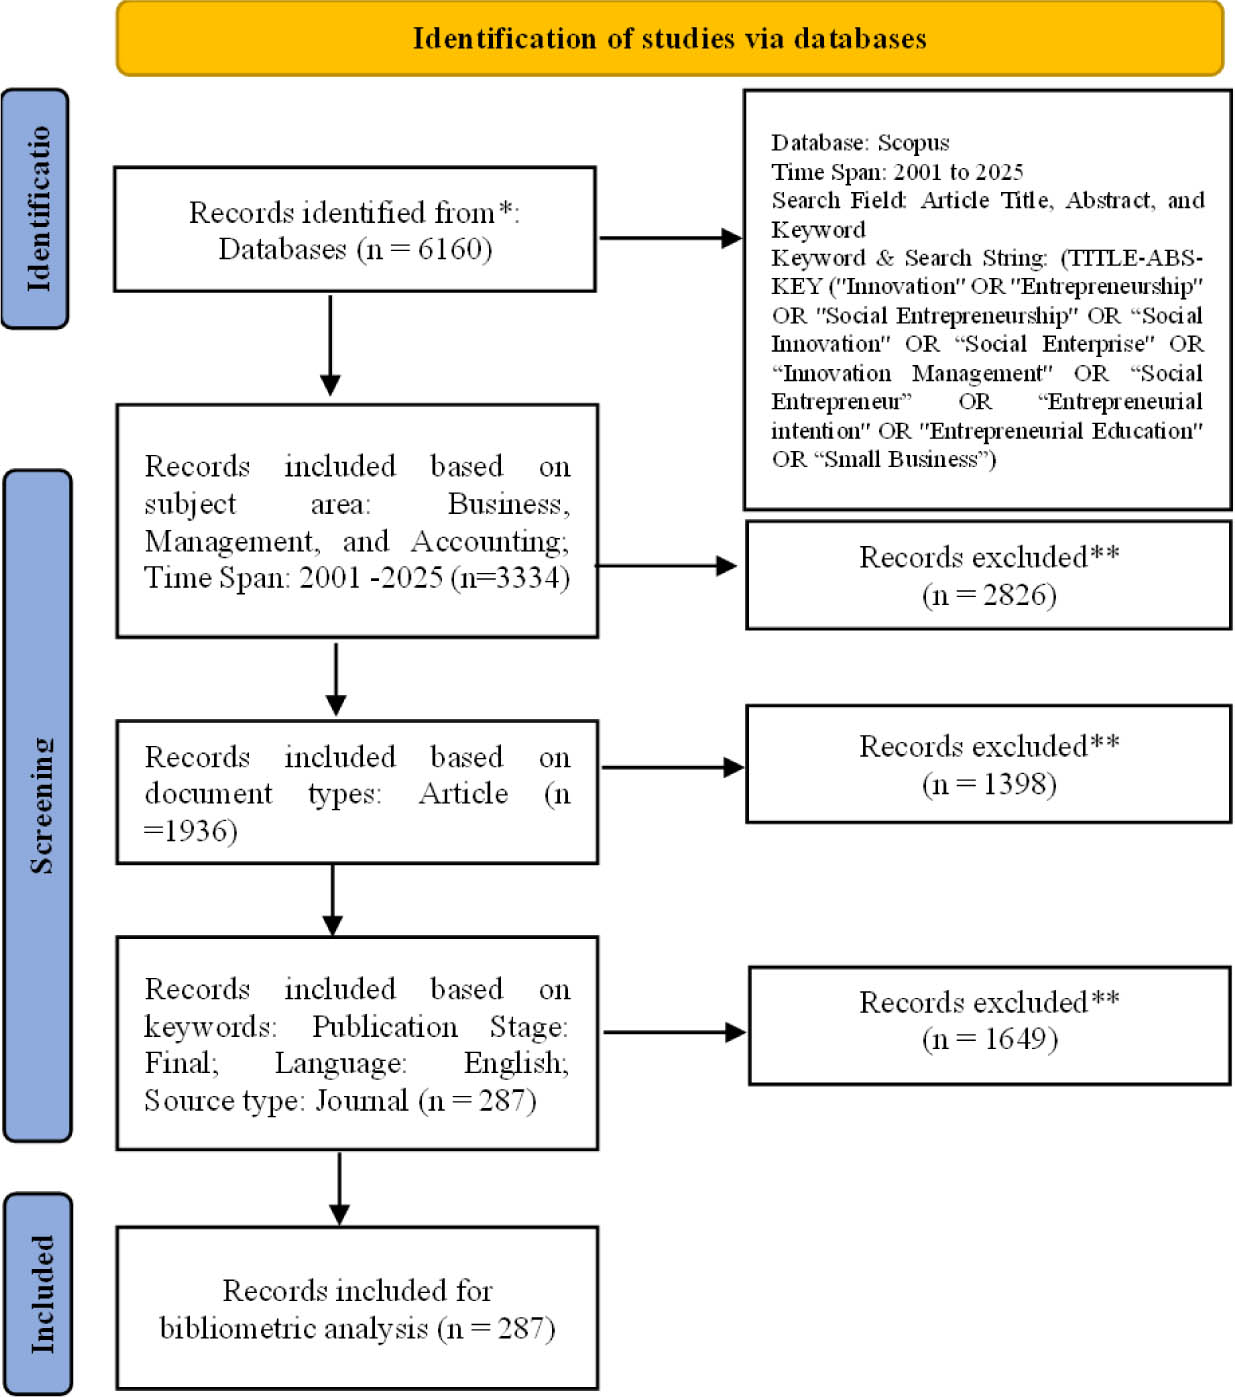
Figure 1.
Search strategy
Source: own processing
Table 1.
Descriptive statistics
| Description | Results |
|---|---|
| MAIN INFORMATION ABOUT DATA | |
| Timespan | 2001:2025 |
| Sources (Journals, Books, etc.) | 132 |
| Documents | 287 |
| Annual Growth Rate (%) | 12.53 |
| Document Average Age | 7.06 |
| Average citations per document | 54.03 |
| References | 2174 |
| DOCUMENT CONTENTS | |
| Keywords Plus (ID) | 533 |
| Author's Keywords (DE) | 849 |
| AUTHORS | |
| Authors | 558 |
| Authors of single-authored documents | 21 |
| AUTHORS' COLLABORATION | |
| Single-authored documents | 33 |
| Co-authors per document | 2.99 |
| International co-authorships (%) | 39.72 |
| DOCUMENT TYPES | |
| Article | 287 |
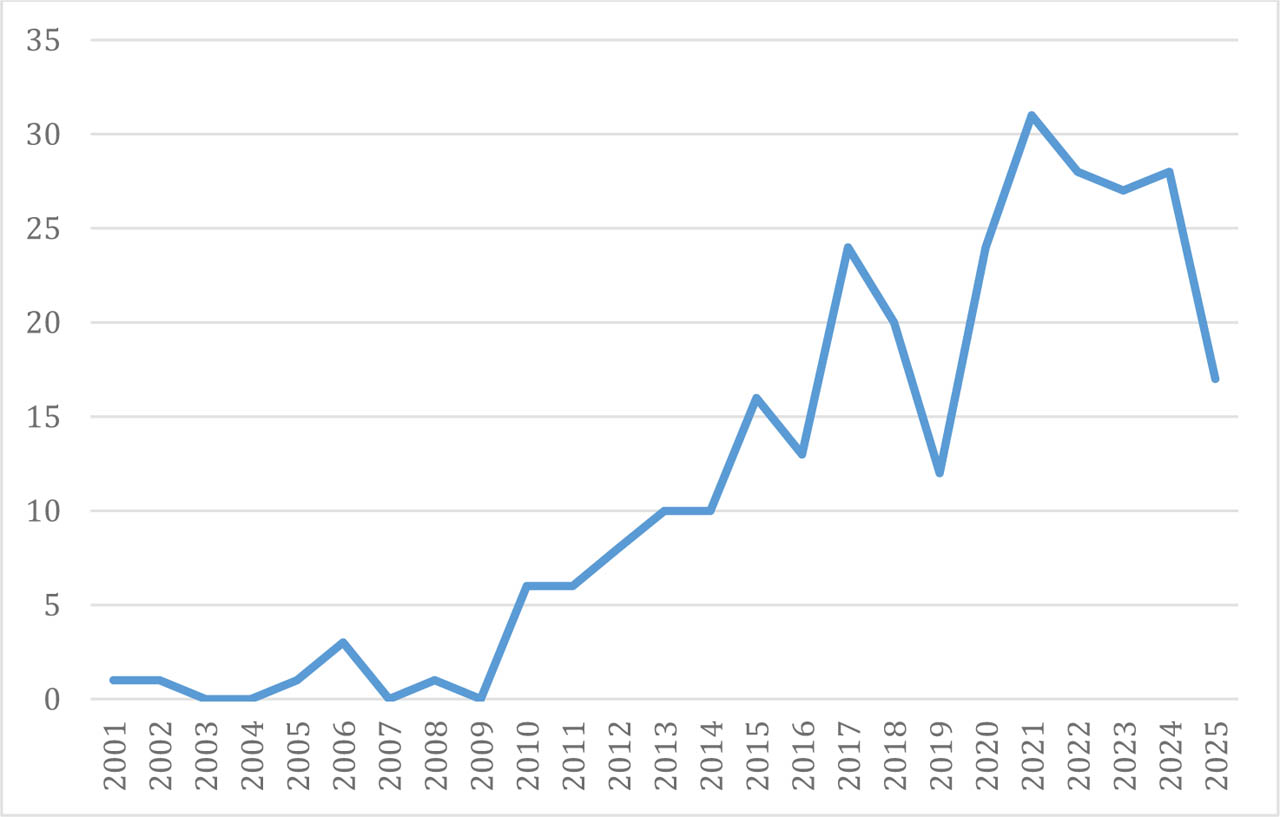
Figure 2.
Annual scientific production
Source: own processing
Table 2.
Average citation per year
| Year | Mean TC per Article | N | Mean TC per Year | Citable Years |
|---|---|---|---|---|
| 2001 | 83.00 | 1 | 3.19 | 26 |
| 2002 | 40.00 | 1 | 1.60 | 25 |
| 2005 | 253.00 | 1 | 11.50 | 22 |
| 2006 | 264.00 | 3 | 12.57 | 21 |
| 2008 | 63.00 | 1 | 3.32 | 19 |
| 2010 | 68.33 | 6 | 4.02 | 17 |
| 2011 | 197.50 | 6 | 12.34 | 16 |
| 2012 | 105.88 | 8 | 7.06 | 15 |
| 2013 | 84.00 | 10 | 6.00 | 14 |
| 2014 | 113.30 | 10 | 8.72 | 13 |
| 2015 | 37.81 | 16 | 3.15 | 12 |
| 2016 | 80.23 | 13 | 7.29 | 11 |
| 2017 | 58.50 | 24 | 5.85 | 10 |
| 2018 | 53.05 | 20 | 5.89 | 9 |
| 2019 | 184.25 | 12 | 23.03 | 8 |
| 2020 | 23.38 | 24 | 3.34 | 7 |
| 2021 | 38.68 | 31 | 6.45 | 6 |
| 2022 | 36.00 | 28 | 7.20 | 5 |
| 2023 | 16.41 | 27 | 4.10 | 4 |
| 2024 | 9.39 | 28 | 3.13 | 3 |
| 2025 | 3.76 | 17 | 1.88 | 2 |
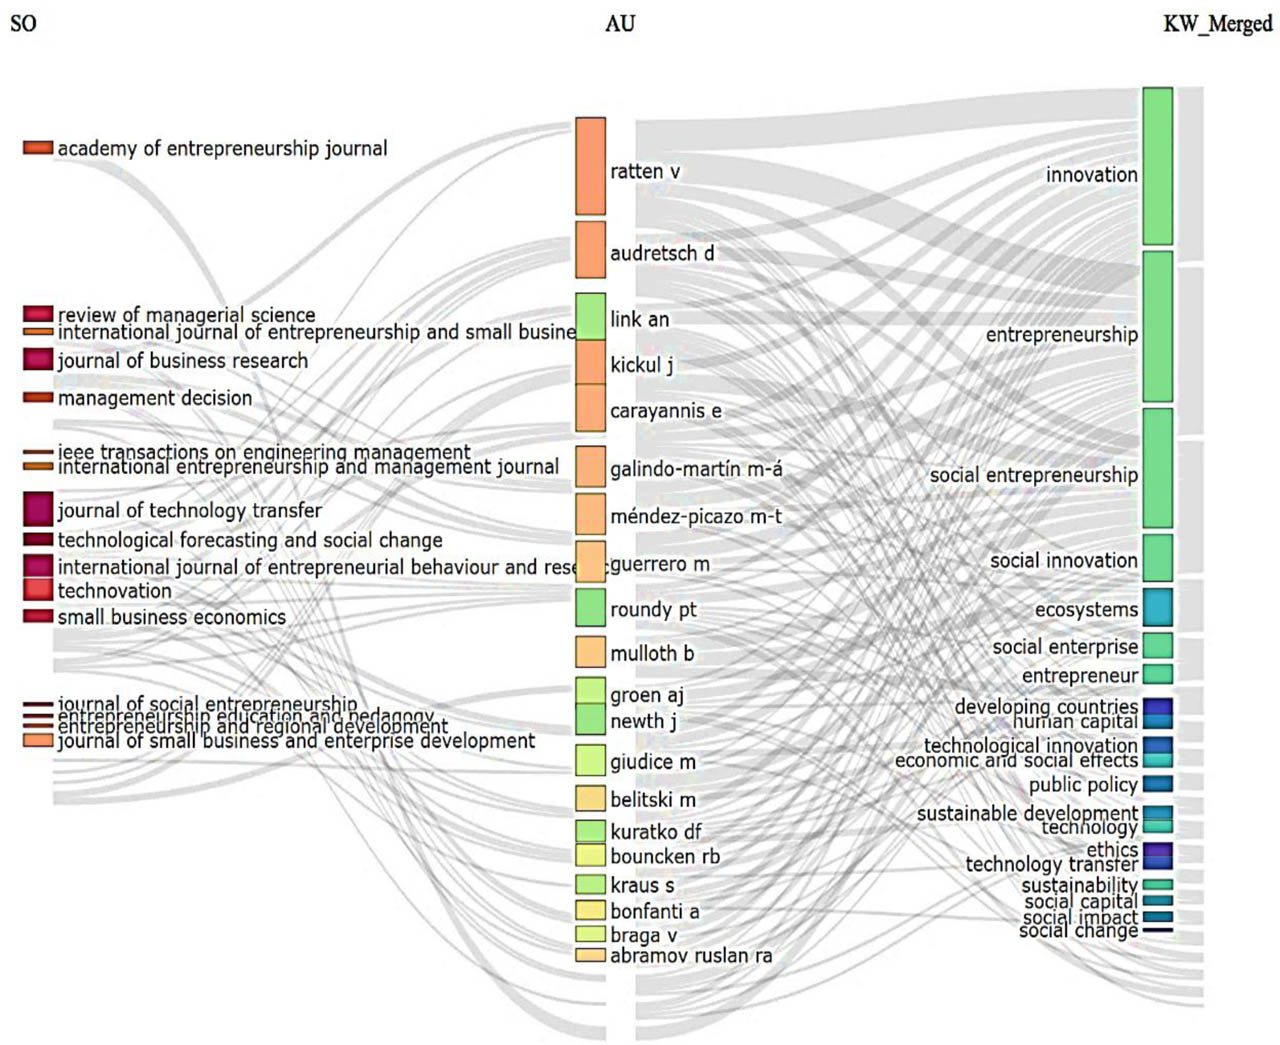
Figure 3.
Three-field plot
Source: own processing
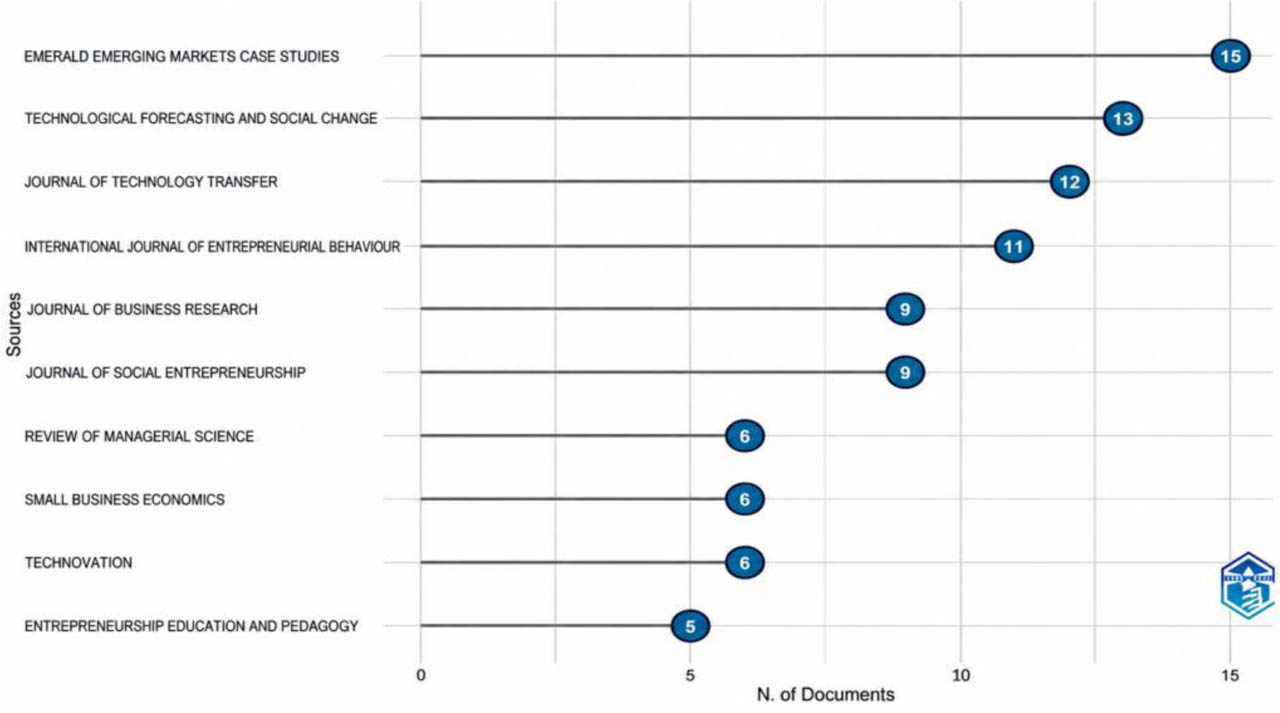
Figure 4.
Most relevant sources
Source: own processing
Table 3.
Core sources by Bradford’s law
| Sources | Frequency | Bradford’s Law | |
|---|---|---|---|
| Rank | Zone | ||
| Emerald Emerging Markets Case Studies | 15 | 1 | Zone 1 |
| Technological Forecasting and Social Change | 13 | 2 | Zone 1 |
| Journal of Technology Transfer | 12 | 3 | Zone 1 |
| International Journal of Entrepreneurial Behaviour and Research | 11 | 4 | Zone 1 |
| Journal of Business Research | 9 | 5 | Zone 1 |
| Journal of Social Entrepreneurship | 9 | 6 | Zone 1 |
| Review of Managerial Science | 6 | 7 | Zone 1 |
| Small Business Economics | 6 | 8 | Zone 1 |
| Technovation | 6 | 9 | Zone 1 |
| Entrepreneurship Education and Pedagogy | 5 | 10 | Zone 1 |
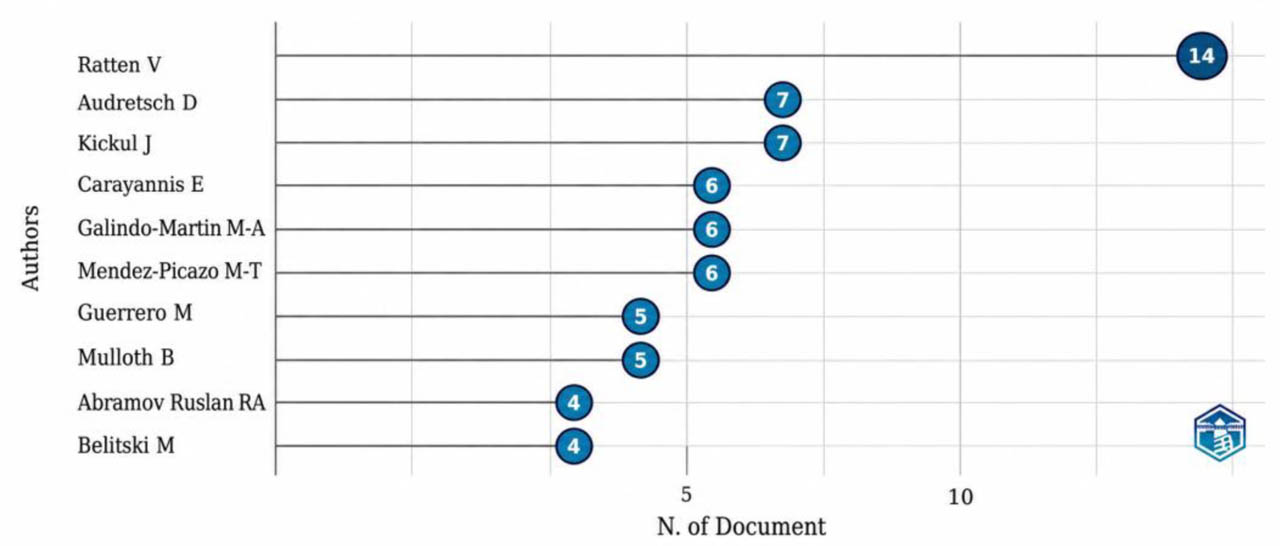
Figure 5.
Most relevant authors
Source: own processing
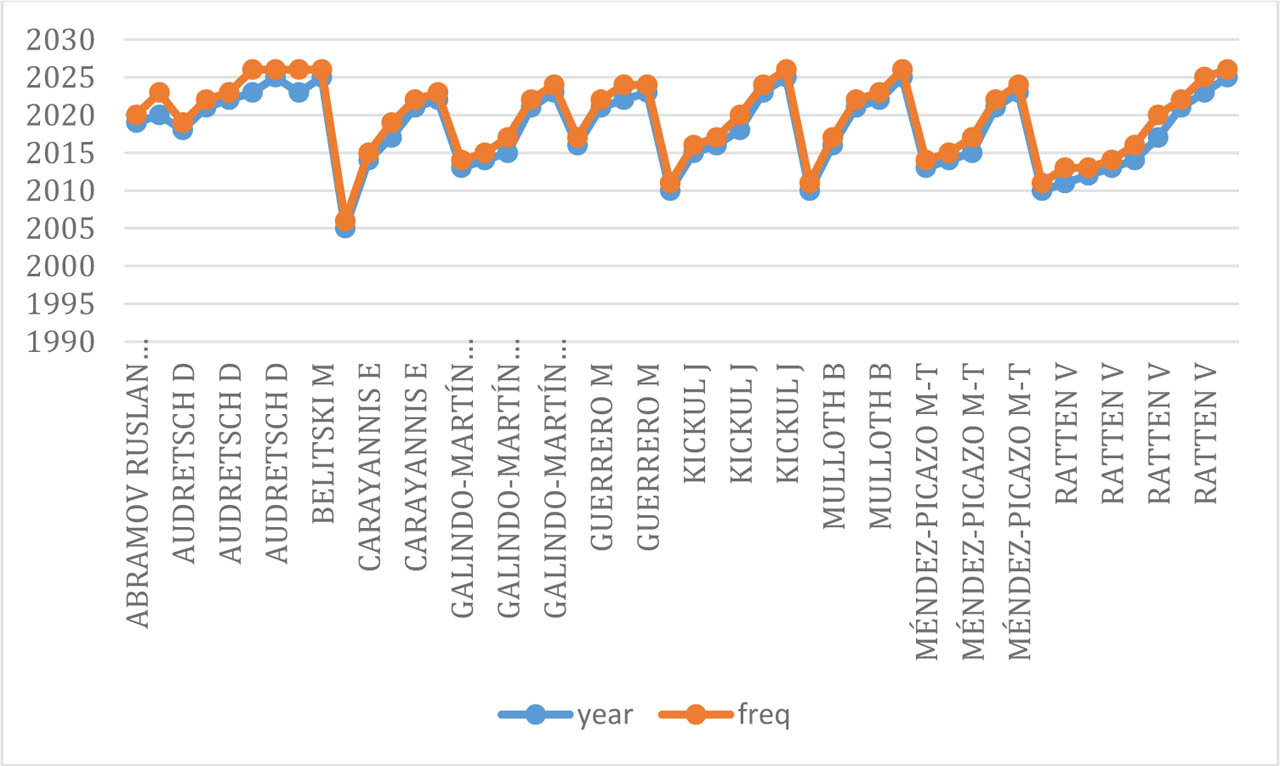
Figure 6.
Authors’ production over time
Source: own processing
Table 4.
Most global cited documents
| Authors | Articles | Citations | Journal |
|---|---|---|---|
| Nambisan et al. (2019) | The digital transformation of innovation and entrepreneurship: Progress, challenges and key themes | 1814 | Research Policy |
| Dacin et al. (2011) | Social Entrepreneurship: A critique and future directions | 1053 | Organization Science |
| Bercovitz and Feldman (2006) | Entpreprenerial universities and technology transfer: A Conceptual framework for understanding knowledge-based economic development | 637 | The Journal of Technology Transfer |
| Guerrero et al. (2016) | Entrepreneurial universities: Emerging models in the new social and economic landscape | 348 | Small Business Economics |
| Galindo and Méndez (2014) | Entrepreneurship, economic growth, and innovation: Are feedback effects at work? | 344 | Journal of Business Research |
| Hall et al. (2012) | Entrepreneurship and innovation at the base of the pyramid: A recipe for inclusive growth or social exclusion? | 334 | Journal of Management Studies |
| Bradley et al. (2012) | Capital is not enough: innovation in developing economies | 282 | Journal of Management Studies |
| Carayannis and Von Zedtwitz (2005) | Architecting gloCal (global–local), real-virtual incubator networks (G-RVINs) as catalysts and accelerators of entrepreneurship in transitioning and developing economies: Lessons learned and best practices from current development and business incubation practices. | 253 | Technovation |
| Scuotto et al. (2017) | The effect of social networking sites and absorptive capacity on SMES’ innovation performance | 247 | The Journal of Technology Transfer, |
| Agnete Alsos et al. (2013) | Gender and innovation: State of the art and a research agenda | 242 | International Journal of Gender and Entrepreneurship |
Table 5.
Most local cited documents
| Authors | Articles | Citations | Journal |
| Bacq et al. (2015) | Bricolage in social entrepreneurship: how creative resource mobilization fosters greater social impact | 7 | The International Journal of Entrepreneurship and Innovation |
| Dacin et al. (2011) | Social entrepreneurship: A critique and future directions | 5 | Organization Science |
| Audretsch et al. (2022) | Emerging needs of social innovators and social innovation ecosystems | 2 | International Entrepreneurship and Management Journal |
| Bhatt and Altinay (2013) | How social capital is leveraged in social innovations under resource constraints?” | 2 | Management Decision |
| Agnete Alsos et al. (2013) | Gender and innovation: State of the art and a research agenda | 2 | International Journal of Gender and Entrepreneurship |
| Adomako and Nguyen (2024) | Responsible entrepreneurship, social innovation, and entrepreneurial performance: Does commitment to SDGs matter? | 1 | Business Strategy and the Environment |
| Bouncken and Kraus (2022) | Entrepreneurial ecosystems in an interconnected world: Emergence, governance and digitalization | 1 | Review of Managerial Science |
| do Adro et al. (2021) | Social entrepreneurship orientation and performance in non-profit organizations | 1 | International Entrepreneurship and Management Journal |
| Bodolica et al. (2021) | Extracurricular activities and social entrepreneurial leadership of graduating youth in universities from the Middle East | 1 | The International Journal of Management Education |
| Baier-Fuentes et al. (2021) | Does triple helix collaboration matter for the early internationalisation of technology-based firms in emerging Economies? | 1 | Technological Forecasting and Social Change |
Table 6.
Most locally cited references
| Authors | References | Local citations | Journal |
|---|---|---|---|
| Austin et al. (2012) | Social and commercial entrepreneurship: Same, different, or both? | 53 | Revista de Administração |
| Bacq and Janssen (2011) | Social entrepreneurship: How creative resource mobilization fosters greater social impact | 22 | The International Journal of Entrepreneurship and Innovation |
| Alvord et al. (2004) | Social entrepreneurship and societal transformation: An exploratory study | 20 | The Journal of Applied Behavioral Science |
| Battilana and Lee (2014) | Advancing research on hybrid organizing—insights from the study of social enterprises | 13 | Academy of Management Annals |
| Battilana and Dorado (2010) | Building Sustainable Hybrid Organizations: The Case of Commercial Microfinance Organizations | 13 | Academy of Management Journal |
| Klein et al. (2012) | Strategic Entrepreneurship | 12 | SSRN Electronic Journal |
| Schiederig et al. (2012) | Green innovation in technology and innovation management—an exploratory literature review” in the journal | 11 | R&D Management |
| Baker and Nelson (2005) | Creating Something from Nothing: Resource Construction through Entrepreneurial Bricolage | 10 | Administrative Science Quarterly |
| Bornstein (2004) | How to change the world: Social entrepreneurs and the power of new ideas | 10 | Oxford University Press |
| Gephart (2004) | Qualitative research and the Academy of Management Journal | 8 | Academy of Management Journal |
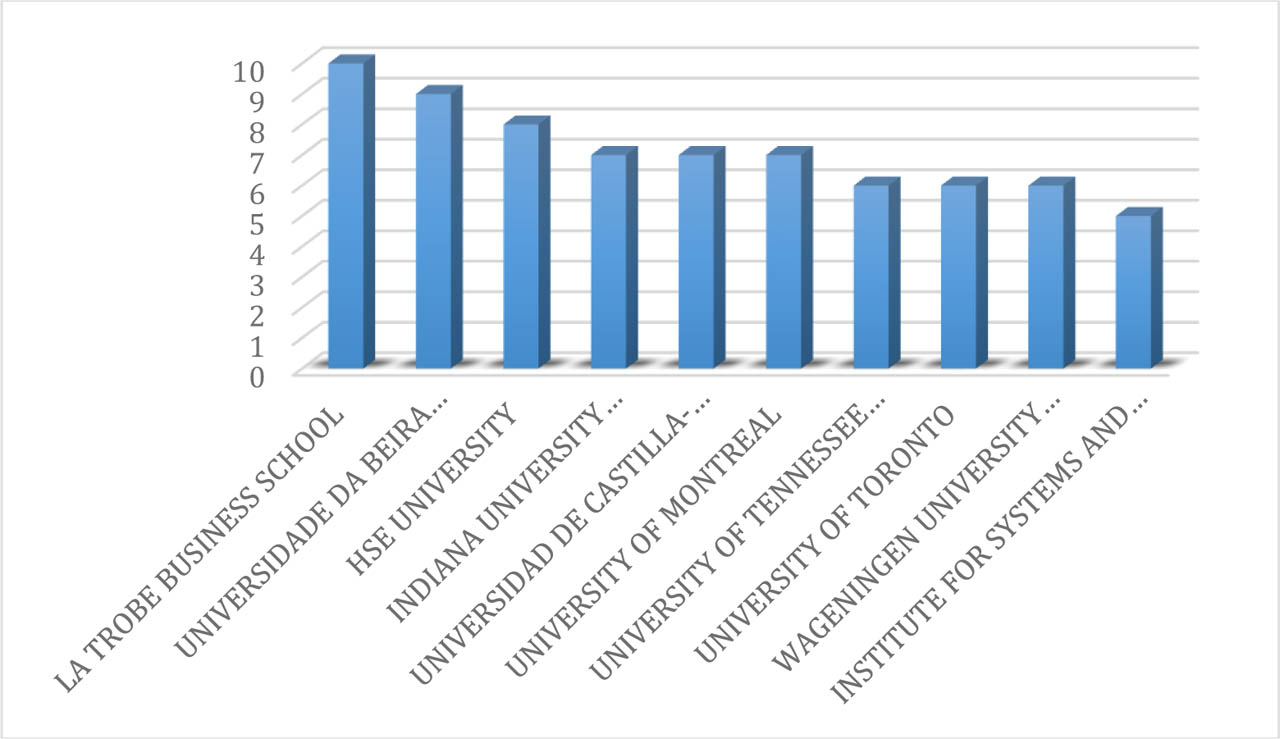
Figure 7.
Most relevant affiliations
Source: own processing
Table 7.
Sources’ local impact by H index
| No. | Source | h_index | TC |
|---|---|---|---|
| 1 | Journal of Technology Transfer | 10 | 1209 |
| 2 | Technological Forecasting and Social Change | 10 | 808 |
| 3 | Journal of Business Research | 9 | 1103 |
| 4 | International Journal of Entrepreneurial Behaviour And Research | 7 | 305 |
| 5 | Journal of Social Entrepreneurship | 7 | 276 |
| 6 | Review of Managerial Science | 6 | 437 |
| 7 | Small Business Economics | 6 | 830 |
| 8 | Management Decision | 5 | 321 |
| 9 | Technovation | 5 | 431 |
| 10 | Entrepreneurship Education and Pedagogy | 4 | 136 |
Table 8.
Countries’ scientific production
| No. | Country | Frequency | S.N. | Country | Frequency |
|---|---|---|---|---|---|
| 1 | USA | 153 | 11 | Malaysia | 17 |
| 2 | UK | 66 | 12 | Germany | 16 |
| 3 | Italy | 48 | 13 | South Africa | 14 |
| 4 | Canada | 42 | 14 | Sweden | 14 |
| 5 | Australia | 39 | 15 | New Zealand | 13 |
| 6 | Portugal | 36 | 16 | Brazil | 11 |
| 7 | Spain | 32 | 17 | Indonesia | 9 |
| 8 | France | 30 | 18 | Mexico | 8 |
| 9 | India | 30 | 19 | Ukraine | 8 |
| 10 | Netherlands | 20 | 20 | Belgium | 6 |
Table 9.
Most cited countries
| No. | Country | TC | Average article citations |
|---|---|---|---|
| 1 | USA | 5328 | 113.40 |
| 2 | Canada | 1525 | 127.10 |
| 3 | Spain | 1327 | 120.60 |
| 4 | Australia | 1064 | 50.70 |
| 5 | United Kingdom | 1005 | 47.90 |
| 6 | Germany | 540 | 90.00 |
| 7 | Italy | 436 | 29.10 |
| 8 | New Zealand | 382 | 63.70 |
| 9 | Portugal | 315 | 26.20 |
| 10 | India | 198 | 15.20 |
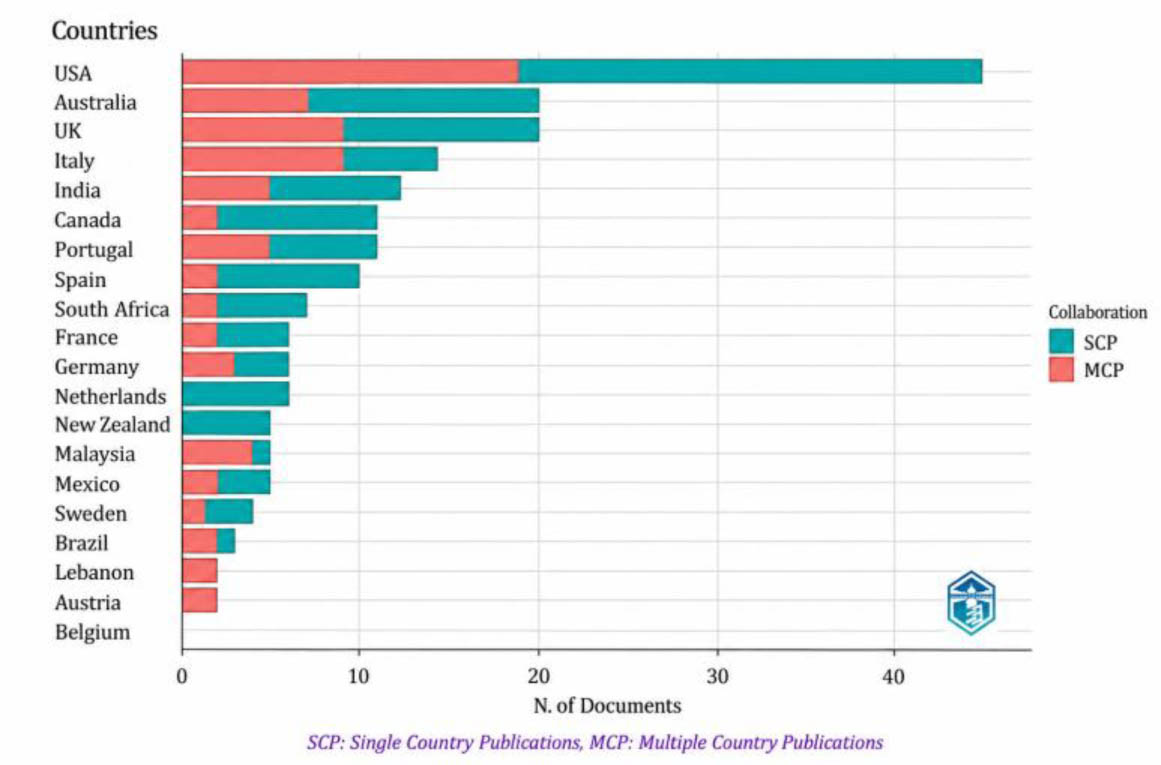
Figure 8.
Corresponding author’s countries
Source: own processing
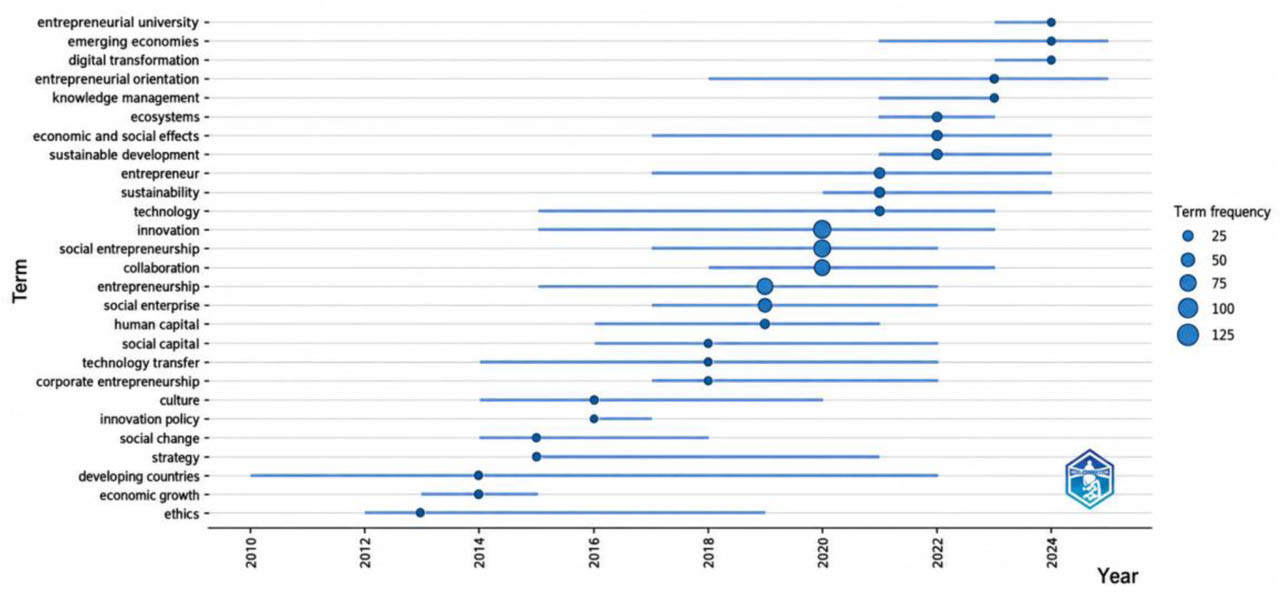
Figure 9.
Trend topics
Source: own processing
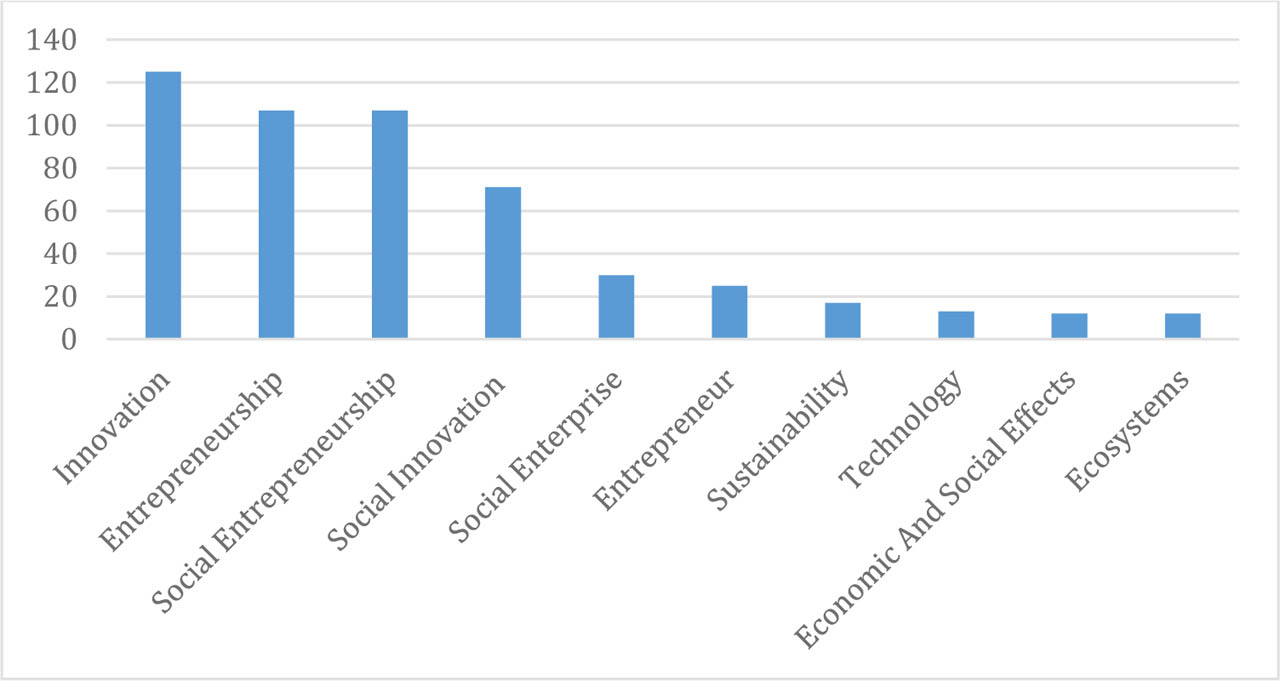
Figure 10.
Most relevant words
Source: own processing
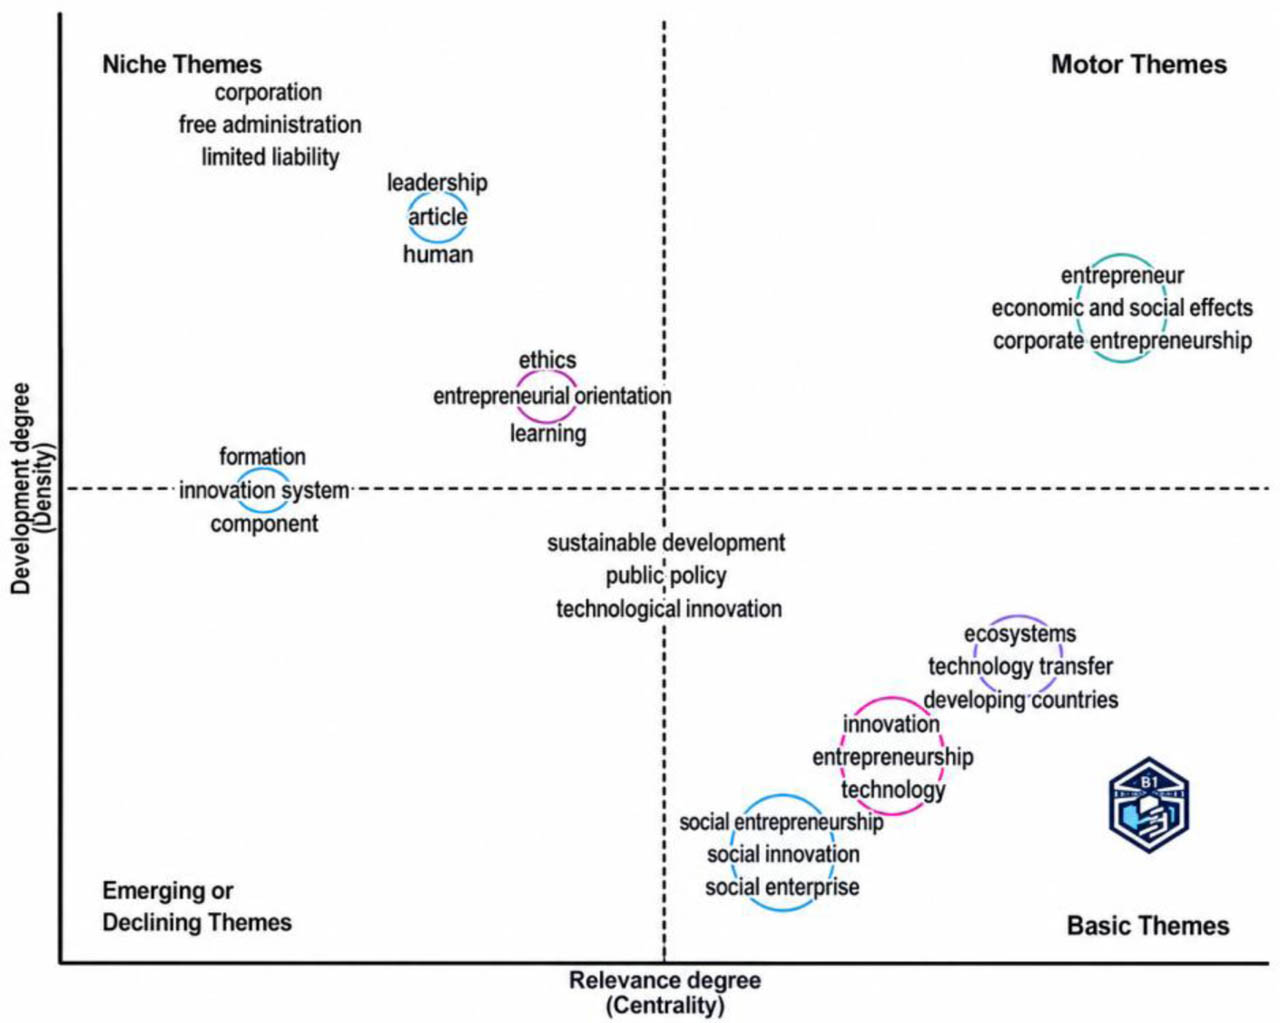
Figure 11.
Thematic map
Source: own processing
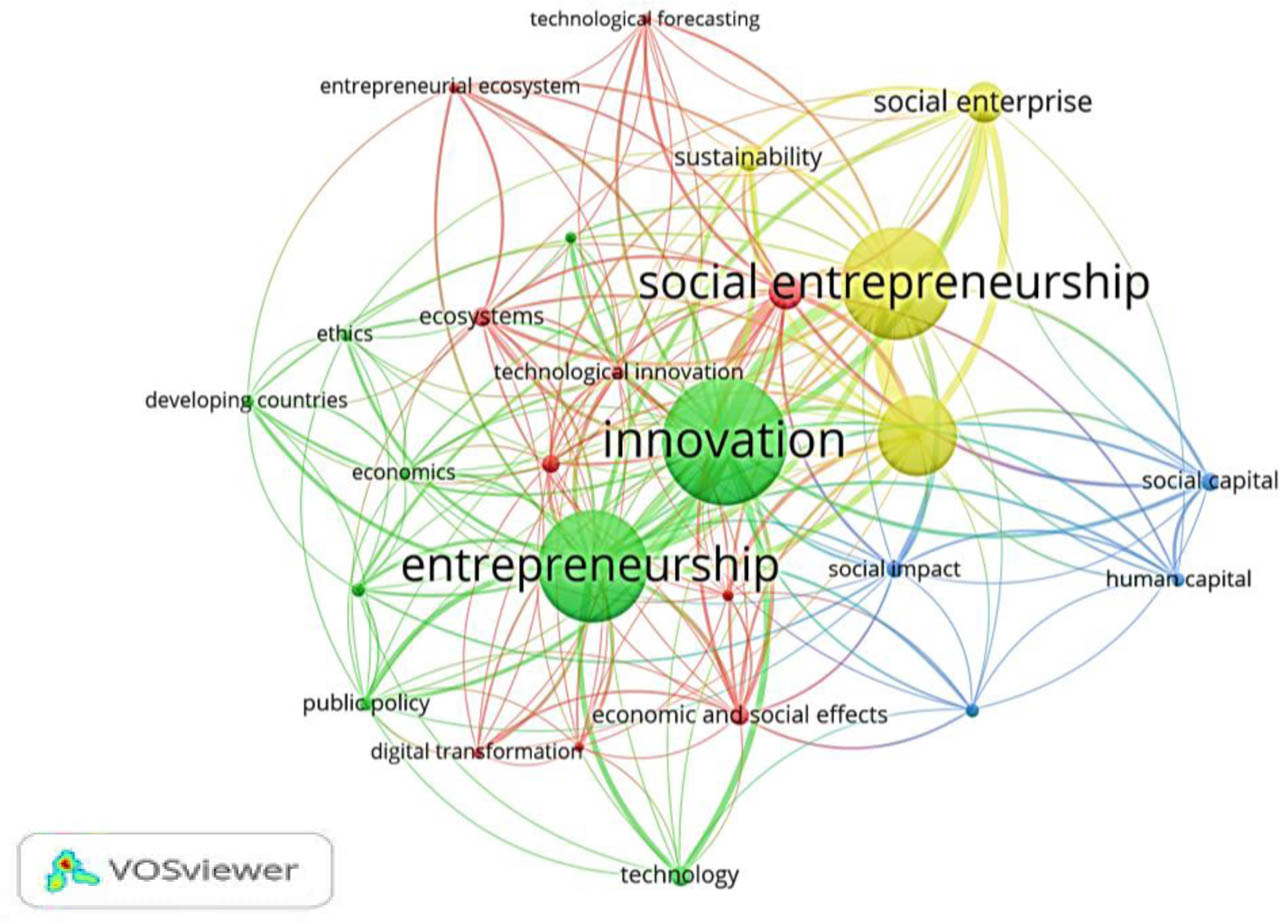
Figure 12.
Co-occurrence network
Source: own processing
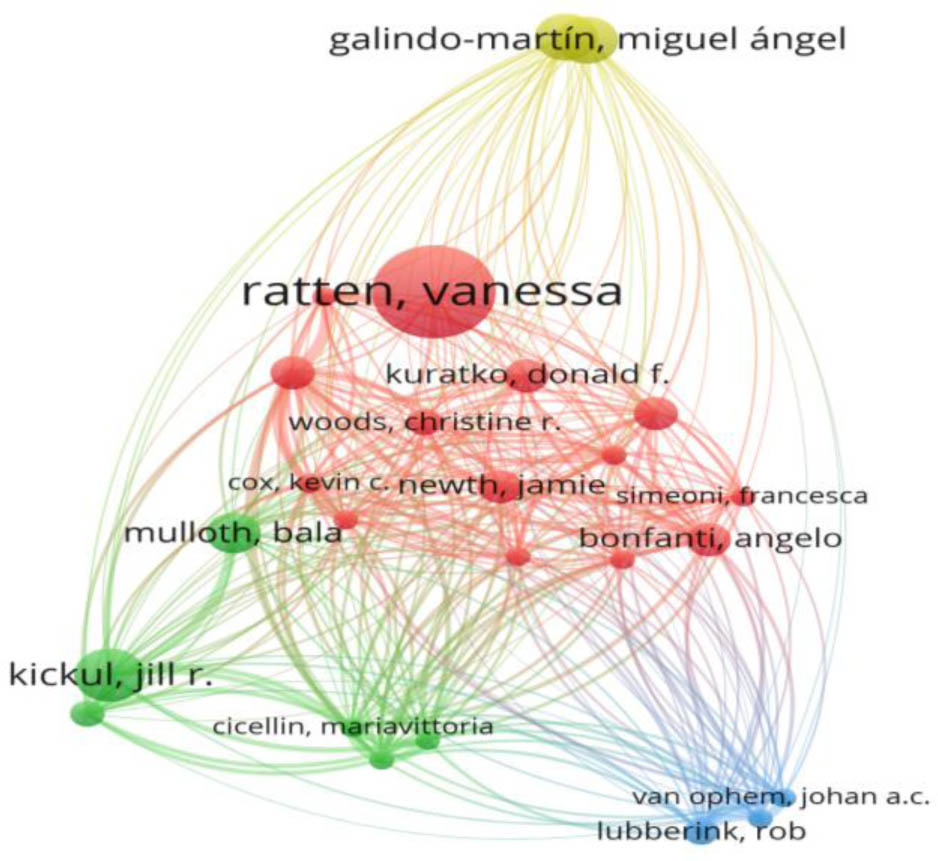
Figure 13.
Bibliographic coupling of authors
Source: own processing
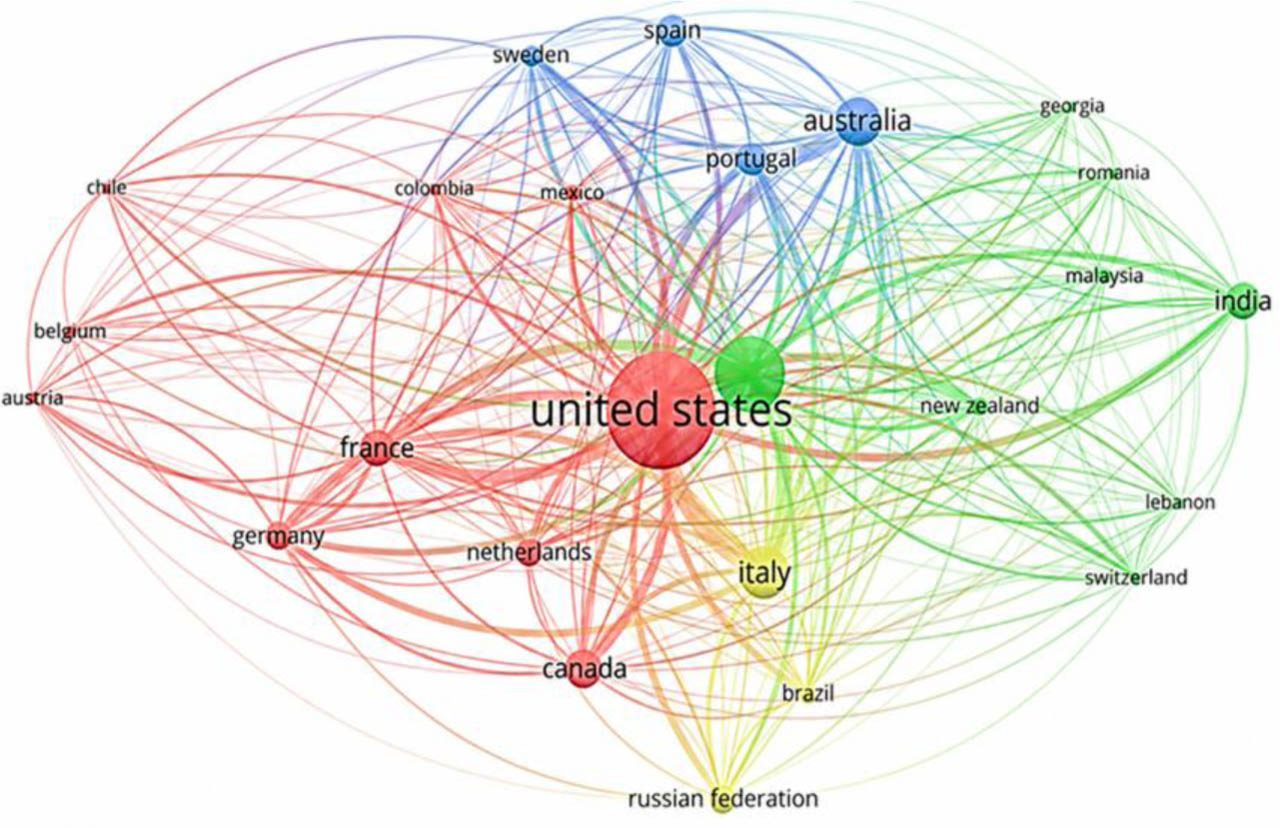
Figure 14.
Bibliographic coupling of the country
Source: own processing