
Introduction
Services have become a crucial and predominant element across multiple industries (Abu-Hasheesh et al., 2026). The transition to a service-oriented paradigm is evident, as global economies increasingly depend on service-based models (Wirtz & Lovelock, 2022). Travel enterprises are acknowledged as a significant growth sector across numerous nations and a primary foundation for improved livelihoods, wealth creation, and income generation (Manyangara et al., 2023). Also, the service sector is the most rapidly expanding driver of global economic growth, accounting for two-thirds of global trade and posting the highest growth rate in gross domestic product (GDP) (Ali et al., 2024).
In travel agencies, the choice to reuse a company depends heavily on service quality. Services constitute over 63% of global GDP and drive the world economy (Naeem et al., 2024). Travel agencies contribute by managing travel needs and delivering solutions (Fang et al., 2021). Increased living standards have also driven up travel frequency (Su et al., 2025). Hence, companies seek sustainable competitive advantage by focusing on customer retention (Pataraia et al., 2025).
In recent decades, retaining existing customers has become central to service company strategy (Aday & Fabros, 2018; Oladapo, 2020). It is more economical than acquisition (Singh, 2025), and loyal customers drive profitability by resisting competitors and attracting new customers (Loureiro et al., 2025). Customers have been, and will remain, the cornerstone of every company’s profitability. Nonetheless, communication between a company and its clientele is increasingly vital (Camară, 2024).
Customer retention is essential to a company’s survival and success, and it has been extensively examined in the hospitality and tourism literature (Tan, 2023). Historically, companies prioritized customer acquisition over retention (Harriet et al., 2024). However, the advantages of retaining current consumers have become central to business success (Kabasinguzi et al., 2024). Customer retention depends on the initial distance from the objective and the extent of perceived progress towards it. As customers approach reward attainment, they allocate more financial and non-financial resources to the firm, thereby enhancing retention (Torkzadeh et al., 2022).
In tourism, service quality drives satisfaction and retention (Nguyen Phu & Nguyen Thi Thu, 2022). Companies innovate to raise quality, retain customers, and ensure profitability (Johnson & Karley, 2018). High-quality services foster competitiveness by exceeding expectations, increasing satisfaction, and building loyalty (Gazi et al., 2024; Kaynama & Black, 2000; Shyju et al., 2023). Moreover, tourism managers must focus on the physical environment of the service setting, the relationships between staff and customers, and customer engagement (Shyju et al., 2023). In this sense, travel agencies’ managers must navigate a multifaceted service landscape comprising interconnected tourist firms, social networks, performance metrics, and experiential elements. During this service interaction, travel agencies’ managers provide superior service and formulate strategies to enhance perceptions of tourism services (Fang et al., 2025).
Furthermore, service quality remains a foundation of competitive advantage and retention strategies (Chang et al., 2024). Nonetheless, the key factors differ between online and offline settings, but secure, responsive digital services support customer retention and efficiency in the online context (Baumgartner et al., 2024).
As the internet and mobile platforms grow, technology is advancing relationship marketing. It improves collaborative and social communication channels (Antwi, 2021) and has enabled businesses, service providers, and their customers to profit from internet-based services (Buhaljoti, 2019). Digital marketing uses technology to engage, acquire, and retain customers. In tourism, it increases marketers’ visibility, reach, and customer engagement (Abate et al., 2025). Social media, mobile apps, and other digital communication tools are now part of daily life for billions (Dwivedi et al., 2021). Nonetheless, to retain customers and build trust, companies must communicate consistently and offer benefits (Kazak et al., 2020). Additionally, service providers need to avoid traveler dissatisfaction, as this can lead to customer loss and negative word of mouth (Naeem et al., 2024). This concept aligns with Viljoen and Roberts-Lombard (2016), who asserted that traditional travel agencies must redefine their intermediary roles to add value and sustain their position in the travel distribution process.
The global tourism sector has changed significantly in the past decade (Lubbe et al., 2006). The World Travel and Tourism Council (2021) states that this sector rapidly expanded before the pandemic. It contributed one-tenth of global GDP (Wei, 2022). On the other hand, retaining customers is crucial for travel agencies. They drive revenue. In many developing countries, tourism is vital to their economies (Narayan et al., 2009). Thus, travel agencies must quickly deliver services and ensure efficient transactions, both online and offline, to acquire and retain customers (Kazak et al., 2020). Similarly, the service sector in the Kurdistan Region is consistently expanding, particularly within the tourism industry. Tourism in the Kurdistan region of Iraq ranks second to the oil sector in generating substantial revenue for the region’s budget, with over two million tourists visiting the country each year (Abdul-Aziz Ahmad & Jais, 2024).
In the past decade, our country, like other developing countries, faced weaknesses in banking marketing culture. This was mainly due to a lack of electronic payment devices in the government and private sectors, as well as insufficient internet access. The study asserts that internet banking in Iraqi Kurdistan is limited (Demir & Fakhir, 2017). Consequently, passengers frequently had to contact travel agencies when booking flights, making hotel reservations, applying for insurance, etc. (Ali et al., 2019). Previously, reliance on traditional travel agencies stemmed from limited trust in online transactions, especially monetary transfers (Mahdzar et al., 2022). This aligns with (Wei, 2022), who asserts that new technology has changed how travelers seek and buy travel services, from transport to accommodations. Travel agencies are now endangered, as technology threatens to replace their services (Cheung & Lam, 2009). The global decline in airline ticket sales by travel agencies can be attributed to customers buying tickets online (Shaw, 2016).
The digital era has shifted customer behavior, with individuals favoring online shopping, entertainment, and social engagement (Hat et al., 2025; Sudaryanto et al., 2025). Furthermore, millennials have one of the highest levels of trust in online platforms, as they constitute the majority of social media users (Sakas et al., 2022). Generation Alpha comprises individuals born between 2010 and 2025. Thus, they are the first children of the 21st century (Kotler et al., 2021). Generation Z (born 1995–2009) grew up connected globally through smartphones, tablets, and social media. Gen Z spends about 9 hours a day engaging with media, mostly on screens, interacting online, and shaping their identities through digital experiences (Vițelar, 2019). The growth of the internet has led consumers to prefer online travel agencies over traditional travel agencies (Shen, 2018). The global online travel agency (OTA) market reached $616.6 billion in 2023 and is projected to rise to $1,178.7 billion by 2030, an annual growth rate of 12.98% (Keles et al., 2025).
Building on these global trends, citizens in Iraq, especially in the KRI, have increasingly used credit cards such as Mastercard and Visa. This shift has increased travel companies’ concerns that their customers will opt to buy tickets and book hotels with their credit cards, rather than through the agencies (Kurdistan Regional Government, 2025). As a result, customers now prefer agencies that offer customized services, destination advice, and assistance with complex trip planning (Singh, 2017).
In addition to facilitating payment transactions, credit cards enable quick and safe payments, including smartphone payments anywhere. Balance replenishment is possible via mobile banking, ATMs, EDC machines, or retail stores (Darma & Noviana, 2020). Approximately 50% of global travel bookings are made online, while travel agents handle only a third of bookings. The shift to online bookings is shown by the decline in air ticket sales by travel agents (Viljoen & Roberts-Lombard, 2016). With less human interaction, customers have more time to compare prices across alternative websites. Additionally, preferences change rapidly when customers see vacation offers from many online providers. They are less willing to maintain a commitment to any particular travel agency (Alshammare et al., 2022). Moreover, to meet changing consumer preferences, the tourism industry now offers both online and offline booking channels. Many younger travelers favor online platforms to find and book domestic or international trips (Shen, 2018).
Nonetheless, with the rapid advancement of technology, the internet has enabled an obvious move towards direct trip bookings (Dolnicar & Laesser, 2007). Individuals frequently use the internet before and after purchasing (Bayraktaroğlu & Aykol, 2008). The resilience of tourism has increased (Mahdzar et al., 2022). As a result, 70% of consumers prioritize service stability and reliability over connection speed. Likewise, enterprises adopting a customer-centric model can increase revenue by up to 8%, reduce service costs by 10 to 15%, and raise customer satisfaction scores by 20 to 40 points (Ta & Chang, 2026). These findings indicate that service quality is both a determinant of customer retention and an effective instrument for enhancing strategic capabilities.
Although considerable literature exists, there is ongoing debate about the determinants of customer retention. Research gaps persist regarding the impact of service quality, particularly in developing countries, including ours (Adzinyo et al., 2024; Harriet et al., 2024). For the KRI travel agency, examining how service quality affects retention not only addresses these local research gaps but also provides practical, actionable insights for managers and owners seeking to retain customers and prevent migration to online platforms. Based on these arguments, the following research question is formulated:
RQ1. Is there a relationship between (tangibility, reliability, responsiveness, assurance, and empathy) and customer retention among managers of travel agencies in the KRI?
Literature review and hypothesis formulation
Customer retention
Customer retention, as a behavioral phenomenon, has undergone minimal evolution over the past three decades, underscoring the need for illuminating frameworks (Dias et al., 2026). Customer retention is the relationship between the company and the customer, reflecting the customer’s desire to participate in business and continually purchase from the company rather than its competitors (Israel, 2022). In addition, it is a fundamental concept in today’s highly competitive markets (Banabo & Perearau, 2025). It has become a critical strategic priority, making strong customer relationships essential (Datta, 2018). Retention helps companies manage growing competition and should be considered from both the company’s and consumers’ viewpoints (Trenggana et al., 2022). Satisfied, retained customers are a company’s most valuable asset for sustaining reputation and market edge (Al-Hashem, 2022). On the other hand, the advantages of customer retention have been highlighted, including reduced sensitivity among loyal customers to service/product pricing and competitors’ marketing strategies (Loureiro et al., 2025). Resultantly, loyal customers tend to accumulate more goods and services over time and are associated with lower marketing expenses, as they indirectly attract new customers through favorable word of mouth. Consequently, elevated customer retention rates lead to enhanced firm profits (Carvalho dos Reis Silveira et al., 2022).
Customer retention hinges on customers’ attitudes and actions toward service quality (Kabasinguzi et al., 2024). It also reflects how effectively a company connects with its customers (Almohaimmeed, 2019). Adzhigalieva et al. (2022) define retention as the customer’s intention to sustain a business relationship. Maladi et al. (2019) argue that a successful retention strategy involves comprehensive marketing actions to retain and maximize long-term value for both new and existing customers, strengthening mutual relationships (Lovemore et al., 2023).
However, Trenggana et al. (2022) note there are two main strategies: retaining existing customers and acquiring new ones. Acquiring new customers can be difficult and expensive, making retention essential for a brand’s growth and sustainability (Al-Adwan et al., 2025). Studies consistently show retaining existing customers costs significantly less than recruiting new ones (Hanaysha, 2018; Sağlam & El Montaser, 2021). However, Sikri et al. (2024) observed that offering comprehensive facilities to all customers is neither practical nor cost-effective, as such an approach poses significant challenges. Companies may instead forecast potential churners and focus on them with targeted retention strategies (Sikri et al., 2024). Hence, Hanaysha (2018) demonstrated that retention has financial consequences, as acquiring new customers typically requires significant investments to influence buying behavior, reinforcing the value of retaining existing customers. As a result, customer retention is a vital goal for service enterprises within relationship marketing. Their growth and survival in a competitive environment are critically contingent upon retention (Zhengmeng et al., 2024). As an increasing number of customers become the focal point of marketing efforts, interest in their individual preferences intensifies (Rîpa & Nicolescu, 2023).
Service quality
As per Harriet et al. (2024), service quality is a consumer’s comprehensive evaluation of an organization and its services, reflecting the level of excellence or lack of value. In other words, the value of a service from the customer’s viewpoint defines service quality and quality in general. However, the study by Ifedi et al. (2024) mentioned service quality as the company’s comprehensive service system. It describes how the company’s delivery system can meet customers’ expectations. This supports the idea of overall service quality, looking beyond just direct results.
On the other hand, service quality management ensures that services provided to customers meet or exceed their expectations. It also evaluates the efficacy of a service, identifying issues and addressing them to enhance future quality and boost customer satisfaction (Jing et al., 2020). Therefore, the manager’s primary objective is to enhance the organization’s fundamental skills to deliver a higher standard of service. They achieve this by differentiating their products and services from competitors and effectively managing efficiency and responsiveness (Al Kurdi et al., 2023). Unquestionably, quality services involve delivering a service that aligns with customer expectations and the organization’s values. The company’s high-quality services and products enhance customer satisfaction (Harriet et al., 2024).
Furthermore, service quality is essential for achieving a competitive advantage in the service sector (Chang et al., 2024). Nonetheless, the determinants of service quality in offline services differ from those in online services. Alongside outcome-oriented factors, the physical environment and personal interactions, which rely on counsellors’ expertise, conduct, and problem-solving abilities, significantly influence service quality (Baumgartner et al., 2024). Prior to the rise of the internet in the early 1990s, travelers relied heavily on travel agencies to make travel arrangements. This was because travel companies were the only intermediaries from which they could obtain reliable, up-to-date travel information (Wei, 2022).
Theoretical underpinning
Relationship marketing has garnered growing attention in marketing literature. It is defined as the process of enhancing quality to foster customer satisfaction and retention by cultivating long-term relationships with customers and stakeholders, thus promoting future operational success (Mokhtaruddin et al., 2018). The RM theory supports customer retention by providing components that explain how and why customers develop long-term relationships with companies. Service quality positively affects both relationship quality and customer loyalty (Dung & Tu, 2023; Tun, 2023). An improved relationship with customers can ultimately lead to greater loyalty and retention (Rîpa & Nicolescu, 2023).
Furthermore, Morgan and Hunt (1994) identify trust, commitment, and communication as essential to RMT. These elements align with service quality dimensions such as reliability, responsiveness, and empathy (Parasuraman et al., 1985). A lack of trust is a significant barrier to customer acceptance, especially when products are less tangible (Shi et al., 2025). High trust leads to greater customer satisfaction and service success, making it crucial for business success in service companies (Wahyudi et al., 2025). Similarly, commitment enhances emotional and psychological attachment, which reduces the likelihood of switching (Ekejiuba et al., 2025). Continuous communication also sustains relationships and addresses customer needs effectively (Phyu, 2019). In this study, RM theory underpins the idea that the strength of the provider-customer relationship shapes how service quality is perceived and maintained over time.
Service quality and customer retention
Several scholars (Adzhigalieva et al., 2022; Adzinyo et al., 2024; Al-Gasawneh & Dalain, 2023; Harriet et al., 2024; Kabasinguzi et al., 2024; Lovemore et al., 2023; Maladi et al., 2019; Ogonu & Elvis, 2023; Pezeshki, 2009) have examined the link between service quality and customer retention. Their studies consistently show a direct link, identifying service quality as key to customer retention (Sari et al., 2018). Furthermore, customer retention is a crucial factor in the success of services provided by various companies (Nallaluthan & Al Falasi, 2023). Service quality directly influences customer satisfaction, which in turn affects consumer loyalty intentions and repeat purchases (Etim et al., 2021). Nallaluthan and Al Falasi (2023) examined how service quality affects retention in tourism companies in the United Arab Emirates. They found a significant relationship between the two.
Tangibility was positively correlated with customer retention in a study by Tsokwa Wunuji et al. (2023) regarding hotels in Nigeria. The study identified factors such as the aesthetics of physical amenities, employee tidiness, seating comfort, and room decor as influencing customer retention. Additionally, Mng’ong’o (2023) investigated the impact of tangibility and assurances on customer retention in community banks in Tanzania, using a mixed-methods survey. Although the contexts differed, hospitality versus banking, the study concluded that tangible elements significantly affected customer retention, advocating the strategic use of tangible assets to enhance retention.
Moruku et al. (2025) studied airline customers in Nigeria. They found that companies should emphasize reliability and assurance to enhance customer retention, with reliability having a positive impact on customer retention. In a related vein, responsiveness, defined by Negassa and Japee (2023) as the perception of prompt assistance, was linked to improved customer retention in Nigerian hotels (Tsokwa Wunuji et al., 2023). Through these service industries, studies consistently found positive associations among responsiveness, reliability, assurance, and customer retention, though in different cultural and sectoral contexts. Rajagukguk et al. (2024) posited that trust and loyalty boost referrals, while Adzinyo et al. (2024) in Nigeria further confirmed the importance of assurance in retention. Moreover, Harriet et al. (2024) identified empathy as crucial, emphasizing its benefit across private service sectors. These findings collectively suggest that while each study centers on a specific dimension, multiple aspects of service quality are similarly vital across sectors.
Consistent with the above discussions, the following hypothesis is formulated:
H1: Service quality positively influences customer retention.
H1a: Tangibility has a positive impact on customer retention.
H1b: Reliability has a positive impact on customer retention.
H1c: Responsiveness has a positive impact on customer retention.
H1d: Assurance has a positive impact on customer retention.
H1e: Empathy has a positive impact on customer retention.
Accordingly, drawing from the literature, the authors suggest the subsequent conceptual framework (Figure 1) for the current research:
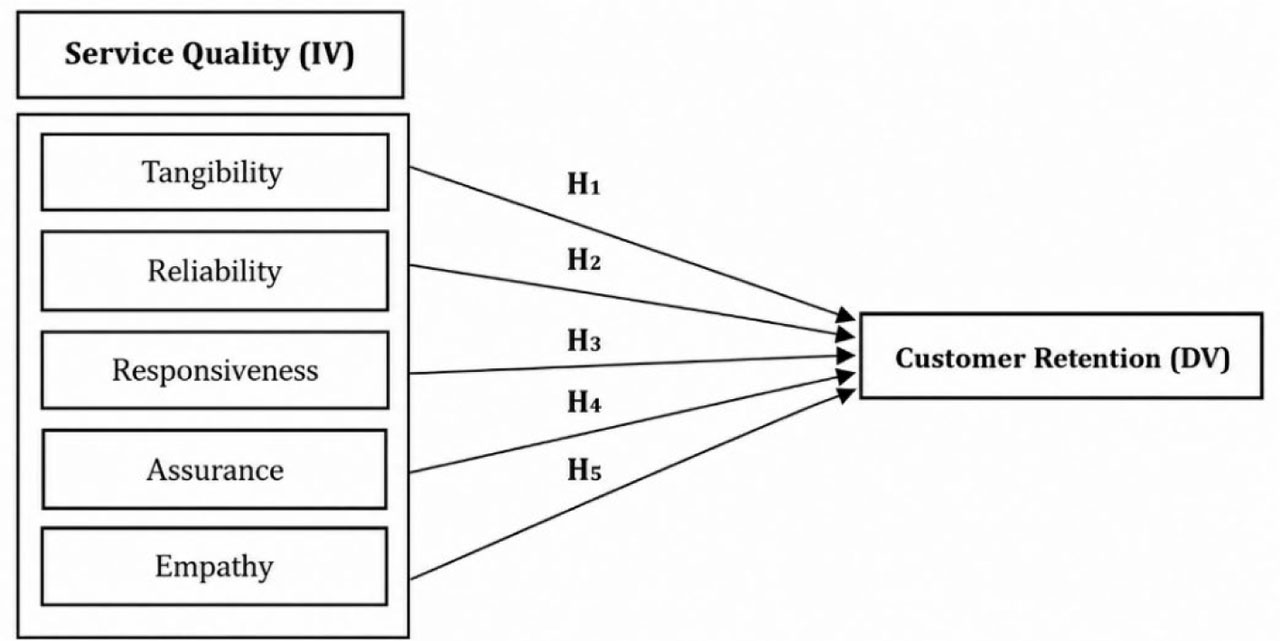
Figure 1.
Conceptual framework of the study
Source: own processing
Methodology
Sample and data collection
Purposive sampling was used to distribute the questionnaire. This technique enabled the researcher to select participants most likely to provide relevant information to the study’s objectives, as described by Fahlevi (2025). The questionnaire targeted travel agency managers in the KRI governorates, resulting in 509 questionnaires distributed based on population size. Of these, 353 were returned, yielding a response rate of 70.6%. According to Sekaran and Bougie (2016), a 30% response rate is considered acceptable for survey research, making this study’s rate suitable for further analysis.
Measurement constructs
All constructs were scored using five-point Likert scale, with “1” denoting “strongly disagree” and “5” denoting “strongly agree”. The service quality scale is derived from multiple sources, such as Parasuraman et al. (1985), Adzinyo et al. (2024), Ogonu and Elvis (2023), Alemu (2023). This 25-item scale evaluates travel agency services across five dimensions: tangibility, reliability, responsiveness, assurance, and empathy. the (Farquhar, 2005)’s scale was used to measure customer retention. It comprises 22 items in five dimensions: direction (3), structure and culture (5), relationship strategy (4), information system (5), and staff (5). These items have also been used as a measure of customer retention by (Al-Hadrawi & Al-Shammari, 2017).
Results and interpretation
Data analysis
IBM SPSS 27 was used for categorization, cleaning, frequency analysis, and descriptive statistics, whereas SmartPLS 4.0 was used for SEM. Given its popularity in social science research, this study uses PLS-SEM rather than covariance-based SEM. Second, it benefits small-sample analyses when other applications are limited. Furthermore, PLS-SEM does not assume normally distributed data. Thus, empirical data do not need a normal distribution (Sann & Siripipattaworn, 2024). This made PLS-SEM suitable for our investigation. PLSSEM’s ability to handle complex models, such as those in this research, with second-order (customer retention) constructs and five independent variables, as well as non-normal data, lends support to its use (Hair et al., 2019).
Common method bias
A t-test of early and late responses showed no non-response bias (Armstrong & Overton 1977). This proves the lack of non-response bias. Data were also checked for common method bias. Improving data collection can reduce the CMB by anonymizing respondents or simplifying survey questions. Harman’s single-factor test (Podsakoff et al., 2024) and the comprehensive collinearity test were used to assess common-method bias. The initial component accounted for 37.25% of the variation, indicating scale independence (Singh et al., 2017). All construct VIF values were far below the recommended level of 3.3 (Kock, 2015). An assessment committee verified adherence to ethical standards, and ethical approval confirmed that participants understood the study’s goals and rights.
Demographic profile of respondents
The largest proportion of respondents was from Sulaymaniyah (36.3%), followed by Erbil (36.8%), Duhok (26.9%), and Halabja (0.3%; note: Table 1 reports 3%, please reconcile). In terms of sex, men comprise 75.4% of managers in the study, while women account for 24.6%. Regarding age distribution, the data show that the 31–45 age group is the largest in the sample, accounting for 59.20%. The next age group, 30 and younger, makes up 27% of managers in this sector.
Looking at educational backgrounds, the majority of managers (74.5%) hold bachelor’s degrees, and 14.20% hold professional diplomas. By contrast, only 7% have a high school diploma or less, underscoring their underrepresentation in managerial positions. Postgraduate (Master’s or PhD) is the least represented at 4.20%. Examining work experience, the majority of managers (50.7%) have 6–15 years of experience. Consequently, 42.5% of managers have five years or less experience. Only 6.80% of the sample have over 15 years of management experience.
Table 1.
Demographic profile of study respondents (N = 353)
| Items | Describe | Frequency | Percent (%) |
|---|---|---|---|
| Governorate | Duhok, | 94 | 26.6% |
| Erbil, | 130 | 36.6% | |
| Sulaymaniyah, | 128 | 36.3% | |
| Halabja | 1 | 3% | |
| Sex | Male | 266 | 75.4% |
| Female | 87 | 24.6% | |
| Age | 30 years and less | 96 | 27.2% |
| 31 _ 45 years | 209 | 59.2% | |
| 46 _ 60 years | 46 | 13% | |
| More than 60 years | 2 | 6% | |
| Educational qualifications | High School or below | 25 | 7.1% |
| Vocational Diploma | 50 | 14.2% | |
| Undergraduate | 263 | 74.5% | |
| Postgraduate | 15 | 4.2% | |
| Years of experience | 5 years and less | 150 | 42.5% |
| 6 – 10 years | 179 | 50.7% | |
| over 10 years | 24 | 6.8% |
Measurement model
In this study, we used SmartPLS 4.0 to examine composite reliability and Cronbach’s alpha for construct validation (Bujang et al., 2018). Table 2 indicates that the composite reliability is acceptable, as the coefficients rho_c and rho_a are > 0.70. The factor loading in this study exceeds 0.50, thus satisfying the criteria for convergent validity (Peterson & Kim, 2013). According to Hair et al. (2017), the AVE for each construct should be greater than 0.5; the present study indicates that the AVE for all constructs exceeds 0.7, which is considered very good. The AVE of the study presented ranges from 0.754 to 0.850. Table 2 presents the AVE for all constructs, while Cronbach’s alpha exceeds 0.70.
Table 2.
Findings of outer loadings, Cronbach’s alpha coefficient, composite reliability, and AVE
| Constructs | Items | Outer loadings | Cronbach’s Alpha | Composite reliability (rho_a) | Composite reliability (rho_c) | Average variance extracted (AVE) |
|---|---|---|---|---|---|---|
| CRDIR | CRDIR1 | 0.919 | 0.912 | 0.915 | 0.944 | 0.85 |
| CRDIR2 | 0.930 | |||||
| CRDIR3 | 0.916 | |||||
| CRIS | CRIS1 | 0.882 | 0.935 | 0.936 | 0.951 | 0.795 |
| CRIS2 | 0.886 | |||||
| CRIS3 | 0.905 | |||||
| CRIS4 | 0.903 | |||||
| CRIS5 | 0.881 | |||||
| CRRS | CRRS1 | 0.913 | 0.926 | 0.926 | 0.947 | 0.818 |
| CRRS2 | 0.897 | |||||
| CRRS3 | 0.906 | |||||
| CRRS4 | 0.902 | |||||
| CRSC | CRSC1 | 0.889 | 0.933 | 0.934 | 0.949 | 0.789 |
| CRSC2 | 0.887 | |||||
| CRSC3 | 0.890 | |||||
| CRSC4 | 0.888 | |||||
| CRSC5 | 0.889 | |||||
| CRSTF | CRSTF1 | 0.890 | 0.935 | 0.936 | 0.951 | 0.794 |
| CRSTF2 | 0.881 | |||||
| CRSTF3 | 0.892 | |||||
| CRSTF4 | 0.893 | |||||
| CRSTF5 | 0.900 | |||||
| SQASN | SQASN1 | 0.851 | 0.918 | 0.92 | 0.939 | 0.753 |
| SQASN2 | 0.871 | |||||
| SQASN3 | 0.871 | |||||
| SQASN4 | 0.875 | |||||
| SQASN5 | 0.872 | |||||
| SQEMP | SQEMP1 | 0.900 | 0.934 | 0.935 | 0.95 | 0.791 |
| SQEMP2 | 0.891 | |||||
| SQEMP3 | 0.882 | |||||
| SQEMP4 | 0.886 | |||||
| SQEMP5 | 0.888 | |||||
| SQRLB | SQRLB1 | 0.884 | 0.936 | 0.937 | 0.952 | 0.797 |
| SQRLB2 | 0.896 | |||||
| SQRLB3 | 0.900 | |||||
| SQRLB4 | 0.900 | |||||
| SQRLB5 | 0.884 | |||||
| SQRSP | SQRSP1 | 0.872 | 0.926 | 0.928 | 0.944 | 0.771 |
| SQRSP2 | 0.894 | |||||
| SQRSP3 | 0.873 | |||||
| SQRSP4 | 0.867 | |||||
| SQRSP5 | 0.884 | |||||
| SQTGB | SQTGB1 | 0.888 | 0.929 | 0.929 | 0.946 | 0.779 |
| SQTGB2 | 0.892 | |||||
| SQTGB3 | 0.880 | |||||
| SQTGB4 | 0.888 | |||||
| SQTGB5 | 0.864 |
[i] Note: CRDIR= Customer retention(direction), CRIS= Customer retention (information system, CRRS= Customer retention (relational strategy), CRSC= Customer retention structure and culture, CRSTF= Customer retention (staff), SQASN= service quality(assurance), SEQEMP= service quality(empathy), SQRLB= service quality (reliability), SQRSP= service quality(responsiveness), SQTGB= service quality(tangibility).
Table 2 indicates that all variables met the measurement criteria, including the AVE, which exceeded 0.5. As per Hasan et al. (2020), the extent to which a test is independent of other tests assessing different constructs is termed discriminant validity. To ascertain this, the square root of AVE is necessary. To establish discriminant validity, the square root of the AVE of the construct must exceed the variance shared between the construct and other constructs (Sann & Siripipattaworn, 2024).
The current study utilized different methods to assess discriminant validity: the Fornell and Larcker (1981) approach, the factor loading technique outlined by Chin (1998), and the (HTMT) as described by Henseler et al. (2015) (Table 3 and Table 4).Table 3 displays the discriminant validity of all 15 constructs. The square root of the AVE for each latent construct must exceed the correlations of any other latent construct (Sann & Siripipattaworn, 2024).
Table 3.
HTMT
| Constructs | 1 | 2 | 3 | 4 | 5 | 6 | 7 | 8 | 9 | 10 |
|---|---|---|---|---|---|---|---|---|---|---|
| CRDIR (1) | - | |||||||||
| CRIS (2) | 0.727 | - | ||||||||
| CRRS (3) | 0.797 | 0.801 | - | |||||||
| CRSC (4) | 0.789 | 0.809 | 0.859 | - | ||||||
| CRSTF (5) | 0.736 | 0.745 | 0.782 | 0.789 | - | |||||
| SQASN (6) | 0.402 | 0.451 | 0.497 | 0.490 | 0.466 | - | ||||
| SQEMP (7) | 0.434 | 0.515 | 0.531 | 0.527 | 0.486 | 0.486 | - | |||
| SQRLB (8) | 0.387 | 0.418 | 0.420 | 0.413 | 0.412 | 0.435 | 0.415 | - | ||
| SQRSP (9) | 0.379 | 0.459 | 0.447 | 0.459 | 0.402 | 0.507 | 0.423 | 0.411 | - | |
| SQTGB (10) | 0.414 | 0.563 | 0.509 | 0.515 | 0.502 | 0.519 | 0.538 | 0.490 | 0.452 | - |
Table 4.
Fornell & Larcker Criterion
| Constructs | 1 | 2 | 3 | 4 | 5 | 6 | 7 | 8 | 9 | 10 |
|---|---|---|---|---|---|---|---|---|---|---|
| CRDIR (1) | 0.922 | |||||||||
| CRIS (2) | 0.672 | 0.892 | ||||||||
| CRRS (3) | 0.733 | 0.746 | 0.904 | |||||||
| CRSC (4) | 0.729 | 0.756 | 0.798 | 0.888 | ||||||
| CRSTF (5) | 0.680 | 0.697 | 0.728 | 0.737 | 0.891 | |||||
| SQASN (6) | 0.370 | 0.419 | 0.460 | 0.456 | 0.433 | 0.868 | ||||
| SQEMP (7) | 0.401 | 0.482 | 0.494 | 0.493 | 0.455 | 0.451 | 0.890 | |||
| SQRLB (8) | 0.360 | 0.392 | 0.392 | 0.388 | 0.387 | 0.404 | 0.389 | 0.893 | ||
| SQRSP (9) | 0.351 | 0.429 | 0.416 | 0.429 | 0.376 | 0.469 | 0.394 | 0.385 | 0.878 | |
| SQTGB (10) | 0.382 | 0.525 | 0.473 | 0.481 | 0.469 | 0.479 | 0.502 | 0.457 | 0.420 | 0.883 |
Assessment of formative measurement model
VIF is commonly used to assess collinearity among formative indicators. Collinearity is evaluated when more than one formative measurement item exhibits high correlation and conveys the same information and tendencies (Hair et al., 2017). In PLS-SEM, a VIF of ≥5 is considered to indicate collinearity (Hair et al., 2014). In the same way, VIF values of 5 or more indicate serious collinearity issues among the indicators of constructs that are assessed (Becker et al., 2015), while optimal VIF values should be approximately three or below. Therefore, as shown in Table 5, all VIF values are below 5, suggesting no significant collinearity among the indicators.
Structural model
In structural model prediction, path coefficients, p-values, t-values, and bias confidence intervals were employed to validate the proposed nexus. This section primarily examines the hypotheses about both direct and indirect effects. Consequently, employing Smart PLS and adhering to the procedures established by esteemed researchers (Hair et al., 2011; Hair et al., 2014; Hair et al., 2017), the PLS standard bootstrapping function was executed utilizing 353 cases and 10,000 bootstrapped samples, in line with (Al-Adwan et al., 2025; Singh & Manohar, 2024).
Consequently, it is recommended to use a minimum of 10,000 bootstrap samples, as shown in Figure 2. Given the rapid development of contemporary computing technologies, 10,000 bootstrap samples will provide minimal problems (Hair et al., 2022; Streukens & Leroi-Werelds, 2016). For a one-tailed test, a value of 1.645 is deemed significant. Conversely, for two-tailed tests, the suggested significant t-values must exceed 1.967 (Hair et al., 2014). The significance level of the t-value was evaluated using a one-tailed distribution. For a one-tailed statistical test, the t-value thresholds are ≥ 2.33, ≥ 1.65, and ≥ 1.28 for significance levels of 1%, 5%, and 10%, respectively. Values below the specified thresholds are deemed non-significant (Hair et al., 2017).
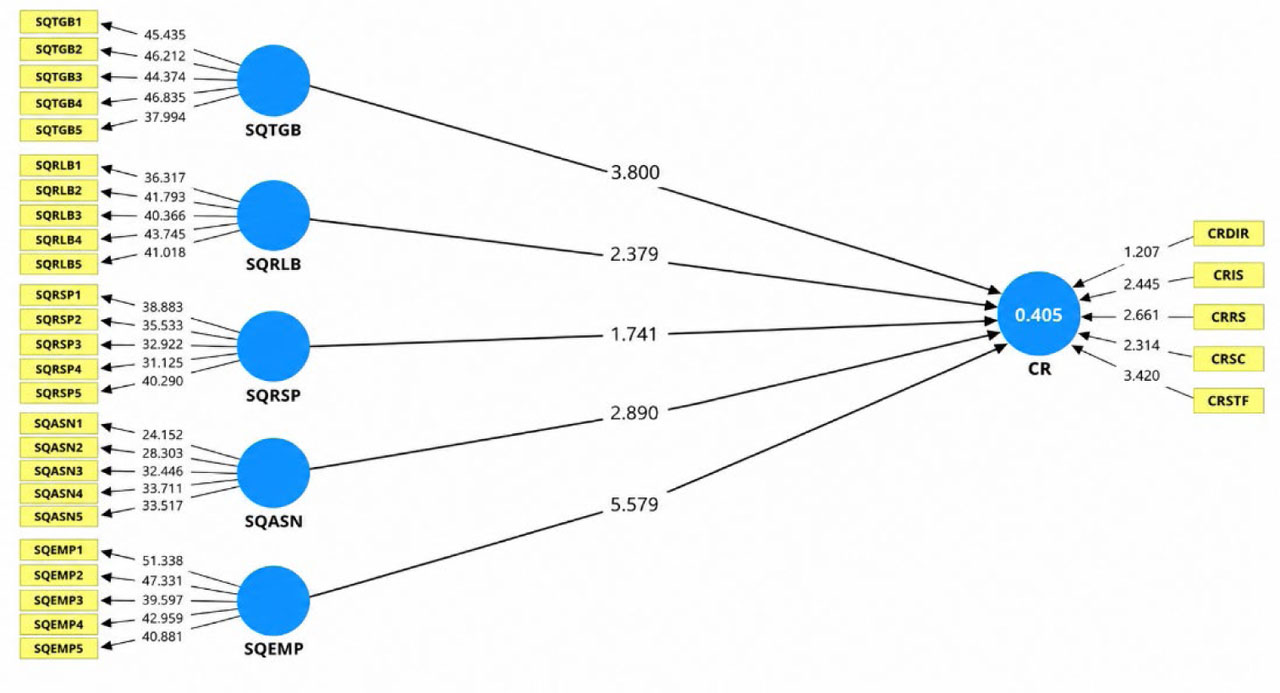
Figure 2.
Structural model
Source: own processing
Table 5.
Results of the hypothesis testing
| Hypothesis | Relationships | Std. Beta | Std. dev. | t-values | p-values | Confidence intervals | Decision | |
|---|---|---|---|---|---|---|---|---|
| Direct effect | LLCI BC | ULCI BC | ||||||
| H1 | SQTGB->CR | 0.116 | 0.054 | 3.800** | 0.000 | 0.108 | 0.288 | Supported |
| H2 | SQRLB->CR | 0.053 | 0.045 | 2.379 | 0.009 | 0.041 | 0.188 | Not Supported |
| H3 | SQRSP->CR | 0.080 | 0.075 | 1.741 | 0.041 | 0.024 | 0.273 | Not Supported |
| H4 | SQASN->CR | 0.093 | 0.051 | 2.890** | 0.002 | 0.070 | 0.234 | Supported |
| H5 | SQEMP->CR | 0.188 | 0.046 | 5.579** | 0.000 | 0.178 | 0.327 | Supported |
The relationship between tangibility and customer retention was determined to be positive and statistically significant (β = 0.116, t = 2.388, p = 0.008, LL= 0.030, UL= 0.189). Consequently, H1 = SQTGB -> CR is supported. Nonetheless, the H2 = SQRLB -> CR hypothesis was rejected as the findings indicated that the relationship between reliability and customer retention (beta= 0.053, t=1.312, p > 0.095, LL= −0.005, UL= 0.128) was not significant. A notable and positive correlation was identified between responsiveness and customer retention (β = 0.184, t = 4.094, p = 0.000, LL= −0.029, UL= 0.227). Moreover, the findings indicate that in the context of H4 = SQASN -> CR, there exists a substantial positive correlation between assurance and customer retention (β = 0.093, t=2.040, p=0.021, LL= 0.021, UL= 0.172). Consequently, the hypothesis was supported. Similarly, for the study H5 = SQEMP -> CR, a significant positive correlation exists between the independent variable (IV) service quality (empathy) and the dependent variable (DV) customer retention (beta = 0.188, t = 3.977, p = 0.007, LL= 0.111, UL= 0.267). Thus, the hypothesis SQEMP -> CR was fully substantiated.
Predictive significance
The predictive significance of the measurement model was subsequently evaluated using PLS prediction with a 10-fold cross-validation, a holdout-sample-based technique that facilitates case-level prediction for each item (Table 6).
Table 6.
PLS predict Q-square value for the items of the endogenous constructs
| Focal constructs | Q2 predict | PLS-SEM_RMSE | PLS-SEM_MAE | LM_RMSE | LM_MAE | RMSE | MAE |
|---|---|---|---|---|---|---|---|
| CRDIR | 0.233 | 0.878 | 0.618 | 0.923 | 0.654 | −0.045 | −0.036 |
| CRIS | 0.251 | 0.868 | 0.676 | 0.908 | 0.704 | −0.040 | −0.028 |
| CRRS | 0.278 | 0.853 | 0.656 | 0.878 | 0.677 | −0.025 | −0.021 |
| CRSC | 0.264 | 0.861 | 0.664 | 0.886 | 0.676 | −0.025 | −0.012 |
| CRSTF | 0.260 | 0.863 | 0.648 | 0.897 | 0.664 | −0.034 | −0.016 |
Shmueli et al. (2019) argued that if all constructs of the PLS model are lower than those of the linear regression model, this may indicate significant predictive power. The predictive relevance cannot be confirmed if all PLS model constructs exceed the LM constructs. If the majority of item differences (PLS-LM) were lowered, this may suggest that the model possesses moderate predictive power. If the minority of item variances (PLS-LM) are reduced, the model’s predictive power will decrease. According to Hair et al. (2017), a Q2 value above zero indicates that the exogenous constructs are predictive of the associated endogenous variables. The Q2 result for CRDIR is 0.233, signifying strong predictive relevance. CRIS, CRRS, CRSC, and CRSTF have satisfactory predictive relevance, with Q2 values of 0.251, 0.278, 0.264, and 0.260, respectively. Table 6 indicates that the PLS model exhibited greater accuracy than the LM model. Therefore, the predictive model has strong predictive power because all PLS-LM values are smaller.
Discussion and conclusions
Discussion
This study examines service quality and customer retention using RM theory. Relationship marketing strengthens communication and improves service quality. Customer loyalty and retention are the main goals (Antwi, 2021). The first hypothesis examined the role of tangibility in customer retention. The results confirmed H1 and align with previous research (Ta & Chang, 2026; Mng’ong’o, 2023; Tsokwa Wunuji et al., 2023). As in earlier studies (Parasuraman et al., 1988), this study shows that tangibility is a core service-quality feature influencing travel agency retention.
The second hypothesis examines the link between reliability and retention. The results show no significant correlation, so H2 is rejected. Prior literature also reports little effect of reliability on retention. Sari et al. (2018) found no direct effect, though some researchers argue that a positive link exists (Moruku et al., 2025). Theoretical connections may remain despite the lack of statistical support.
Testing H3 found no significant link between responsiveness and retention, so H3 is rejected. Many studies report a strong positive effect of responsiveness on retention, but these results differ. Adzinyo et al. (2024), Tsokwa Wunuji et al. (2023) also report that employee responsiveness improves retention. Here, only a theoretical connection exists.
The fourth hypothesis examines the connection between assurance and retention. The results demonstrate a positive, significant correlation, supporting H4. As in previous research, these findings reinforce the notion that assurance is closely tied to retention (Lam et al., 2023; Adzinyo et al., 2024). In addition to the findings on assurance, the data also supports a relationship between empathy and customer retention. Findings show a strong positive correlation, supporting H5. These results align with earlier research suggesting that empathy is key to retention (Harriet et al., 2024).
Conclusions
This study experimentally examines how service quality drives customer retention in KRI travel agencies. These agencies promote hospitality and tourism in the Kurdistan Region of Iraq. The market grows increasingly competitive as more travel agencies, including online ones, enter. In this environment, agencies strive to keep customers and grow market share. Empirical analysis supports three of the five hypotheses; the remaining two are not supported. The study answers the research questions and objectives. Though limited in scope, the results confirm the study’s core theories. This study fills a literature gap by giving empirical evidence on the service quality–customer retention link in KRI. Few prior studies have explored this. Findings suggest owners and managers should improve agency competencies. They should adopt hybrid models rather than relying solely on TTA or OTA. Agencies that use both online and traditional methods tend to succeed more than those that use just one (Addae et al., 2025; Banerjee, 2014; Pantano & Viassone, 2015; Savastano et al., 2019). Hence, this study developed a simple framework by identifying gaps and key factors, drawing on earlier travel research. Using basic relationship marketing ideas, this adds to past work by better understanding how KRI travel companies retain customers.
The travel agency operates in the service sector, relying on mutual trust and commitment between the agency and its customers. Building on this perspective, RMT emphasizes the creation and maintenance of a mutually beneficial relationship with current customers (Aka et al., 2016). Accordingly, the practical implications of these findings are invaluable to travel agents. Notably, this study asserts that customers of KRI travel agencies still have more trust in them than in online travel agencies. This finding mirrors that of Kaynama and Black (2000) who asserted that agents remain essential as travel information brokers or counselors. In response to these trends, travel agencies are establishing a presence on the World Wide Web, either out of competitive apprehension or to enter new markets.
Building upon the previous discussion, the study found that travel agents must provide distinctive value to maintain and win back customers. Unique service requires travel agents to differentiate holiday packages for leisure customers, ensuring they stand out in a competitive market. Furthermore, travel agents must be proficient in using technology to customize packages. As they now operate both online and in person, integrating technology can help attract more customers. They can showcase distinctive leisure travel alternatives online. Agents selling customized packages must promote them online to attract international customers, building on the need for differentiation discussed earlier.
Like all empirical research, this study has limitations. It offers practical and theoretical contributions and guides future research. First, the study suggests that future research explores factors influencing the success of KRI travel agencies. Few studies address service quality and customer retention under RM theory, and the researcher had difficulty identifying specific links in this context. Second, this study uses a cross-sectional design, which limits causal claims and generalizability compared to longitudinal studies (Sekaran & Bougie, 2016). Third, this study focuses solely on the travel agency sector within KRI, limiting the applicability of its findings. Replicating this study across industries with different buying categories and purchasing engagements would broaden the generalizability of the results. Additionally, because this study examines the KRI, future research could explore other countries and cultural contexts. Finally, this study uses quantitative methods. While suitable, KRI customer retention research could benefit from a mixed-methods approach for a fuller understanding. Limitations include a small sample size and non-probability sampling, which may affect generalizability. Future research should use larger, more diverse samples for better KRI tourism evaluation.