
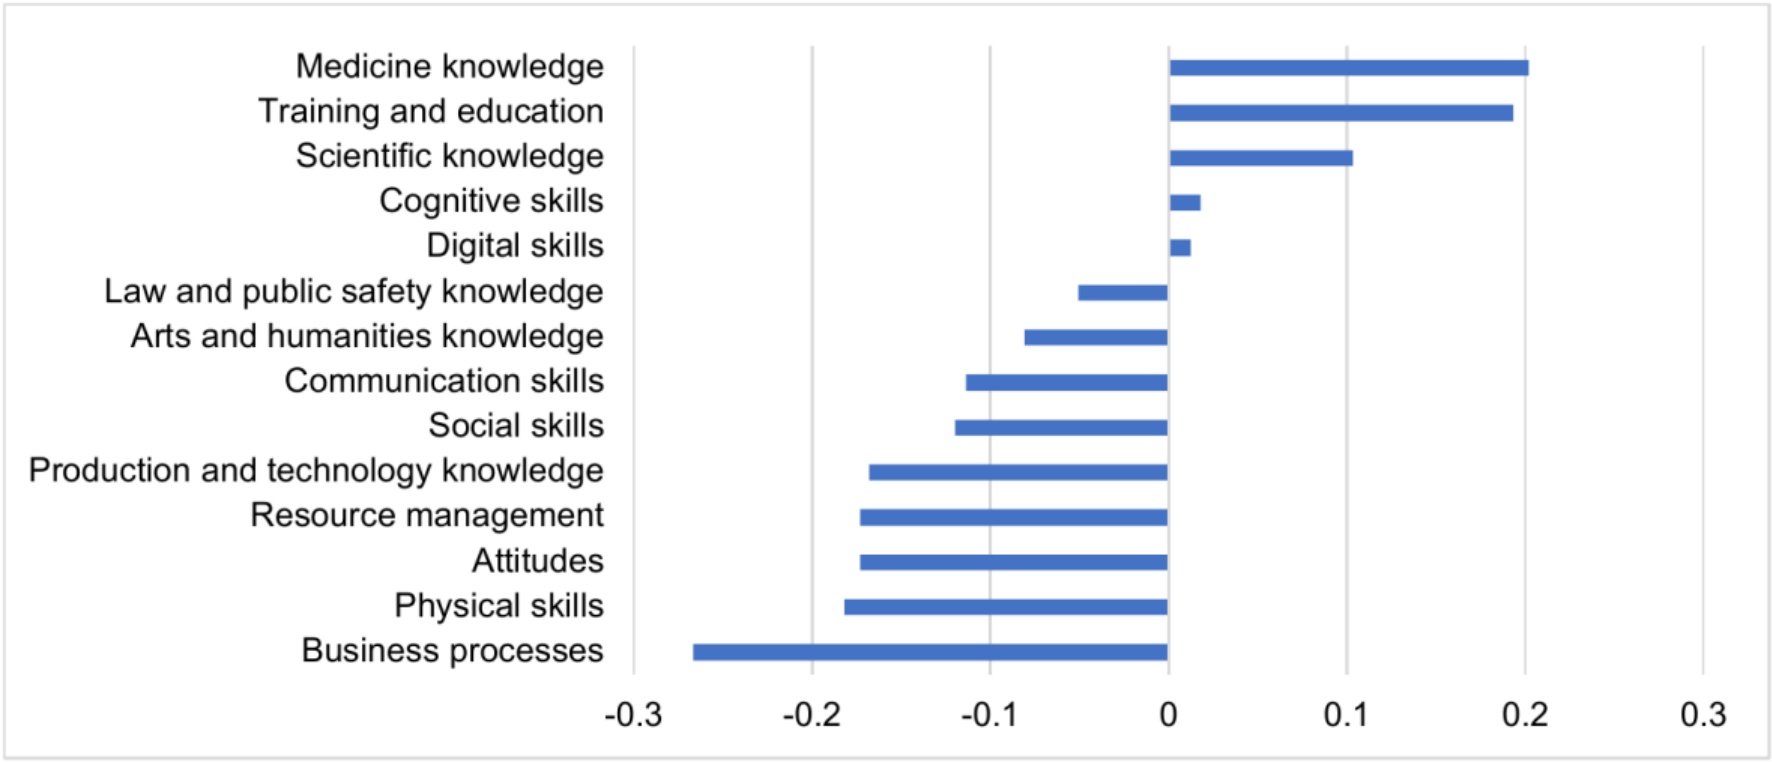
Figure 1.
Mean skill imbalance indicators across OECD labour markets
Note: Positive values indicate skill shortages, whereas negative values indicate skill surpluses, following the design of the OECD skill imbalance indicator.
Source: Author’s elaboration based on data retrieved from OECD (2024b).
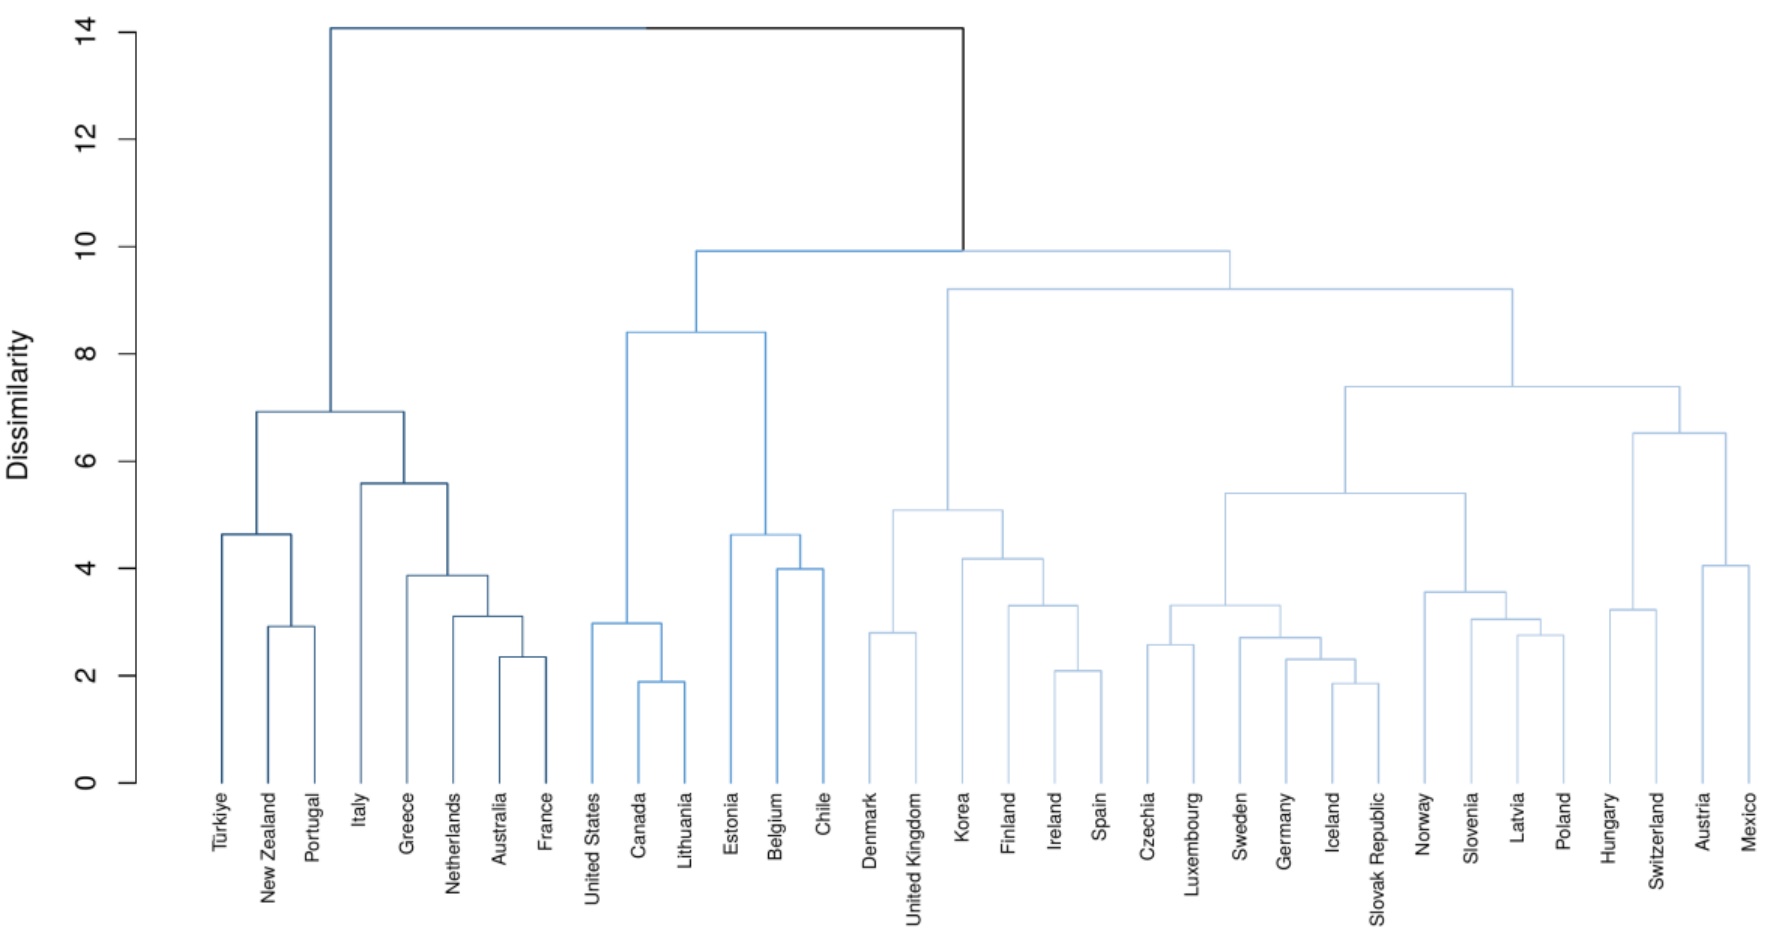
Figure 2.
Hierarchical clustering dendrogram of OECD skill imbalance profiles
Note: Dissimilarity is measured using squared Euclidean distance based on standardised skill imbalance indicators and Ward’s method.
Source: Author’s elaboration based on data retrieved from OECD (2024b).
Table 1.
Country classification according to multidimensional skill imbalance profiles
| Cluster | Skill imbalance profile | Countries |
|---|---|---|
| Cluster 1 | Socio-managerial surplus profile with training-oriented shortages | Australia, France, Greece, Italy, Netherlands, New Zealand, Portugal, Türkiye |
| Cluster 2 | Moderate knowledge-intensive shortage profile | Austria, Czechia, Denmark, Finland, Germany, Hungary, Iceland, Ireland, Korea, Latvia, Luxembourg, Mexico, Norway, Poland, Slovak Republic, Slovenia, Spain, Sweden, Switzerland, United Kingdom |
| Cluster 3 | Health-education shortage profile with production-related surpluses | Belgium, Canada, Chile, Estonia, Lithuania, United States |
[i] Source: Author’s elaboration based on data retrieved from OECD (2024b).
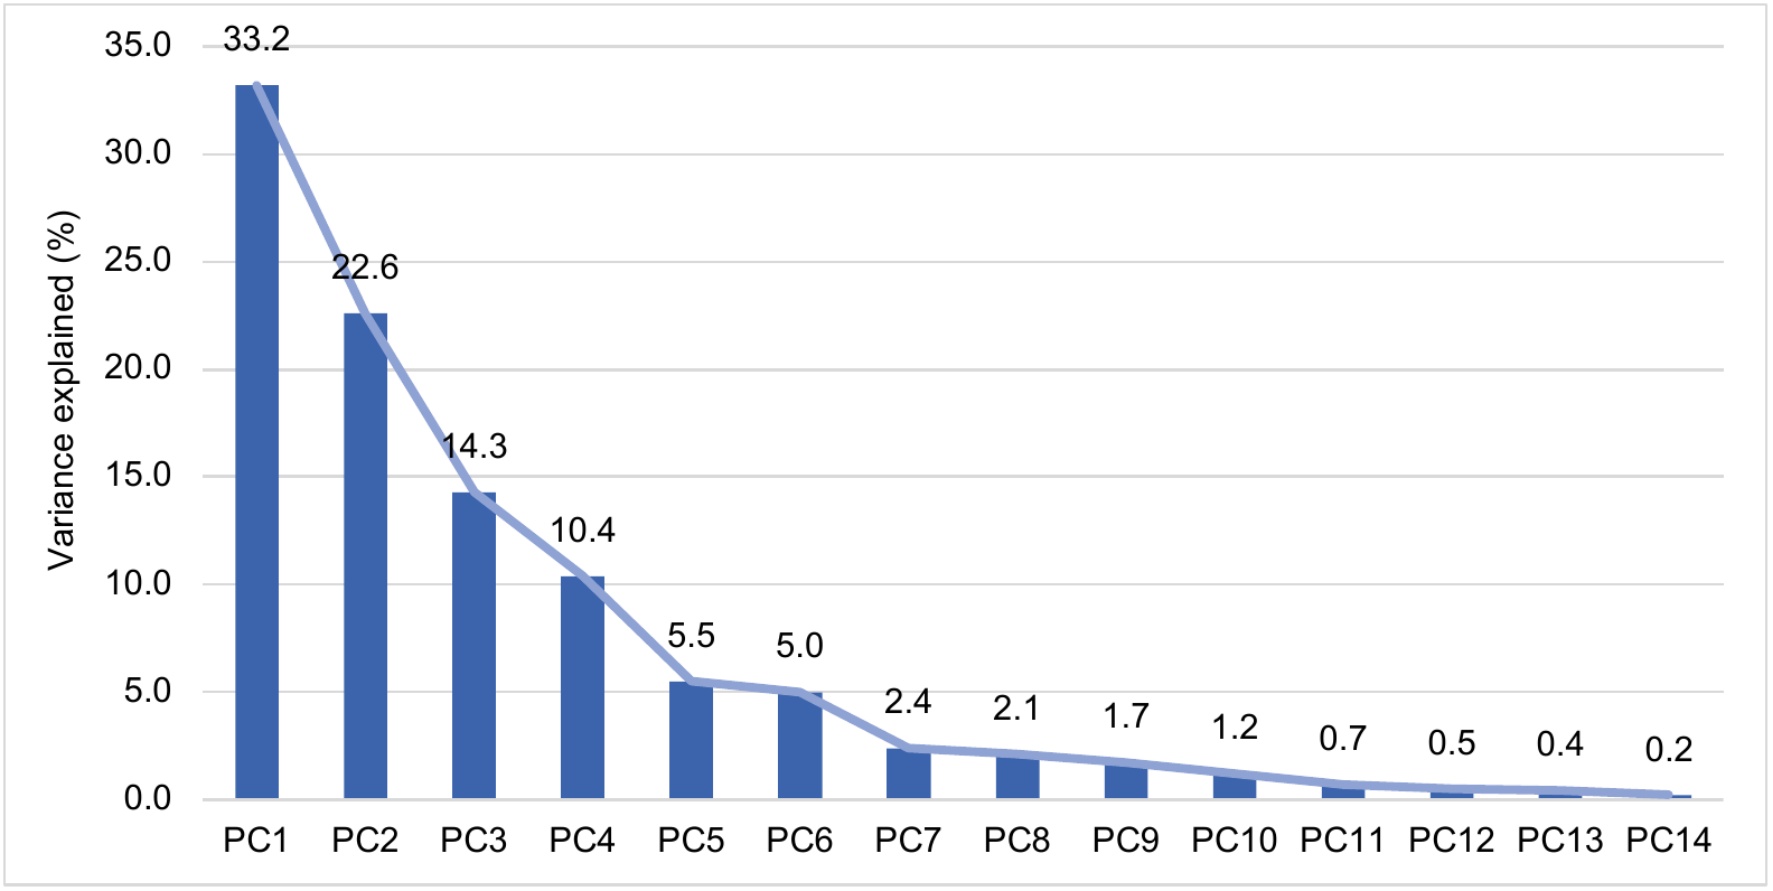
Figure 3.
Variance explained by principal components
Source: Author’s elaboration based on data retrieved from OECD (2024b).
Table 2.
Retained principal components and their interpretation
| Component | Variance explained | Cumulative variance | Dominant loadings | Interpretation |
|---|---|---|---|---|
| PC1 | 33.2% | 33.2% | Social skills, communication, resource management, arts and humanities, digital skills, law and public safety knowledge | Socio-managerial and knowledge skills |
| PC2 | 22.6% | 55.8% | Attitudes, business processes, physical skills | Traditional occupational skills |
| PC3 | 14.3% | 70.1% | Scientific knowledge, production and technology, digital skills, training and education | Technology and scientific skills |
| PC4 | 10.4% | 80.5% | Medicine, training and education, attitudes, production and technology | Human-service and educational skills |
[i] Source: Author’s elaboration based on data retrieved from OECD (2024b).
Table A1.
Descriptive statistics of skill imbalance indicators
| Skill domain | Mean | SD | Min | Max |
|---|---|---|---|---|
| Business processes | −0.267 | 0.282 | −0.779 | 0.41 |
| Physical skills | −0.182 | 0.270 | −0.705 | 0.418 |
| Attitudes | −0.173 | 0.188 | −0.582 | 0.204 |
| Resource management | −0.173 | 0.235 | −0.759 | 0.228 |
| Production and technology knowledge | −0.168 | 0.199 | −0.582 | 0.134 |
| Social skills | −0.120 | 0.188 | −0.580 | 0.247 |
| Communication skills | −0.114 | 0.174 | −0.554 | 0.13 |
| Arts and humanities knowledge | −0.081 | 0.166 | −0.451 | 0.419 |
| Law and public safety knowledge | −0.051 | 0.169 | −0.477 | 0.169 |
| Digital skills | 0.012 | 0.163 | −0.278 | 0.347 |
| Cognitive skills | 0.018 | 0.13 | −0.322 | 0.284 |
| Scientific knowledge | 0.103 | 0.171 | −0.251 | 0.487 |
| Training and education | 0.193 | 0.310 | −0.596 | 0.839 |
| Medicine knowledge | 0.202 | 0.291 | −0.561 | 0.702 |
[i] Source: Author’s elaboration based on data retrieved from OECD (2024b).
Table A2.
Cluster-level mean skill imbalance indicators
| Skill domain | Cluster 1 | Cluster 2 | Cluster 3 |
|---|---|---|---|
| Arts and humanities knowledge | −0.218 | −0.076 | 0.085 |
| Attitudes | −0.254 | −0.152 | −0.135 |
| Business processes | −0.467 | −0.261 | −0.02 |
| Cognitive skills | −0.053 | 0.022 | 0.103 |
| Communication skills | −0.352 | −0.061 | 0.027 |
| Digital skills | −0.161 | 0.093 | −0.032 |
| Law and public safety knowledge | −0.195 | 0.015 | −0.077 |
| Medicine knowledge | 0.170 | 0.165 | 0.371 |
| Physical skills | −0.125 | −0.144 | −0.386 |
| Production and technology knowledge | −0.264 | −0.055 | −0.419 |
| Resource management | −0.475 | −0.109 | 0.015 |
| Scientific knowledge | 0.027 | 0.178 | −0.042 |
| Social skills | −0.352 | −0.064 | 0.003 |
| Training and education | 0.391 | 0.071 | 0.336 |
[i] Source: Author’s elaboration based on data retrieved from OECD (2024b).
Table A3.
Component loadings of skill imbalance indicators for retained principal components
| Skill domain | PC1 | PC2 | PC3 | PC4 |
|---|---|---|---|---|
| Arts and humanities knowledge | 0.366 | −0.028 | 0.167 | 0.224 |
| Attitudes | 0.045 | 0.463 | 0.088 | −0.328 |
| Business processes | 0.165 | 0.453 | 0.192 | 0.025 |
| Cognitive skills | 0.298 | −0.228 | 0.163 | −0.234 |
| Communication skills | 0.395 | 0.201 | 0.025 | −0.183 |
| Digital skills | 0.304 | −0.155 | −0.398 | 0.071 |
| Law and public safety knowledge | 0.324 | −0.077 | −0.173 | 0.168 |
| Medicine knowledge | 0.104 | −0.225 | 0.148 | −0.516 |
| Physical skills | −0.222 | 0.403 | −0.118 | −0.194 |
| Production and technology knowledge | −0.040 | 0.215 | −0.515 | −0.334 |
| Resource management | 0.375 | 0.266 | 0.035 | −0.025 |
| Scientific knowledge | 0.087 | −0.228 | −0.520 | −0.281 |
| Social skills | 0.429 | 0.035 | −0.012 | 0.054 |
| Training and education | −0.006 | −0.273 | 0.374 | −0.472 |
[i] Note: Loadings refer to the first four retained principal components. Higher absolute values indicate stronger contributions to the respective component. The signs of PCA loadings are arbitrary and should be interpreted in relation to the component structure.
[ii] Source: Author’s elaboration based on data retrieved from OECD (2024b).