
1. Introduction
Skill shortages have become a recurring concern in labour market policy. Firms report difficulties in hiring workers with the required competencies, while governments increasingly treat skills as a central condition for productivity, innovation and public service capacity. At the same time, skill shortages rarely occur alone. Labour markets may face shortages in some domains while having surpluses in others. This makes skill imbalance more complex than a simple lack of workers or qualifications.
Much of the current debate focuses on digital skills. This is understandable given the spread of digital technologies, automation and artificial intelligence (AI) across workplaces. Recent evidence suggests that digitalisation and intelligent technologies are changing skill requirements and creating new adjustment pressures for workers, firms and education systems (OECD, 2023; Schmutzer, 2026). However, digitalisation is only one source of changing skill demand. Labour shortages have also become visible in sectors such as healthcare, education and social services, where demographic ageing and rising service demand place increasing pressure on labour supply (European Commission, 2023; OECD, 2024a).
The concept of skill imbalance is useful because it captures both sides of the mismatch problem. A shortage indicates that demand for a given skill exceeds available supply, whereas a surplus suggests that the supply of that skill is greater than labour market demand. Both situations may generate economic costs. Shortages can constrain production and service delivery, while surpluses may signal underutilised human capital, overqualification or inefficient allocation of workers across occupations. Previous research has shown that skill mismatch is shaped by technological change, education systems, labour market institutions and occupational structures (McGuinness et al., 2018; Quintini, 2011).
Despite the literature, cross-country evidence on the multidimensional structure of skill imbalances remains limited. Existing studies often focus on specific countries, occupations or individual forms of mismatch, while less attention has been paid to whether OECD countries share similar combinations of skill shortages and surpluses across broader skill domains (Brunello & Wruuck, 2021; Flisi et al., 2016; McGuinness et al., 2018). This distinction is relevant for policy, as countries may differ not only in the overall level of mismatch but also in its composition. The contribution of this letter lies in using these indicators not only to rank individual skill domains, but also to identify broader country profiles and latent dimensions of imbalance across OECD labour markets.
Therefore, this letter aims to examine skill shortages and surpluses across 14 domains in 34 OECD countries 1, identifying the main imbalance patterns, country profiles and latent dimensions of cross-country heterogeneity.
2. Theoretical foundation
The analysis builds on the skill mismatch literature, which understands mismatch as a disequilibrium between the skills supplied by workers and those required by employers. This disequilibrium may appear as overeducation, overskilling, field-of-study mismatch, shortages or surpluses. Recent literature increasingly stresses that these forms should not be treated as isolated phenomena, since labour markets may simultaneously experience shortages in some skill domains and excess supply in others (Brunello & Wruuck, 2021; McGuinness et al., 2018). This also implies that conclusions about skill mismatches may depend on how mismatch is measured and which skill dimensions are observed (Bischof, 2024).
From a task-based perspective, changes in technology alter the relative demand for specific work activities rather than simply increasing demand for all highly educated workers. Automation, digitalisation and AI may reduce demand for routine tasks while increasing the value of analytical, cognitive, digital and interpersonal capabilities (Acemoglu & Autor, 2011; Autor et al., 2003). Recent evidence on labour demand related to intelligent technologies confirms this differentiated pattern, showing that AI affects skill requirements unevenly across occupations, firms and worker groups (Engberg et al., 2025; Green & Lamby, 2025; Oleš, 2026). Digital and AI-related changes may therefore intensify some skill demands without creating a uniform shortage pattern across all labour markets.
Nonetheless, technological change is only one mechanism behind skill imbalance. Demographic change, occupational ageing, sectoral restructuring and differences in education-to-work transitions may also shape the composition of shortages and surpluses. Recent projections for Europe show that demographic change can generate persistent labour market imbalances and qualification mismatches, while job-search behaviour and skill adaptation also influence how workers adjust to changing demand (Marois et al., 2025; Wunsch et al., 2025). In addition, mismatch may reflect broader demand-side and institutional conditions, including market structure and firm-level allocation mechanisms (Balmaceda, 2025; Berloffa et al., 2026).
This framework implies that skill imbalance should be analysed as a multidimensional structure rather than as a single aggregate shortage indicator. Countries may differ not only in the extent of mismatch, but also in which skill domains are scarce, which are in surplus, and how these domains combine into broader national profiles. Based on this reasoning, the letter addresses the following research questions:
RQ1: What are the dominant patterns of skill shortages and surpluses across OECD labour markets?
RQ2: Do OECD countries cluster into distinct multidimensional skill imbalance profiles?
RQ3: What latent dimensions explain cross-country variation in skill imbalance indicators?
3. Data and methodology
Following the theoretical foundation, the empirical analysis focuses on answering three research questions concerning the dominant patterns, country profiles and latent dimensions of skill imbalances across OECD labour markets. The analysis is exploratory and does not aim to identify causal effects, but to reveal cross-country patterns in the composition of skill shortages and surpluses. The analysis is based on the OECD Skills for Jobs database (OECD, 2024b), which provides internationally comparable indicators of skill imbalances across labour markets. The analysis covers 14 skill domains, including cognitive, digital, social, managerial, scientific, educational and health-related competencies. The skill imbalance indicators are expressed as standardised indices, where positive values indicate skill shortages and negative values indicate skill surpluses.
The OECD Skills for Jobs indicators measure skill imbalances through a two-stage procedure (OECD, 2017). First, occupational imbalances are estimated using five labour-market signals: hourly wage growth, employment growth, growth in hours worked, unemployment and changes in underqualification. These indicators capture complementary dimensions of labour-market pressure. Relatively strong wage growth may signal increasing labour scarcity, while employment and hours growth reflect rising labour demand. Low unemployment indicates limited worker availability, whereas increasing underqualification may suggest that employers respond to recruitment difficulties by hiring workers with lower-than-usual qualifications.
In the second stage, occupational imbalances are mapped onto occupational skill requirements to derive skill-level shortage and surplus indicators. Importantly, individual components do not provide unambiguous evidence of shortages or surpluses when considered separately. Wage growth, for instance, may reflect institutional wage-setting, while employment growth may occur without labour scarcity. The OECD approach therefore combines several complementary signals to reduce reliance on any single proxy. Accordingly, the indicators used in this study are interpreted as composite measures of relative labour-market pressure consistent with skill shortages or surpluses rather than direct observations of unmet skill demand.
The research questions are addressed through three complementary analytical steps. First, descriptive statistics were used to identify the average magnitude and direction of skill imbalances across OECD labour markets and thus address RQ1.
Second, hierarchical agglomerative cluster analysis was employed to identify groups of countries with similar multidimensional skill imbalance profiles and address RQ2. The analysis was performed using standardised skill indicators, squared Euclidean distance as a measure of dissimilarity and Ward’s minimum variance method (Murtagh & Legendre, 2014; Ward, 1963). Ward’s method was selected because it minimises within-cluster variance and is widely used in hierarchical agglomerative clustering. The squared Euclidean distance between countries i and j was calculated as (Everitt et al., 2011):
where xik represents the standardised value of skill domain k in country i and p denotes the total number of skill domains. The examination of the hierarchical dendrogram indicated a three-cluster solution. This solution was retained because it provided an interpretable separation of country profiles while preserving sufficient within-cluster similarity. The three-cluster solution revealed meaningful differences in the composition of skill shortages and surpluses across OECD labour markets.Third, principal component analysis (PCA) was applied to uncover the underlying latent dimensions of cross-country variation in skill imbalances and address RQ3. Given the exploratory purpose and the cross-country structure of the data, PCA was employed as a descriptive dimensionality-reduction tool rather than as a confirmatory measurement model. PCA transforms the original set of standardised skill indicators into a smaller number of uncorrelated principal components expressed as a linear combination of the original variables (Jolliffe & Cadima, 2016):
where PCj represents the j-th principal component, aij denotes the component loading and xi represents the standardised value of the i-th skill indicator. The number of retained components was determined using the Kaiser criterion, whereby components with eigenvalues greater than one were selected (Kaiser, 1960). Four principal components satisfied this criterion and jointly explained 80.5% of the total variance.All statistical analyses were performed using IBM SPSS Statistics (version 28).
4. Results
Descriptive statistics are reported in Table A1, while Figure 1 illustrates the average patterns of skill shortages and surpluses across OECD labour markets. The figure reveals substantial heterogeneity in both the direction and magnitude of skill imbalances. Average shortages are most evident in medicine knowledge (0.202) and training and education (0.193), suggesting persistent recruitment difficulties in health and educational occupations. Scientific knowledge also shows a positive imbalance (0.103), while cognitive and digital skills remain relatively close to equilibrium on average (0.018 and 0.012, respectively).
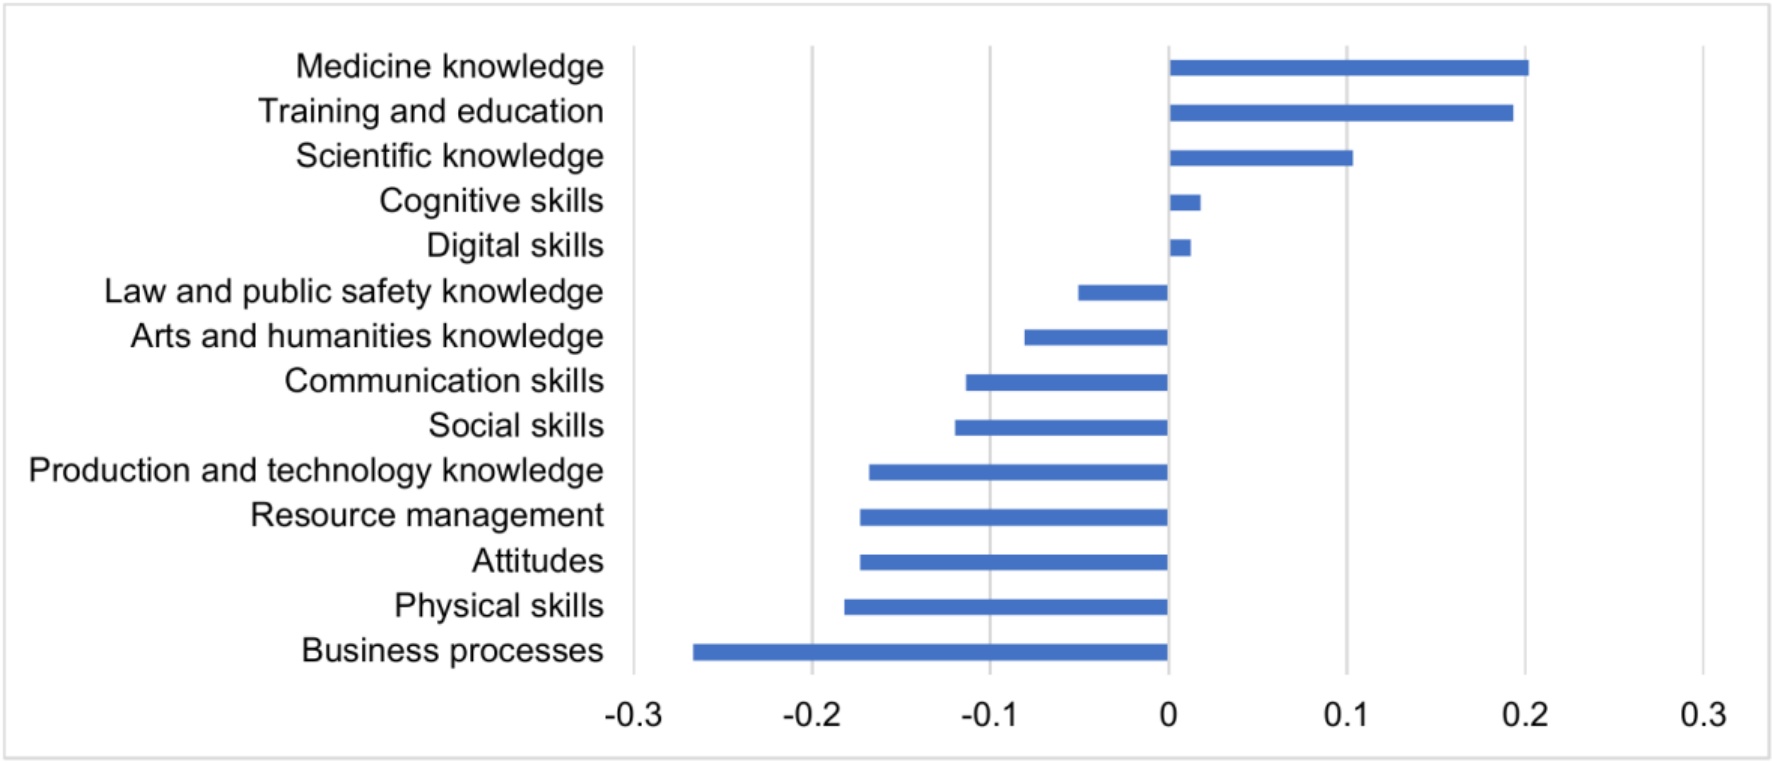
Figure 1.
Mean skill imbalance indicators across OECD labour markets
Note: Positive values indicate skill shortages, whereas negative values indicate skill surpluses, following the design of the OECD skill imbalance indicator.
Source: Author’s elaboration based on data retrieved from OECD (2024b).
In contrast, several domains exhibit average skill surpluses. The most pronounced surpluses are observed in business processes (−0.267), physical skills (−0.182), resource management (−0.173), attitudes (−0.173) and production and technology knowledge (−0.168), suggesting that skill imbalances are not uniformly associated with technological competencies; rather, they reflect a broader structural mismatch between shortages in human-capital-intensive service domains and surpluses in more traditional or administrative skill areas.
Additionally, the relatively high standard deviations (SD) for several indicators, particularly training and education (0.310), medicine knowledge (0.291), business processes (0.282) and physical skills (0.270), imply considerable variation, pointing to the existence of distinct national skill imbalance patterns rather than a single OECD-wide profile.
4.1. Multidimensional profiles of OECD skill imbalances
The hierarchical cluster analysis identifies three distinct profiles of skill imbalances across OECD labour markets. Figure 2 presents the dendrogram based on standardised skill imbalance indicators. The cluster-level mean values used to interpret the profiles are reported in Table A2.
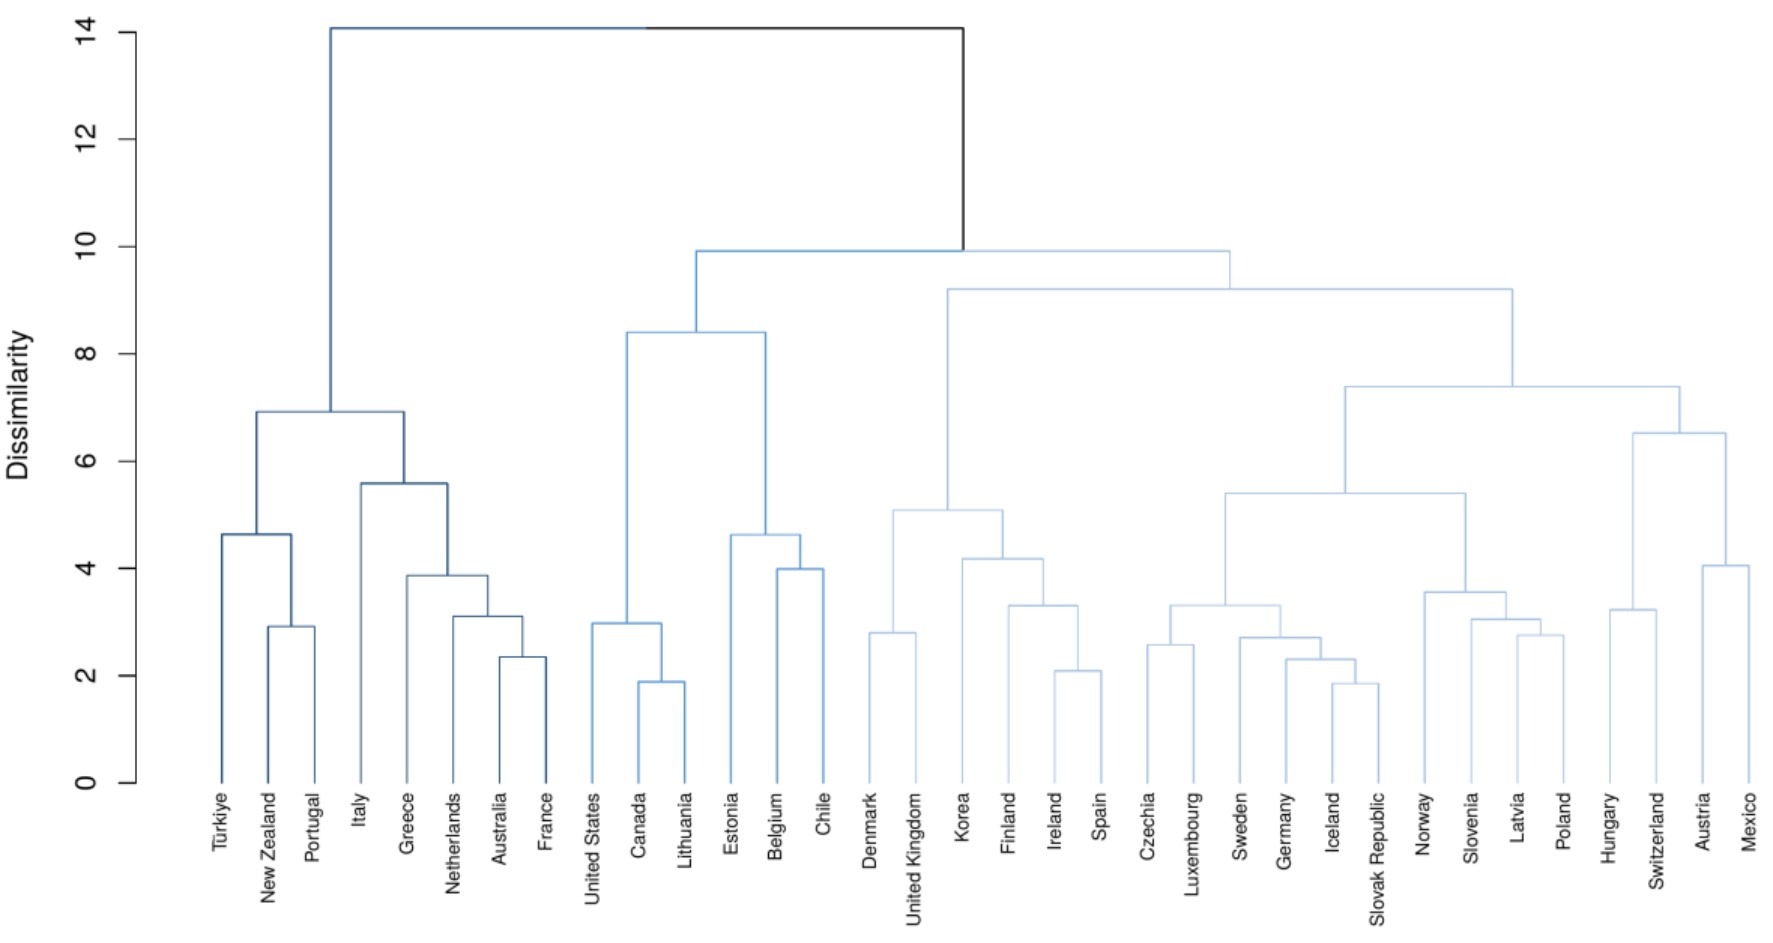
Figure 2.
Hierarchical clustering dendrogram of OECD skill imbalance profiles
Note: Dissimilarity is measured using squared Euclidean distance based on standardised skill imbalance indicators and Ward’s method.
Source: Author’s elaboration based on data retrieved from OECD (2024b).
The dendrogram suggests a three-cluster solution, indicating that OECD countries differ not only in the overall extent of skill imbalance but also in the composition of shortages and surpluses across skill domains. Table 1 further summarises the resulting country classification and profile labels.
Table 1.
Country classification according to multidimensional skill imbalance profiles
| Cluster | Skill imbalance profile | Countries |
|---|---|---|
| Cluster 1 | Socio-managerial surplus profile with training-oriented shortages | Australia, France, Greece, Italy, Netherlands, New Zealand, Portugal, Türkiye |
| Cluster 2 | Moderate knowledge-intensive shortage profile | Austria, Czechia, Denmark, Finland, Germany, Hungary, Iceland, Ireland, Korea, Latvia, Luxembourg, Mexico, Norway, Poland, Slovak Republic, Slovenia, Spain, Sweden, Switzerland, United Kingdom |
| Cluster 3 | Health-education shortage profile with production-related surpluses | Belgium, Canada, Chile, Estonia, Lithuania, United States |
[i] Source: Author’s elaboration based on data retrieved from OECD (2024b).
The first cluster is characterised by surpluses in socio-managerial skill domains, particularly resource management (−0.475), business processes (−0.467), communication skills (−0.352) and social skills (−0.352). Simultaneously, it exhibits a marked shortage in training and education (0.391). This cluster can therefore be interpreted as a socio-managerial surplus profile with training-oriented shortages.
The second cluster shows a more moderate profile, with most indicators remaining close to zero. Its main shortages are concentrated in scientific knowledge (0.178), medicine knowledge (0.165) and digital skills (0.093), while the remaining domains indicate only limited imbalances. This cluster can be interpreted as a moderate knowledge-intensive shortage profile.
The third cluster is characterised by strong shortages in medicine knowledge (0.371) and training and education (0.336), together with a smaller shortage in cognitive skills (0.103). Conversely, substantial surpluses are observed in production and technology knowledge (−0.419) and physical skills (−0.386). This cluster can therefore be interpreted as a health-education shortage profile with production-related surpluses.
Taken together, the cluster analysis indicates that OECD countries differ not only in the extent of skill imbalance, but also in the composition of shortages and surpluses across skill domains.
4.2. Latent dimensions of cross-country skill imbalances
The PCA results identify four latent dimensions of cross-country variation in skill imbalance indicators. Figure 3 shows the variance explained by each principal component, while Table 2 summarises the retained components and their interpretation. Detailed component loadings are reported in Table A3.
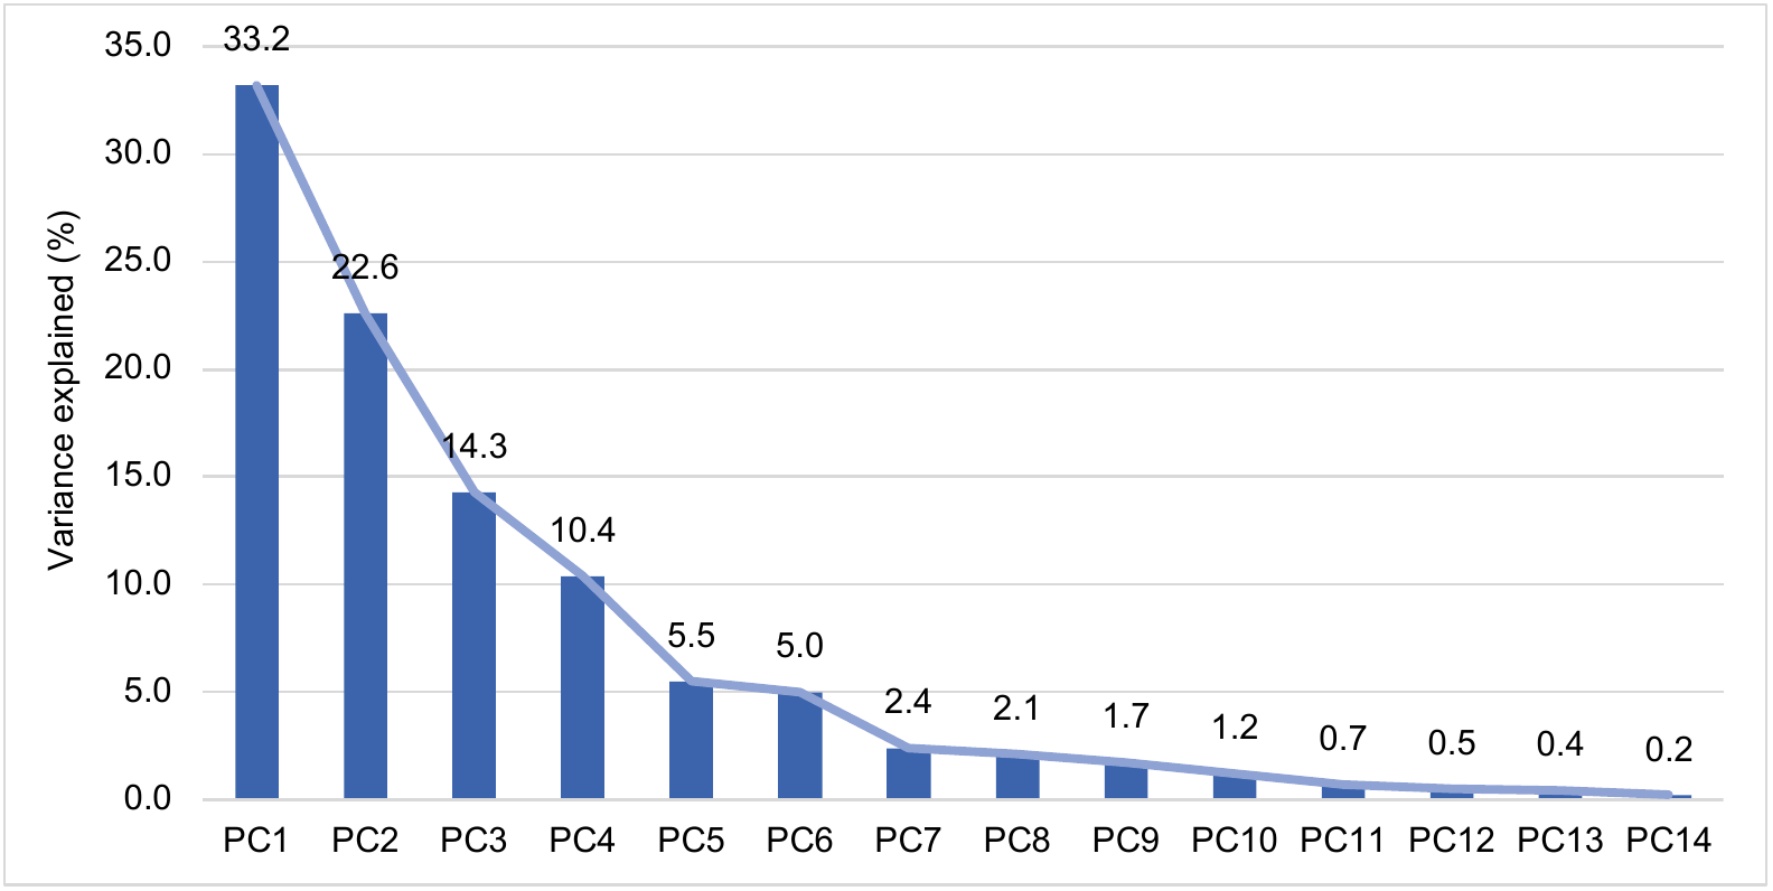
Figure 3.
Variance explained by principal components
Source: Author’s elaboration based on data retrieved from OECD (2024b).
Based on the Kaiser criterion, four components were retained, jointly explaining 80.5% of the total variance. Table 2 summarises the retained components and their interpretation.
Table 2.
Retained principal components and their interpretation
| Component | Variance explained | Cumulative variance | Dominant loadings | Interpretation |
|---|---|---|---|---|
| PC1 | 33.2% | 33.2% | Social skills, communication, resource management, arts and humanities, digital skills, law and public safety knowledge | Socio-managerial and knowledge skills |
| PC2 | 22.6% | 55.8% | Attitudes, business processes, physical skills | Traditional occupational skills |
| PC3 | 14.3% | 70.1% | Scientific knowledge, production and technology, digital skills, training and education | Technology and scientific skills |
| PC4 | 10.4% | 80.5% | Medicine, training and education, attitudes, production and technology | Human-service and educational skills |
[i] Source: Author’s elaboration based on data retrieved from OECD (2024b).
The first principal component (PC1), accounting for 33.2% of the total variance, was primarily associated with social skills, communication skills, resource management, arts and humanities knowledge, law and public safety knowledge and digital skills. This dimension reflects a broader socio-managerial and knowledge-oriented skill imbalance profile, capturing differences in the availability of interpersonal and organisational competencies across OECD labour markets.
The second component (PC2), explaining 22.6% of the variance, was characterised by high loadings for attitudes, business processes and physical skills. This component represents a traditional occupational skill dimension, reflecting imbalances related to general workplace capabilities and conventional job requirements.
The third component (PC3), accounting for 14.3% of the variance, was dominated by production and technology knowledge, scientific knowledge, digital skills and training and education. This component highlights a technology-science and training-related dimension of skill imbalance. The sign of the loadings does not affect the substantive interpretation of the component.
The fourth component (PC4), explaining an additional 10.4% of the variance, was strongly associated with medicine knowledge and training and education, with smaller contributions from production and technology knowledge and attitudes. This component reflects a human-service and educational skill dimension, underscoring specific labour market imbalances related to healthcare and educational occupations.
Overall, the PCA confirms that cross-country differences in skill imbalances are multidimensional rather than driven by a single shortage pattern. The identified components reveal distinct dimensions related to socio-managerial competencies, traditional occupational skills, technology and scientific capabilities and human-service sectors.
5. Discussion
The findings reveal that skill imbalances in OECD labour markets should not be interpreted as a general shortage of skills, nor simply as a digital skill gap. Instead, they point to a more differentiated pattern in which shortages and surpluses coexist across skill domains. This supports the broader skill mismatch literature, which emphasises that labour market imbalances are shaped by the interaction of several factors rather than by a single universal driver (McGuinness et al., 2018; Quintini, 2011). It is also consistent with recent evidence showing that the measurement and interpretation of mismatch depend on the specific skill dimensions and labour market outcomes considered (Bischof, 2024).
A key implication is that current policy debates may overstate the universality of digital skill shortages. Digitalisation and the adoption of intelligent technologies are clearly changing task content and skill requirements, but their effects are uneven across sectors and countries (Autor et al., 2003; Acemoglu & Autor, 2011; OECD, 2023). The results are consistent with this view, as skill imbalance is not concentrated in a single technological dimension but distributed across several labour market domains. Although digital skills remain relevant in some country profiles, the results suggest that they do not constitute the dominant OECD-wide imbalance. This complements recent evidence that AI-related skill demand varies across occupations, firms and worker groups rather than following a single economy-wide trajectory (Engberg et al., 2025; Green & Lamby, 2025; Oleš, 2026).
The findings also emphasise the importance of human-service sectors in contemporary labour market adjustment. Shortages related to healthcare and education are likely connected to demographic changes and difficulties in attracting and retaining workers in essential service occupations. This is consistent with recent evidence on labour shortages in healthcare and education-related sectors (European Commission, 2023; OECD, 2024a), as well as projections showing that demographic change may generate persistent labour market imbalances if qualification supply does not align with occupational demand (Marois et al., 2025).
From a policy perspective, the results favour targeted skill strategies over broad and undifferentiated upskilling agendas. Countries with different combinations of shortages and surpluses may require different policy responses, especially since skill shortages can also depend on regional and sectoral labour market structures (König & Brenner, 2025). Such responses may include sector-specific training, improved skill anticipation systems, better links between education and labour demand and stronger retention policies in shortage occupations. Recent firm-level evidence further suggests that skill shortages affect firms’ expectations and business constraints, while human resource practices and on-the-job training may help reduce mismatch (Baier et al., 2025; Berloffa et al., 2026). The main policy lesson is therefore not only to increase the supply of skills, but to improve the alignment between specific skill domains and labour market demand.
6. Conclusion
This letter aimed to provide a multidimensional assessment of skill shortages and surpluses across OECD labour markets. Its main contribution is to show the value of analysing skill imbalances not only as a single aggregate problem, but as a combination of shortages and surpluses across multiple skill domains and country contexts. This perspective provides a basis for more targeted labour market, education and training policies.
Despite this contribution, several limitations need to be acknowledged. First, the analysis relies on cross-sectional national-level indicators, which limits the ability to assess changes over time and may conceal heterogeneity across regions, sectors and occupations. Second, the empirical approach is exploratory, and the identified patterns may depend on methodological choices such as the clustering procedure, distance measure and component retention criterion. Third, the analysis inherits the measurement limitations of the OECD Skills for Jobs indicators, which infer shortages and surpluses from multiple labour-market signals rather than directly observing unmet skill demand.
Accordingly, future research should examine the dynamics of skill imbalances using longitudinal and more disaggregated occupational, sectoral or regional data. It could also investigate the determinants and consequences of different skill imbalance profiles, including their links to productivity, wages, employment transitions and demographic change. Future studies could further examine how firm-level practices, training systems and institutional settings mediate the relationship between skill imbalances and labour market outcomes.
Notes
Appendices
Appendix A
Table A1.
Descriptive statistics of skill imbalance indicators
| Skill domain | Mean | SD | Min | Max |
|---|---|---|---|---|
| Business processes | −0.267 | 0.282 | −0.779 | 0.41 |
| Physical skills | −0.182 | 0.270 | −0.705 | 0.418 |
| Attitudes | −0.173 | 0.188 | −0.582 | 0.204 |
| Resource management | −0.173 | 0.235 | −0.759 | 0.228 |
| Production and technology knowledge | −0.168 | 0.199 | −0.582 | 0.134 |
| Social skills | −0.120 | 0.188 | −0.580 | 0.247 |
| Communication skills | −0.114 | 0.174 | −0.554 | 0.13 |
| Arts and humanities knowledge | −0.081 | 0.166 | −0.451 | 0.419 |
| Law and public safety knowledge | −0.051 | 0.169 | −0.477 | 0.169 |
| Digital skills | 0.012 | 0.163 | −0.278 | 0.347 |
| Cognitive skills | 0.018 | 0.13 | −0.322 | 0.284 |
| Scientific knowledge | 0.103 | 0.171 | −0.251 | 0.487 |
| Training and education | 0.193 | 0.310 | −0.596 | 0.839 |
| Medicine knowledge | 0.202 | 0.291 | −0.561 | 0.702 |
[i] Source: Author’s elaboration based on data retrieved from OECD (2024b).
Table A2.
Cluster-level mean skill imbalance indicators
| Skill domain | Cluster 1 | Cluster 2 | Cluster 3 |
|---|---|---|---|
| Arts and humanities knowledge | −0.218 | −0.076 | 0.085 |
| Attitudes | −0.254 | −0.152 | −0.135 |
| Business processes | −0.467 | −0.261 | −0.02 |
| Cognitive skills | −0.053 | 0.022 | 0.103 |
| Communication skills | −0.352 | −0.061 | 0.027 |
| Digital skills | −0.161 | 0.093 | −0.032 |
| Law and public safety knowledge | −0.195 | 0.015 | −0.077 |
| Medicine knowledge | 0.170 | 0.165 | 0.371 |
| Physical skills | −0.125 | −0.144 | −0.386 |
| Production and technology knowledge | −0.264 | −0.055 | −0.419 |
| Resource management | −0.475 | −0.109 | 0.015 |
| Scientific knowledge | 0.027 | 0.178 | −0.042 |
| Social skills | −0.352 | −0.064 | 0.003 |
| Training and education | 0.391 | 0.071 | 0.336 |
[i] Source: Author’s elaboration based on data retrieved from OECD (2024b).
Table A3.
Component loadings of skill imbalance indicators for retained principal components
| Skill domain | PC1 | PC2 | PC3 | PC4 |
|---|---|---|---|---|
| Arts and humanities knowledge | 0.366 | −0.028 | 0.167 | 0.224 |
| Attitudes | 0.045 | 0.463 | 0.088 | −0.328 |
| Business processes | 0.165 | 0.453 | 0.192 | 0.025 |
| Cognitive skills | 0.298 | −0.228 | 0.163 | −0.234 |
| Communication skills | 0.395 | 0.201 | 0.025 | −0.183 |
| Digital skills | 0.304 | −0.155 | −0.398 | 0.071 |
| Law and public safety knowledge | 0.324 | −0.077 | −0.173 | 0.168 |
| Medicine knowledge | 0.104 | −0.225 | 0.148 | −0.516 |
| Physical skills | −0.222 | 0.403 | −0.118 | −0.194 |
| Production and technology knowledge | −0.040 | 0.215 | −0.515 | −0.334 |
| Resource management | 0.375 | 0.266 | 0.035 | −0.025 |
| Scientific knowledge | 0.087 | −0.228 | −0.520 | −0.281 |
| Social skills | 0.429 | 0.035 | −0.012 | 0.054 |
| Training and education | −0.006 | −0.273 | 0.374 | −0.472 |
[i] Note: Loadings refer to the first four retained principal components. Higher absolute values indicate stronger contributions to the respective component. The signs of PCA loadings are arbitrary and should be interpreted in relation to the component structure.
[ii] Source: Author’s elaboration based on data retrieved from OECD (2024b).