
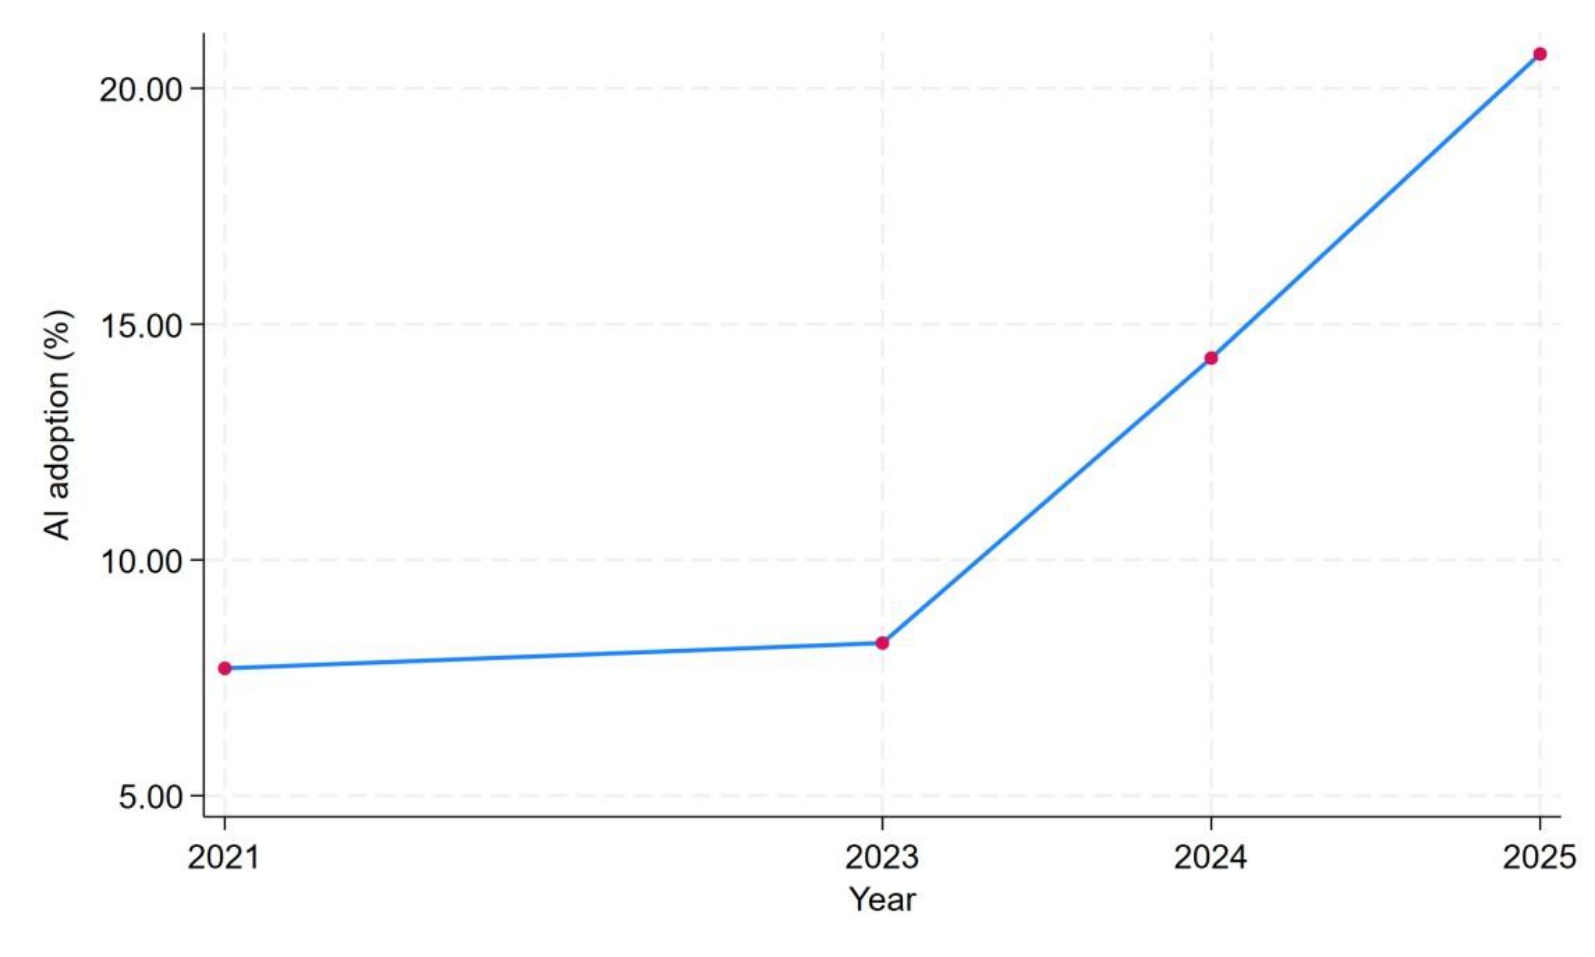
Figure 1.
AI adoption in EU-27 enterprises over time
Source: Own elaboration from Eurostat ICT-use in enterprises survey. Values are unweighted means across EU-27 countries in the working sample.
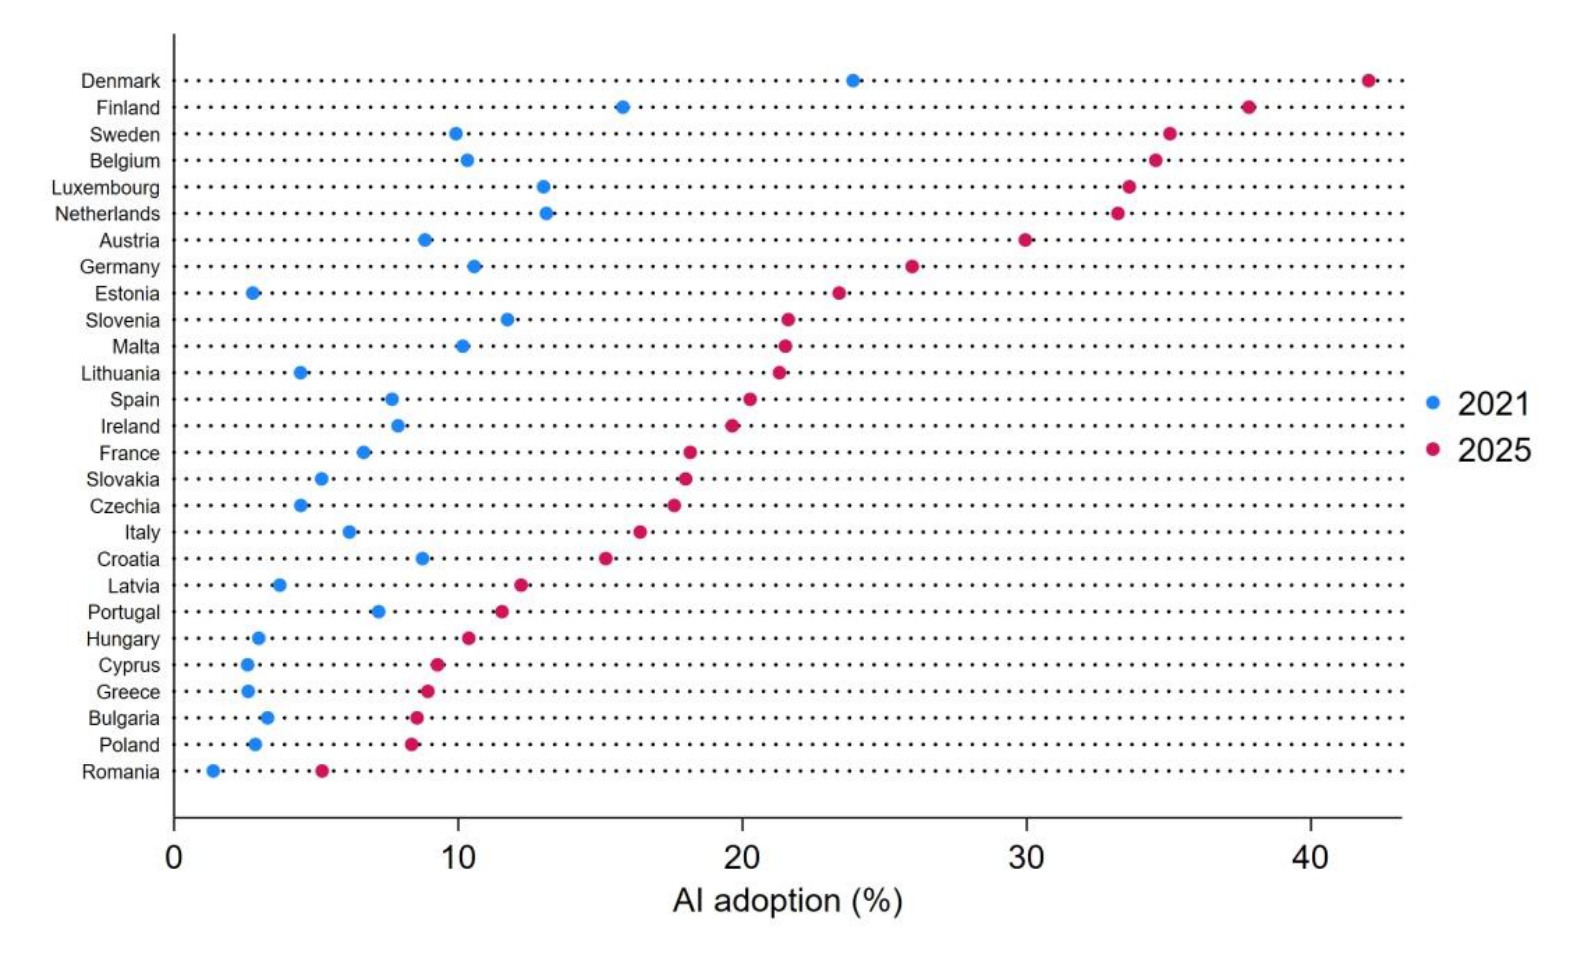
Figure 2.
AI adoption by country, 2021-2025
Source: Own elaboration from Eurostat ICT-use in enterprises survey. The figure reports percentage of enterprises using at least one AI technology by country in the initial and final year of the sample, 2021 and 2025, respectively.
Table 1.
Descriptive statistics for labour-market slack and components, by age group
| Mean | SD | Min | Max | Missing country-years obs | |
|---|---|---|---|---|---|
| Total slack, ages 15-24 | 28.53 | 10.24 | 10.70 | 52.00 | 0 |
| Unemployment, ages 15-24 | 14.58 | 5.00 | 5.50 | 31.30 | 1 |
| Underemployed part-time, ages 15-24 | 5.29 | 3.55 | 0.80 | 13.80 | 21 |
| Seeking, not available, ages 15-24 | 3.56 | 3.16 | 0.30 | 13.80 | 39 |
| Available, not seeking, ages 15-24 | 6.71 | 4.15 | 1.40 | 22.20 | 4 |
| Total slack, ages 25-54 | 9.51 | 3.85 | 3.60 | 22.10 | 0 |
| Unemployment, ages 25-54 | 5.20 | 2.16 | 2.20 | 13.80 | 0 |
| Underemployed part-time, ages 25-54 | 1.95 | 1.23 | 0.20 | 5.10 | 0 |
| Seeking, not available, ages 25-54 | 0.79 | 0.69 | 0.10 | 4.00 | 9 |
| Available, not seeking, ages 25-54 | 1.62 | 1.39 | 0.20 | 10.20 | 2 |
| Total slack, ages 55-74 | 9.38 | 3.97 | 2.90 | 22.00 | 0 |
| Unemployment, ages 55-74 | 4.29 | 1.98 | 1.70 | 12.10 | 4 |
| Underemployed part-time, ages 55-74 | 1.85 | 1.08 | 0.20 | 5.00 | 13 |
| Seeking, not available, ages 55-74 | 0.66 | 0.34 | 0.10 | 1.60 | 45 |
| Available, not seeking, ages 55-74 | 2.99 | 1.81 | 0.40 | 10.10 | 9 |
Table 2.
Descriptive statistics for AI adoption and country-year controls
| Mean | SD | Min | Max | Country-year obs | |
|---|---|---|---|---|---|
| Total | |||||
| Enterprises using at least one AI technology (%) | 12.74 | 8.76 | 1.38 | 42.03 | 108 |
| Real GDP growth | 3.14 | 3.47 | −2.70 | 16.30 | 108 |
| HICP inflation | 3.84 | 2.65 | 0.60 | 17.00 | 108 |
| Population with tertiary education (%) | 31.87 | 7.80 | 14.60 | 48.00 | 108 |
| ICT specialists (% of employment) | 5.13 | 1.45 | 2.40 | 8.90 | 108 |
| Total population, millions | 16.61 | 22.03 | 0.52 | 83.58 | 108 |
| Employment share in knowledge-intensive services | 13.29 | 3.72 | 6.55 | 27.10 | 108 |
Table 3.
AI adoption and labour-market slack by age group
| (1) | (2) | (3) | |
|---|---|---|---|
| Macro controls | Full controls | Country-year FE | |
| AI adoption (%) | 0.143** | 0.135** | |
| (0.0553) | (0.0652) | ||
| AI adoption × Youth 15-24 | 0.116*** | 0.116** | 0.116*** |
| (0.0415) | (0.0426) | (0.0411) | |
| AI adoption × Adult 25-54 | 0.0451*** | 0.0451*** | 0.0451*** |
| (0.0148) | (0.0152) | (0.0146) | |
| Constant | 12.94*** | 5.489 | 15.07*** |
| (0.630) | (34.46) | (0.220) | |
| Controls | Macro | Full | Absorbed |
| Country-age FE | Yes | Yes | Yes |
| Year FE | Yes | Yes | No |
| Country-year FE | No | No | Yes |
| Countries | 27 | 27 | 27 |
| Observations | 321 | 321 | 321 |
Notes: The dependent variable is total labour-market slack. Seniors aged 55-74 are the reference group. The main estimation sample is restricted to country-year observations with complete information for all controls used across specifications. Macro controls are GDP growth and HICP inflation; full controls add tertiary education, ICT specialists, population, knowledge-intensive services and detailed sector shares. The country-year fixed-effects model absorbs the AI main effect. Standard errors are clustered by country.
Table 4.
AI adoption and components of labour-market slack
| (1) | (2) | (3) | (4) | |
|---|---|---|---|---|
| Unemployment | Underemployed PT | Seeking, not available | Available, not seeking | |
| AI adoption × Youth 15-24 | 0.0199 | 0.0518*** | 0.0251** | 0.0235** |
| (0.0254) | (0.0173) | (0.00913) | (0.0107) | |
| AI adoption × Adult 25-54 | 0.0117 | 0.00476 | 0.00957 | 0.0167* |
| (0.00864) | (0.00584) | (0.00623) | (0.00937) | |
| Constant | 7.937*** | 2.789*** | 1.555*** | 3.620*** |
| (0.137) | (0.0888) | (0.0596) | (0.0585) | |
| Controls | Absorbed | Absorbed | Absorbed | Absorbed |
| Country-age FE | Yes | Yes | Yes | Yes |
| Year FE | No | No | No | No |
| Country-year FE | Yes | Yes | Yes | Yes |
| Countries | 27 | 25 | 20 | 27 |
| Observations | 317 | 276 | 204 | 307 |
Table 5.
Population-weighted robustness: preferred specification for slack and its components
| (1) | (2) | (3) | (4) | (5) | |
|---|---|---|---|---|---|
| Total slack | Unemployment | Underemployed PT | Seeking, not available | Available, not seeking | |
| AI adoption × Youth 15-24 | 0.0720 | −0.00193 | 0.0260** | 0.0183** | 0.0278** |
| (0.0459) | (0.0424) | (0.0111) | (0.00668) | (0.0135) | |
| AI adoption × Adult 25-54 | 0.0457*** | 0.0132 | −0.00145 | 0.00483 | 0.0266** |
| (0.0133) | (0.0144) | (0.00325) | (0.00451) | (0.0102) | |
| Constant | 16.29*** | 8.232*** | 2.879*** | 1.341*** | 4.159*** |
| (0.227) | (0.221) | (0.0480) | (0.0293) | (0.0783) | |
| Controls | Absorbed | Absorbed | Absorbed | Absorbed | Absorbed |
| Weights | Population | Population | Population | Population | Population |
| Country-age FE | Yes | Yes | Yes | Yes | Yes |
| Year FE | No | No | No | No | No |
| Country-year FE | Yes | Yes | Yes | Yes | Yes |
| Countries | 27 | 27 | 25 | 20 | 27 |
| Observations | 324 | 317 | 276 | 204 | 307 |
Table 6.
Robustness: youth defined as 15-29 versus seniors aged 55-74
| (1) | (2) | (3) | |
|---|---|---|---|
| Macro controls | Full controls | Country-year FE | |
| AI adoption (%) | 0.160*** | 0.153** | |
| (0.0510) | (0.0618) | ||
| AI adoption × Youth 15-29 | 0.122*** | 0.122*** | 0.122*** |
| (0.0310) | (0.0323) | (0.0306) | |
| Constant | 11.97*** | 7.912 | 14.25*** |
| (0.636) | (35.85) | (0.192) | |
| Controls | Macro | Full | Absorbed |
| Country-age FE | Yes | Yes | Yes |
| Year FE | Yes | Yes | No |
| Country-year FE | No | No | Yes |
| Countries | 27 | 27 | 27 |
| Observations | 214 | 214 | 214 |
Table 7.
Geographical heterogeneity across four EU regions
| (1) | (2) | (3) | (4) | |
|---|---|---|---|---|
| Northern EU | Southern EU | Western EU | Central/Eastern EU | |
| AI adoption × Youth 15-24 | 0.199** | −0.235 | 0.124*** | 0.0105 |
| (0.0625) | (0.242) | (0.0147) | (0.0997) | |
| AI adoption × Adult 25-54 | 0.0445 | 0.0113 | 0.0466** | 0.0698 |
| (0.0274) | (0.0589) | (0.0142) | (0.0436) | |
| Sample | Northern EU | Southern EU | Western EU | Central/Eastern EU |
| Controls | Absorbed | Absorbed | Absorbed | Absorbed |
| Country-age FE | Yes | Yes | Yes | Yes |
| Country-year FE | Yes | Yes | Yes | Yes |
| Countries | 7 | 6 | 6 | 8 |
| Observations | 84 | 72 | 69 | 96 |
[i] Notes: All columns estimate total slack with country-age and country-year fixed effects. North: DK, EE, FI, IE, LT, LV, SE. South: CY, EL, ES, IT, MT, PT. West: AT, BE, DE, FR, LU, NL. Central/East: BG, CZ, HR, HU, PL, RO, SI, SK. Standard errors are clustered by country within each subsample; inference is exploratory because cluster counts are small.
Table 8.
Economic significance of the preferred estimates
| Beta | Wild p-value | Effect of 10 pp | Effect of observed rise | Mean age gap | |
|---|---|---|---|---|---|
| Total slack: youth vs seniors | 0.116 | 0.013 | 1.155 | 1.505 | 19.007 |
| Total slack: adults vs seniors | 0.045 | 0.003 | 0.451 | 0.588 | 0.131 |
| Unemployment component: youth vs seniors | 0.020 | 0.448 | 0.199 | 0.259 | 10.347 |
| Unemployment component: adults vs seniors | 0.012 | 0.203 | 0.117 | 0.152 | 0.945 |
| Underemployed part-time: youth vs seniors | 0.052 | 0.009 | 0.518 | 0.675 | 3.360 |
| Underemployed part-time: adults vs seniors | 0.005 | 0.448 | 0.048 | 0.062 | 0.249 |
| Seeking, not available: youth vs seniors | 0.025 | 0.007 | 0.251 | 0.327 | 2.859 |
| Seeking, not available: adults vs seniors | 0.010 | 0.102 | 0.096 | 0.125 | 0.300 |
| Available, not seeking: youth vs seniors | 0.023 | 0.050 | 0.235 | 0.306 | 3.784 |
| Available, not seeking: adults vs seniors | 0.017 | 0.096 | 0.167 | 0.217 | −1.309 |
[i] Notes: Betas reproduce the preferred estimates in Tables 3 and 4. Wild p is based on 9,999 wild-cluster bootstrap replications clustered by country on the identical estimation sample. Effect 10pp and Effect observed scale Beta by a 10-point increase and by the EU mean 2021-2025 increase in AI adoption, respectively. Standard errors are omitted; inference in this table uses the reported wild-bootstrap p-values.