
1. Introduction
The rapid diffusion of generative artificial intelligence (AI) has revived a central question in labour economics: when new technologies enter the workplace, who gains, who loses and through which mechanisms? Unlike earlier waves of digitalisation, recent AI systems are not confined to routine clerical work or narrowly codified tasks. Large language models can draft text, summarise information, write code, process documents and support decision-making. These are precisely the types of cognitive activities that often structure entry-level work in professional, administrative and service occupations. For this reason, the effects of AI may be especially consequential for young workers at the beginning of their careers.
The task-based literature provides the natural starting point. Technologies rarely replace whole occupations mechanically; they change the allocation of tasks between labour and capital. Automation may displace workers in some activities while complementing them in others, with aggregate effects depending on the organisation of production, the creation of new tasks and the capacity of workers to move across tasks and occupations (Autor, Levy and Murnane, 2003; Acemoglu and Autor, 2011; Acemoglu and Restrepo, 2018). Recent measures of AI exposure extend this logic to cognitive occupations, showing that AI is particularly relevant for tasks involving language, information processing and analytical judgement (Webb, 2020; Felten, Raj and Seamans, 2021; Eloundou et al., 2024). Exposure, however, is not the same as realised adoption, and adoption is not the same as job loss. Whether AI produces displacement, augmentation or task reallocation depends on how firms incorporate the technology into production.
Young workers are a particularly useful group through which to study these mechanisms. Entry-level jobs are not only a source of income; they are also a site of learning, screening and occupational matching. Junior workers acquire tacit knowledge through apparently routine tasks: preparing first drafts, searching for information, checking documents, writing simple code, producing reports and observing how more experienced workers make decisions. If AI automates or reorganises these tasks, firms may reduce junior hiring, raise entry requirements or redesign early-career jobs around the supervision of machine-generated outputs. Such changes could threaten the first stage of working careers (Garicano and Rayo, 2025).
The emerging empirical evidence on AI and labour market impact points in different directions. Experimental and firm-level studies show that generative AI can increase productivity, sometimes with larger gains for novice or less experienced workers (Noy and Zhang, 2023; Brynjolfsson, Li and Raymond, 2025). This is consistent with an equalising interpretation in which AI helps less experienced workers perform tasks that previously required more experience. At the same time, recent labour-market evidence suggests that AI exposure may reduce demand for young or junior workers in some settings, particularly through lower hiring rather than immediate layoffs (Brynjolfsson, Chandar and Chen, 2025; Klein Teeselink, 2025). Evidence from Denmark, by contrast, finds rapid organisational adoption but limited short-run effects on hours and earnings (Humlum and Vestergaard, 2025). These mixed findings suggest that the early effects of AI may not be fully captured by employment or unemployment alone.
This paper contributes to this debate by linking country-year measures of enterprise AI adoption to age-specific labour-market outcomes in the EU-27. The analysis asks whether AI adoption is associated with relatively worse outcomes for workers aged 15–24 compared with adult and senior workers. It considers total labour-market slack and its four components, including unemployment. This distinction is important. Unemployment captures open joblessness, while labour-market slack provides a broader measure of underutilisation, including weaker labour-force attachment and other forms of unmet labour supply. If AI affects young workers primarily through hiring intensity, hours, unstable work or delayed transitions into stable employment, these pressures may appear first in labour-market slack rather than in unemployment.
The paper does not claim to identify the causal effect of AI adoption on youth labour market outcomes. Instead, it provides early aggregate evidence on whether the acceleration of AI adoption in European firms coincides with widening age-based labour-market gaps. This is relevant because adverse conditions at labour-market entry can have persistent consequences for wages, job quality and career progression (Kahn, 2010; Oreopoulos, von Wachter and Heisz, 2012). The results show no robust differential increase in youth unemployment associated with AI adoption. However, AI adoption is positively and robustly associated with labour-market slack among young workers relative to seniors. The evidence therefore points less to immediate youth displacement than to broader early-career underutilisation. This suggests that the labour-market consequences of AI should be assessed not only through employment levels, but also through the quality and stability of the first jobs available to young workers.
2. Data and empirical strategy
The data come from Eurostat and cover the current EU-27 member states. The working sample includes four years: 2021, 2023, 2024 and 2025. The year 2022 is excluded because the AI adoption measure is not available in the original Eurostat extraction used for the analysis. The main independent variable is the percentage of enterprises with ten or more persons employed using at least one AI technology. This measure is taken from Eurostat’s ICT use in enterprises survey.
The dependent variable is labour-market slack from the EU Labour Force Survey, expressed as a percentage of the extended labour force. Eurostat defines the extended labour force as employed and unemployed persons, who constitute the conventional labour force, plus two groups outside the labour force that nevertheless have a potential attachment to employment: persons seeking work but not immediately available and persons available to work but not seeking. Total labour-market slack captures all unmet demand for work and comprises unemployed persons, underemployed part-time workers who wish and are available to work additional hours, and the two groups in the potential additional labour force described above. This broader denominator permits meaningful comparison of the four components, even though they do not all belong to the conventional labour force. The outcomes are measured for three age groups: youth aged 15 to 24, prime-age adults aged 25 to 54, and older workers aged 55 to 74. These groups represent distinct stages of working life and allow us to compare workers entering the labour market with established workers and those approaching or continuing beyond conventional retirement ages. The 55 to 74 group is used as the reference category in the regressions. The macro-control specification includes real GDP growth and HICP inflation to account for differences in the business cycle and aggregate demand conditions that may simultaneously affect AI adoption and labour-market slack. The full-control specification additionally includes the share of the population with tertiary education, capturing human-capital endowments; the employment share of ICT specialists, capturing digital capabilities and technological readiness; total population, controlling for country size; employment in knowledge-intensive services, reflecting exposure to high-skill service activities; and sectoral employment shares, accounting for differences in economic structure and in the age composition and labour demand of different industries. The unit of observation is the country-year-age group, and the main estimating equation is presented in (1).
Ygct is alternatively total labour-market slack or one of its four components for age group g, country c and year t. Enterprise AI adoption is interacted with indicators for ages 15–24 and 25–54; seniors aged 55–74 are the omitted reference group. The macro specification includes GDP growth and inflation, while the full specification adds tertiary education, ICT specialisation, population, knowledge-intensive services and sectoral employment shares. Country-by-age-group fixed effects αcg absorb time-invariant differences in each age-specific outcome by country, and year fixed effects λt absorb shocks common to all countries. The interaction coefficients capture the additional association for youth and adults relative to seniors.
The main remaining endogeneity concern is unobserved time-varying country-level factors that might correlate with AI adoption and affect young workers differently from older workers. A tighter specification (2) replaces year fixed effects and macro controls with country-year fixed effects, which absorbs all country-year factors common to age groups, including the level of AI adoption, GDP growth, inflation and other national shocks.
where δct denotes country-year fixed effects. The main AI adoption coefficient is therefore not separately identified in this specification. The interaction coefficients are interpreted as relative associations: they show whether AI adoption is associated with different outcomes for youth and adult workers compared with senior workers within the same country-year. Standard errors are always clustered at the country level and wild bootstrapped in robustness estimations.3. Results
3.1. Descriptive patterns
Figure 1 shows the acceleration of AI adoption across EU enterprises. Average adoption in the working sample increased only slightly between 2021 and 2023, from 7.7 to 8.2 per cent of enterprises. It then rose sharply to 14.3 per cent in 2024 and 20.7 per cent in 2025. This pattern supports the focus on the immediate post-ChatGPT period while also illustrating the short time window available for aggregate labour-market adjustment.
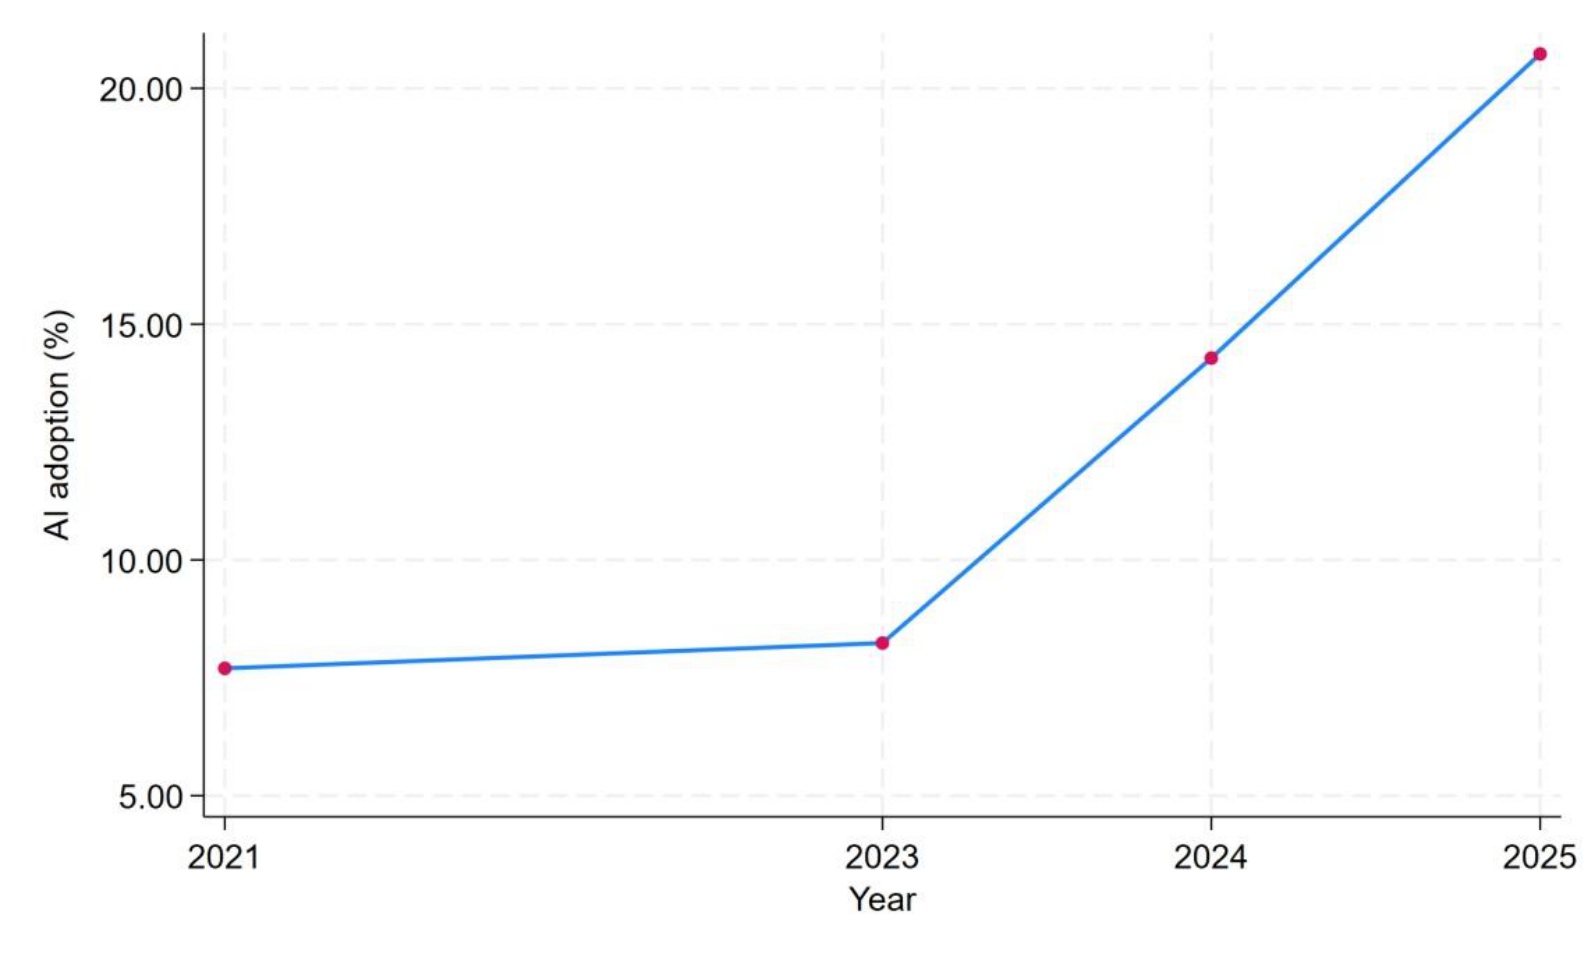
Figure 1.
AI adoption in EU-27 enterprises over time
Source: Own elaboration from Eurostat ICT-use in enterprises survey. Values are unweighted means across EU-27 countries in the working sample.
Figure 2 highlights substantial cross-country heterogeneity. AI adoption over the sample period is highest in Denmark, Finland, Luxembourg, the Netherlands, Belgium and Sweden, and lowest in Romania, Poland, Bulgaria, Cyprus and Hungary. This cross-country dispersion reveals different timing of adoption and pace of diffusion across member states.
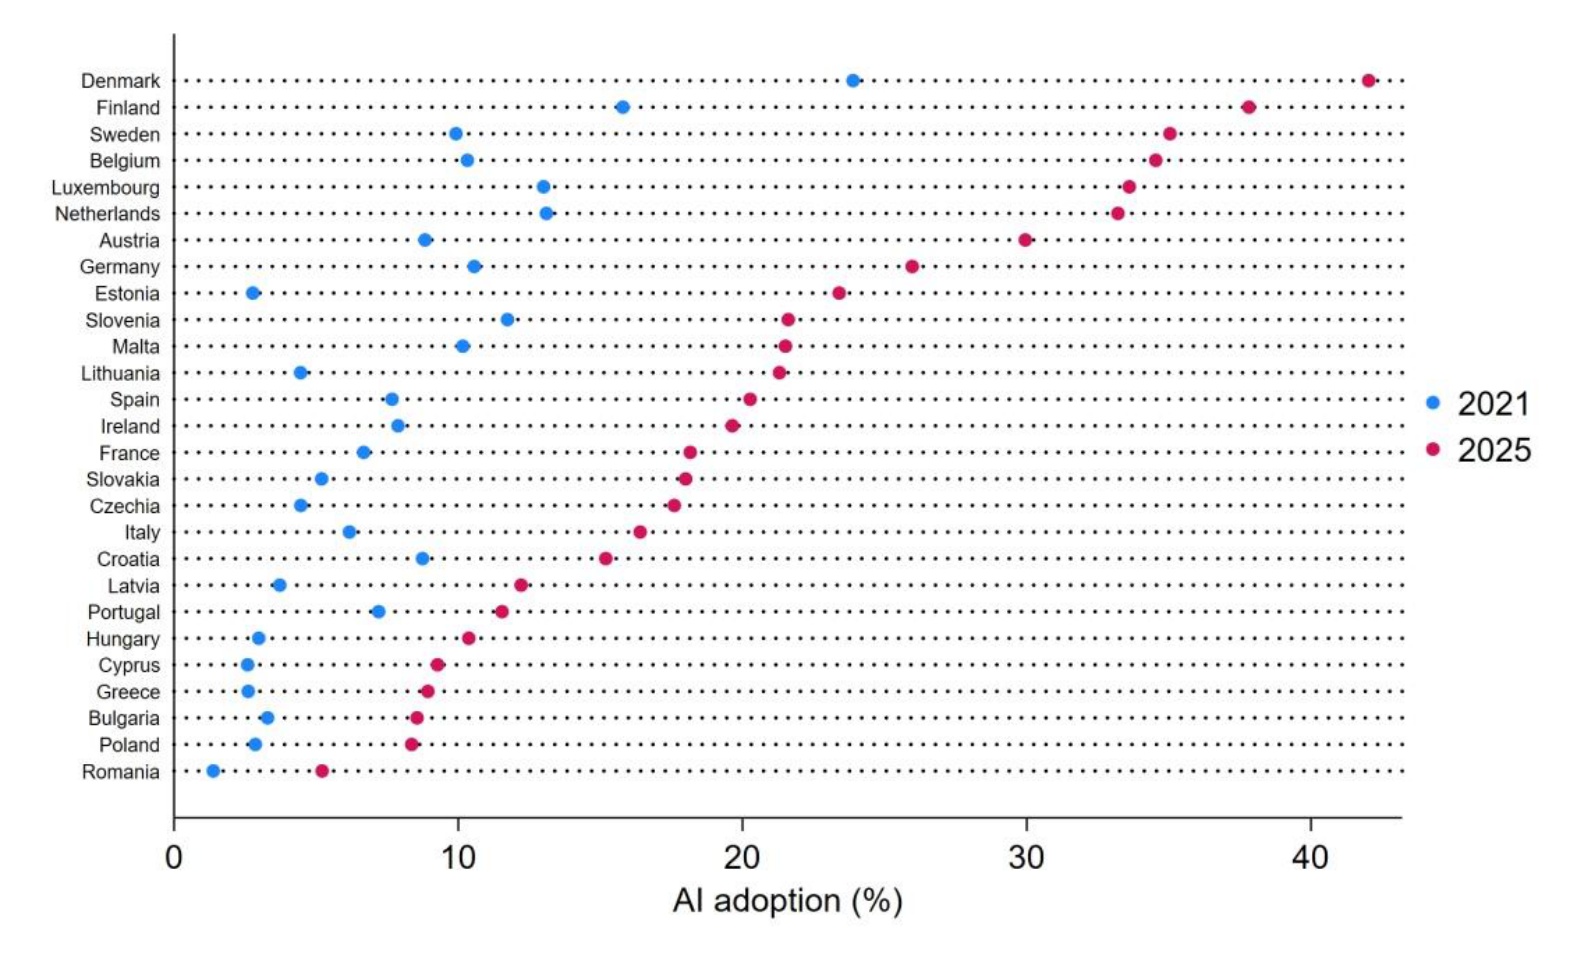
Figure 2.
AI adoption by country, 2021-2025
Source: Own elaboration from Eurostat ICT-use in enterprises survey. The figure reports percentage of enterprises using at least one AI technology by country in the initial and final year of the sample, 2021 and 2025, respectively.
Table 1 reports descriptive statistics for total labour-market slack and its components by age group, including the number of missing country-years in the sample. Youth exhibit substantially higher total slack than adults and seniors. Table 2 summarises AI adoption and the main country-year controls.
Table 1.
Descriptive statistics for labour-market slack and components, by age group
| Mean | SD | Min | Max | Missing country-years obs | |
|---|---|---|---|---|---|
| Total slack, ages 15-24 | 28.53 | 10.24 | 10.70 | 52.00 | 0 |
| Unemployment, ages 15-24 | 14.58 | 5.00 | 5.50 | 31.30 | 1 |
| Underemployed part-time, ages 15-24 | 5.29 | 3.55 | 0.80 | 13.80 | 21 |
| Seeking, not available, ages 15-24 | 3.56 | 3.16 | 0.30 | 13.80 | 39 |
| Available, not seeking, ages 15-24 | 6.71 | 4.15 | 1.40 | 22.20 | 4 |
| Total slack, ages 25-54 | 9.51 | 3.85 | 3.60 | 22.10 | 0 |
| Unemployment, ages 25-54 | 5.20 | 2.16 | 2.20 | 13.80 | 0 |
| Underemployed part-time, ages 25-54 | 1.95 | 1.23 | 0.20 | 5.10 | 0 |
| Seeking, not available, ages 25-54 | 0.79 | 0.69 | 0.10 | 4.00 | 9 |
| Available, not seeking, ages 25-54 | 1.62 | 1.39 | 0.20 | 10.20 | 2 |
| Total slack, ages 55-74 | 9.38 | 3.97 | 2.90 | 22.00 | 0 |
| Unemployment, ages 55-74 | 4.29 | 1.98 | 1.70 | 12.10 | 4 |
| Underemployed part-time, ages 55-74 | 1.85 | 1.08 | 0.20 | 5.00 | 13 |
| Seeking, not available, ages 55-74 | 0.66 | 0.34 | 0.10 | 1.60 | 45 |
| Available, not seeking, ages 55-74 | 2.99 | 1.81 | 0.40 | 10.10 | 9 |
Table 2.
Descriptive statistics for AI adoption and country-year controls
| Mean | SD | Min | Max | Country-year obs | |
|---|---|---|---|---|---|
| Total | |||||
| Enterprises using at least one AI technology (%) | 12.74 | 8.76 | 1.38 | 42.03 | 108 |
| Real GDP growth | 3.14 | 3.47 | −2.70 | 16.30 | 108 |
| HICP inflation | 3.84 | 2.65 | 0.60 | 17.00 | 108 |
| Population with tertiary education (%) | 31.87 | 7.80 | 14.60 | 48.00 | 108 |
| ICT specialists (% of employment) | 5.13 | 1.45 | 2.40 | 8.90 | 108 |
| Total population, millions | 16.61 | 22.03 | 0.52 | 83.58 | 108 |
| Employment share in knowledge-intensive services | 13.29 | 3.72 | 6.55 | 27.10 | 108 |
3.2. Panel data estimates
Table 3 reports the main fixed-effects estimates for total labour-market slack. The first specification includes country-age and year fixed effects with macro controls; the second adds the full set of controls; and the preferred specification includes country-age and country-year fixed effects. Table 4 applies the preferred specification to each slack component using the available sample for that outcome.
Table 3.
AI adoption and labour-market slack by age group
| (1) | (2) | (3) | |
|---|---|---|---|
| Macro controls | Full controls | Country-year FE | |
| AI adoption (%) | 0.143** | 0.135** | |
| (0.0553) | (0.0652) | ||
| AI adoption × Youth 15-24 | 0.116*** | 0.116** | 0.116*** |
| (0.0415) | (0.0426) | (0.0411) | |
| AI adoption × Adult 25-54 | 0.0451*** | 0.0451*** | 0.0451*** |
| (0.0148) | (0.0152) | (0.0146) | |
| Constant | 12.94*** | 5.489 | 15.07*** |
| (0.630) | (34.46) | (0.220) | |
| Controls | Macro | Full | Absorbed |
| Country-age FE | Yes | Yes | Yes |
| Year FE | Yes | Yes | No |
| Country-year FE | No | No | Yes |
| Countries | 27 | 27 | 27 |
| Observations | 321 | 321 | 321 |
Notes: The dependent variable is total labour-market slack. Seniors aged 55-74 are the reference group. The main estimation sample is restricted to country-year observations with complete information for all controls used across specifications. Macro controls are GDP growth and HICP inflation; full controls add tertiary education, ICT specialists, population, knowledge-intensive services and detailed sector shares. The country-year fixed-effects model absorbs the AI main effect. Standard errors are clustered by country.
Table 4.
AI adoption and components of labour-market slack
| (1) | (2) | (3) | (4) | |
|---|---|---|---|---|
| Unemployment | Underemployed PT | Seeking, not available | Available, not seeking | |
| AI adoption × Youth 15-24 | 0.0199 | 0.0518*** | 0.0251** | 0.0235** |
| (0.0254) | (0.0173) | (0.00913) | (0.0107) | |
| AI adoption × Adult 25-54 | 0.0117 | 0.00476 | 0.00957 | 0.0167* |
| (0.00864) | (0.00584) | (0.00623) | (0.00937) | |
| Constant | 7.937*** | 2.789*** | 1.555*** | 3.620*** |
| (0.137) | (0.0888) | (0.0596) | (0.0585) | |
| Controls | Absorbed | Absorbed | Absorbed | Absorbed |
| Country-age FE | Yes | Yes | Yes | Yes |
| Year FE | No | No | No | No |
| Country-year FE | Yes | Yes | Yes | Yes |
| Countries | 27 | 25 | 20 | 27 |
| Observations | 317 | 276 | 204 | 307 |
The total-slack estimates are stable across specifications. In the preferred country-year fixed-effects model, a one-percentage-point increase in enterprise AI adoption is associated with a 0.116 percentage-point larger youth-senior slack gap and a 0.045 percentage-point larger adult-senior gap. Both differential associations are statistically significant using country-clustered standard errors.
The slack component analysis in Table 4 shows that the youth differential is positive for every component and largest for underemployed part-time work. The youth interactions are statistically significant for underemployment, seeking work but not immediately available, and being available but not seeking; the unemployment component is not statistically significant. Thus, broader underutilisation rather than unemployment alone drives the main youth result.
Tables 5 to 8 examine whether the main findings are sensitive to alternative weighting schemes, age definitions and geographical composition. Table 5 reports population-weighted estimates using the preferred specification with country-by-age-group and country-year fixed effects. Weighting by population gives greater influence to larger EU countries and therefore tests whether the unweighted findings are disproportionately driven by smaller member states. The estimated youth-senior differential remains positive for total labour-market slack, although its magnitude is smaller than in the unweighted specification. The component estimates also support the main interpretation: the youth differential remains positive and statistically significant for underemployed part-time work, persons seeking work but not immediately available, and persons available to work but not seeking, whereas the unemployment component remains statistically insignificant. Thus, the relationship continues to operate primarily through broader forms of labour underutilisation rather than open unemployment.
Table 5.
Population-weighted robustness: preferred specification for slack and its components
| (1) | (2) | (3) | (4) | (5) | |
|---|---|---|---|---|---|
| Total slack | Unemployment | Underemployed PT | Seeking, not available | Available, not seeking | |
| AI adoption × Youth 15-24 | 0.0720 | −0.00193 | 0.0260** | 0.0183** | 0.0278** |
| (0.0459) | (0.0424) | (0.0111) | (0.00668) | (0.0135) | |
| AI adoption × Adult 25-54 | 0.0457*** | 0.0132 | −0.00145 | 0.00483 | 0.0266** |
| (0.0133) | (0.0144) | (0.00325) | (0.00451) | (0.0102) | |
| Constant | 16.29*** | 8.232*** | 2.879*** | 1.341*** | 4.159*** |
| (0.227) | (0.221) | (0.0480) | (0.0293) | (0.0783) | |
| Controls | Absorbed | Absorbed | Absorbed | Absorbed | Absorbed |
| Weights | Population | Population | Population | Population | Population |
| Country-age FE | Yes | Yes | Yes | Yes | Yes |
| Year FE | No | No | No | No | No |
| Country-year FE | Yes | Yes | Yes | Yes | Yes |
| Countries | 27 | 27 | 25 | 20 | 27 |
| Observations | 324 | 317 | 276 | 204 | 307 |
Table 6.
Robustness: youth defined as 15-29 versus seniors aged 55-74
| (1) | (2) | (3) | |
|---|---|---|---|
| Macro controls | Full controls | Country-year FE | |
| AI adoption (%) | 0.160*** | 0.153** | |
| (0.0510) | (0.0618) | ||
| AI adoption × Youth 15-29 | 0.122*** | 0.122*** | 0.122*** |
| (0.0310) | (0.0323) | (0.0306) | |
| Constant | 11.97*** | 7.912 | 14.25*** |
| (0.636) | (35.85) | (0.192) | |
| Controls | Macro | Full | Absorbed |
| Country-age FE | Yes | Yes | Yes |
| Year FE | Yes | Yes | No |
| Country-year FE | No | No | Yes |
| Countries | 27 | 27 | 27 |
| Observations | 214 | 214 | 214 |
Table 7.
Geographical heterogeneity across four EU regions
| (1) | (2) | (3) | (4) | |
|---|---|---|---|---|
| Northern EU | Southern EU | Western EU | Central/Eastern EU | |
| AI adoption × Youth 15-24 | 0.199** | −0.235 | 0.124*** | 0.0105 |
| (0.0625) | (0.242) | (0.0147) | (0.0997) | |
| AI adoption × Adult 25-54 | 0.0445 | 0.0113 | 0.0466** | 0.0698 |
| (0.0274) | (0.0589) | (0.0142) | (0.0436) | |
| Sample | Northern EU | Southern EU | Western EU | Central/Eastern EU |
| Controls | Absorbed | Absorbed | Absorbed | Absorbed |
| Country-age FE | Yes | Yes | Yes | Yes |
| Country-year FE | Yes | Yes | Yes | Yes |
| Countries | 7 | 6 | 6 | 8 |
| Observations | 84 | 72 | 69 | 96 |
[i] Notes: All columns estimate total slack with country-age and country-year fixed effects. North: DK, EE, FI, IE, LT, LV, SE. South: CY, EL, ES, IT, MT, PT. West: AT, BE, DE, FR, LU, NL. Central/East: BG, CZ, HR, HU, PL, RO, SI, SK. Standard errors are clustered by country within each subsample; inference is exploratory because cluster counts are small.
Table 8.
Economic significance of the preferred estimates
| Beta | Wild p-value | Effect of 10 pp | Effect of observed rise | Mean age gap | |
|---|---|---|---|---|---|
| Total slack: youth vs seniors | 0.116 | 0.013 | 1.155 | 1.505 | 19.007 |
| Total slack: adults vs seniors | 0.045 | 0.003 | 0.451 | 0.588 | 0.131 |
| Unemployment component: youth vs seniors | 0.020 | 0.448 | 0.199 | 0.259 | 10.347 |
| Unemployment component: adults vs seniors | 0.012 | 0.203 | 0.117 | 0.152 | 0.945 |
| Underemployed part-time: youth vs seniors | 0.052 | 0.009 | 0.518 | 0.675 | 3.360 |
| Underemployed part-time: adults vs seniors | 0.005 | 0.448 | 0.048 | 0.062 | 0.249 |
| Seeking, not available: youth vs seniors | 0.025 | 0.007 | 0.251 | 0.327 | 2.859 |
| Seeking, not available: adults vs seniors | 0.010 | 0.102 | 0.096 | 0.125 | 0.300 |
| Available, not seeking: youth vs seniors | 0.023 | 0.050 | 0.235 | 0.306 | 3.784 |
| Available, not seeking: adults vs seniors | 0.017 | 0.096 | 0.167 | 0.217 | −1.309 |
[i] Notes: Betas reproduce the preferred estimates in Tables 3 and 4. Wild p is based on 9,999 wild-cluster bootstrap replications clustered by country on the identical estimation sample. Effect 10pp and Effect observed scale Beta by a 10-point increase and by the EU mean 2021-2025 increase in AI adoption, respectively. Standard errors are omitted; inference in this table uses the reported wild-bootstrap p-values.
Table 6 considers an alternative definition of youth that includes individuals aged 15 to 29. This broader category accounts for the later entry of university graduates into full-time employment and for the fact that school-to-work transitions increasingly extend beyond age 24. The estimated AI adoption interaction remains positive for the broader youth group, indicating that the main result is not dependent on using the narrower 15 to 24 age categories.
Table 7 examines geographical heterogeneity by dividing all 27 EU countries into four exhaustive regions: Northern, Southern, Western, and Central and Eastern Europe. The positive youth-senior differential is most evident in Northern and Western Europe, while the estimates for Southern and Central and Eastern Europe are less precise and do not show the same pattern. These differences may reflect regional variation in the speed and intensity of AI adoption, economic structure, labour-market institutions, educational systems and the sectoral distribution of younger workers. However, these results should be interpreted cautiously as exploratory evidence of heterogeneity rather than as definitive evidence that AI adoption has no effect in particular regions.
Finally, Table 8 evaluates the economic and statistical significance of the preferred estimates. The coefficients exactly reproduce the estimates reported in Tables 3 and 4, while statistical inference is based exclusively on wild-cluster bootstrap p-values. This procedure provides a more reliable inference check given the limited number of country clusters. For total labour-market slack, a 10 percentage-point increase in enterprise AI adoption is associated with an approximately 1.16 percentage-point widening of the youth-senior slack gap. Applying the observed increase in average AI adoption between 2021 and 2025 implies a widening of approximately 1.51 percentage points, equivalent to about 7.9 per cent of the mean youth-senior slack gap. The wild-bootstrap p-value of 0.013 confirms that the estimated youth differential remains statistically significant under this more demanding inference procedure. The component calculations reinforce the earlier interpretation, as the most economically and statistically relevant youth effects are concentrated in underemployed part-time work and the two categories capturing weaker attachment to the labour force, rather than in unemployment.
4. Discussion
The results provide early aggregate evidence on the relationship between enterprise AI adoption and age-specific labour-market slack in Europe. The main contribution is to show that the association is visible across broader margins of labour underutilisation and is not driven by the unemployment component.
The decomposition is important for interpreting the results. The unemployment component does not show a statistically significant additional youth penalty, whereas underemployed part-time work and weaker forms of labour-force attachment do. At this early stage of diffusion, AI-related adjustment may therefore appear through hours, matching and attachment rather than through open unemployment alone. This interpretation is consistent with evidence that short-run effects on conventional labour-market outcomes may remain limited even when adoption is rapid (Humlum and Vestergaard, 2025), and with studies showing that AI can augment some workers and tasks (Noy and Zhang, 2023; Brynjolfsson, Li and Raymond, 2025; Dell’Acqua et al., 2026). The positive relative association is strongest for youth, while adults also display a smaller increase in total slack relative to seniors. Population-weighted estimates, alternative youth definition and the geographical subsamples broadly support the main qualitative pattern.
This pattern fits the task-based view of technological change. The task-based literature argues that technologies affect labour demand by changing the allocation of tasks between workers and capital, rather than by eliminating occupations as a whole (Autor, Levy and Murnane, 2003; Acemoglu and Autor, 2011; Acemoglu and Restrepo, 2018). From this perspective, the absence of a clear youth-specific unemployment differential does not imply that AI adoption is irrelevant for younger workers. It may instead mean that the first observable changes occur through less direct margins of labour-market adjustment. At the aggregate level considered here, labour-market slack may be better suited than unemployment to capture these early changes.
The age pattern should also be interpreted cautiously. The results do not show that AI adoption affects only young workers. Rather, they show that, relative to seniors, both youth and adult workers display higher labour-market slack when enterprise AI adoption increases, with the association being stronger for the youth group. This is consistent with the idea that workers at different career stages may be differently exposed to changes in task demand, job matching or labour utilisation. However, several limitations qualify these interpretations.
First, the analysis covers only four years, and AI adoption increases sharply only towards the end of the period. The absence of adoption data for 2022 further limits the time variation available for identifying the relationship. The estimates therefore capture early contemporaneous associations and cannot establish whether the observed labour-market responses persist, strengthen or disappear as AI diffusion continues. Second, the analysis is based on 27 country clusters. Although standard errors are clustered by country and wild-cluster bootstrap p-values are reported for the economic-significance analysis, statistical power remains limited, particularly in the regional subsamples. The geographical results should consequently be regarded as exploratory. Third, the fixed-effects strategy controls for time-invariant country-age differences and, in the preferred specification, for shocks common to all age groups within a country and year. Nevertheless, it cannot eliminate unobserved factors that vary simultaneously by country, year and age group. The estimates should therefore not be interpreted as causal effects of AI adoption. Reverse causality and omitted-variable bias also remain possible if changing labour-market conditions influence firms’ incentives to adopt AI or if other contemporaneous technological and institutional changes affect both adoption and age-specific slack. Fourth, the AI indicator measures the percentage of enterprises using at least one AI technology, but it does not capture the intensity, purpose or duration of use. It also does not identify which employees use AI, which occupations or tasks are exposed, or whether firms adopt AI to automate tasks, augment workers or reorganise production. The country-level adoption measure and the age-specific labour-market outcomes are therefore linked at an aggregate level, which prevents the identification of firm-level mechanisms and creates a risk of ecological inference.
In addition, age groups differ in their educational, sectoral and occupational composition. Although the models control for several country-level structural characteristics, part of the estimated age differential may still reflect differences in where younger and older people work rather than differences in their exposure to AI within comparable jobs. Finally, the component-specific regressions rely on different samples because data availability varies across slack components. Comparisons of coefficient magnitudes across components should therefore be made cautiously, even though each specification uses a consistent estimation sample internally. For these reasons, the findings should be read as exploratory evidence of early aggregate labour-market adjustment rather than as proof that AI adoption causes greater slack among younger workers. Future research should combine firm-level measures of AI adoption with information on workers’ age, occupation and experience, and examine outcomes such as hiring, vacancies, working hours, wages, separations, contract stability and transitions into employment. Longer panels would make it possible to study adjustment dynamics and distinguish temporary disruption from persistent effects. Combining realised adoption measures with occupational or task-level exposure indicators would also help determine whether the observed age differences reflect direct exposure to AI-relevant tasks, changes in the sectoral composition of employment or broader developments associated with digital transformation. Finally, future work should distinguish among different uses and intensities of AI, since the labour-market consequences of adoption are likely to depend on whether firms primarily use these technologies to automate tasks, augment workers or reorganise production.
5. Conclusion
Existing studies suggest that demand for junior workers may be affected by the organisational adoption of artificial intelligence through hiring or task reallocation. This paper provides early evidence that enterprise AI adoption is associated with higher relative labour-market slack among younger workers in EU countries. The component estimates shift attention away from unemployment alone and towards underemployment and weaker labour-force attachment as possible early margins of adjustment.
This distinction matters for how the labour-market effects of AI should be monitored. If AI affects young workers mainly through hiring, hours, job quality or weaker labour-market attachment, unemployment rates alone may provide an incomplete picture. The first effects of AI may appear not as a sudden increase in job displacement, but as a deterioration in the quality and stability of early-career labour-market entry. As AI adoption spreads, policymakers and researchers should therefore pay close attention to the first rung of the labour-market ladder: not only whether young people work, but whether they obtain jobs that allow them to accumulate skills, experience and career progression. The central challenge is to ensure that AI becomes a tool for early-career augmentation rather than a mechanism that narrows access to meaningful labour-market entry.
Acknowledgements
The initial idea for this research was developed as part of Isabel’s undergraduate thesis at the University of Seville, under Javier’s supervision.
Declarations
[23] Use of generative AI-assisted tools: The authors used generative AI-assisted tools, namely Gemini and ChatGPT, for proofreading and formatting support during the preparation of a version of the manuscript. The authors subsequently reviewed and edited the manuscript in full and take complete responsibility for the content of the article.