
Table 1.
Chemical composition of dried berries of Elaeagnus rhamnoides (L.) A. Nelson
| Parameter | Content | Parameter | Content | Parameter | Content |
|---|---|---|---|---|---|
| Proteins (%) | 17.3 | Fats (%) | 17.1 | Ca (mg/kg) | 857 |
| Alanine (g/kg) | 3.7 | Saturated fatty acids (g/100 g of fat) | 47.7 | P (mg/kg) | 2,383 |
| Arginine (g/kg) | 14.9 | Monounsaturated fatty acids (g/100 g of fat) | 24.9 | K (mg/kg) | 1,465 |
| Glycine (g/kg) | 6.3 | Polyunsaturated fatty acids (g/100 g of fat) | 37.5 | S (mg/kg) | 2,592 |
| Histidine (g/kg) | 4.4 | Palmitic acid (g/100 g of fat) | 43.5 | Mg (mg/kg) | 687 |
| Isoleucine (g/kg) | 5.5 | Palmitoleic acid (g/100 g of fat) | 12.5 | Mn (mg/kg) | 14.9 |
| Glutamic acid (g/kg) | 23.9 | Oleic acid (g/100 g of fat) | 12.1 | Zn (mg/kg) | 27 |
| Leucine (g/kg) | 9.2 | Linoleic acid (g/100 g of fat) | 27.8 | Na (mg/kg) | 88 |
| Lysine (g/kg) | 6.6 | Linolenic acid (g/100 g of fat) | 9.7 | Fe (mg/kg) | 37 |
| Phenylalanine (g/kg) | 7.7 | Myristic acid (g/100 g of fat) | 0.69 | Cu (mg/kg) | 10 |
| Proline (g/kg) | 6.1 | Heptadecanoic acid (g/100 g of fat) | 0.14 | Al (mg/kg) | 5.5 |
| Serine (g/kg) | 3.9 | Stearic acid (g/100 g of fat) | 2.6 | Se (mg/kg) | 0.48 |
| Threonine (g/kg) | 3.1 | Arachic acid (g/100 g of fat) | 0.55 | Cr (mg/kg) | <0.2 |
| Tyrosine (g/kg) | 3.5 | Eicosenoic acid (g/100 g of fat) | 0.19 | Vitamin C (mg/kg) | 1,959 |
| Valine (g/kg) | 7.1 | Docosadienoic acid (g/100 g of fat) | 0.52 | Vitamin E (mg/kg) | 124 |
| Aspartic acid (g/kg) | 17.2 | Behenic acid (g/100 g of fat) | 0.15 | Tartaric acid (g/kg) | 0.57 |
| Cystine (g/kg) | 3.2 | Total polyphenols (mg GAE/g) | 33.71 | Citric acid (g/kg) | <0.45 |
| Methionine (g/kg) | 0.8 | Total flavonoids (mg QE/g) | 36.05 | Malic acid (g/kg) | 31.3 |
| Tryptophan (g/kg) | 1.4 | Total phenolic acids (mg CAE/g) | 13.22 | β-carotene (mg/kg) | 63.1 |
| Fructose (g/kg) | 226.4 | Quercetin (mg/100 g) | 8.1 | ||
| Maltose (g/kg) | 1.2 | Isorhamnetin (mg/100 g) | 16.3 | ||
| Sucrose (g/kg) | 1.6 | Kaempferol (mg/100 g) | 2.3 |
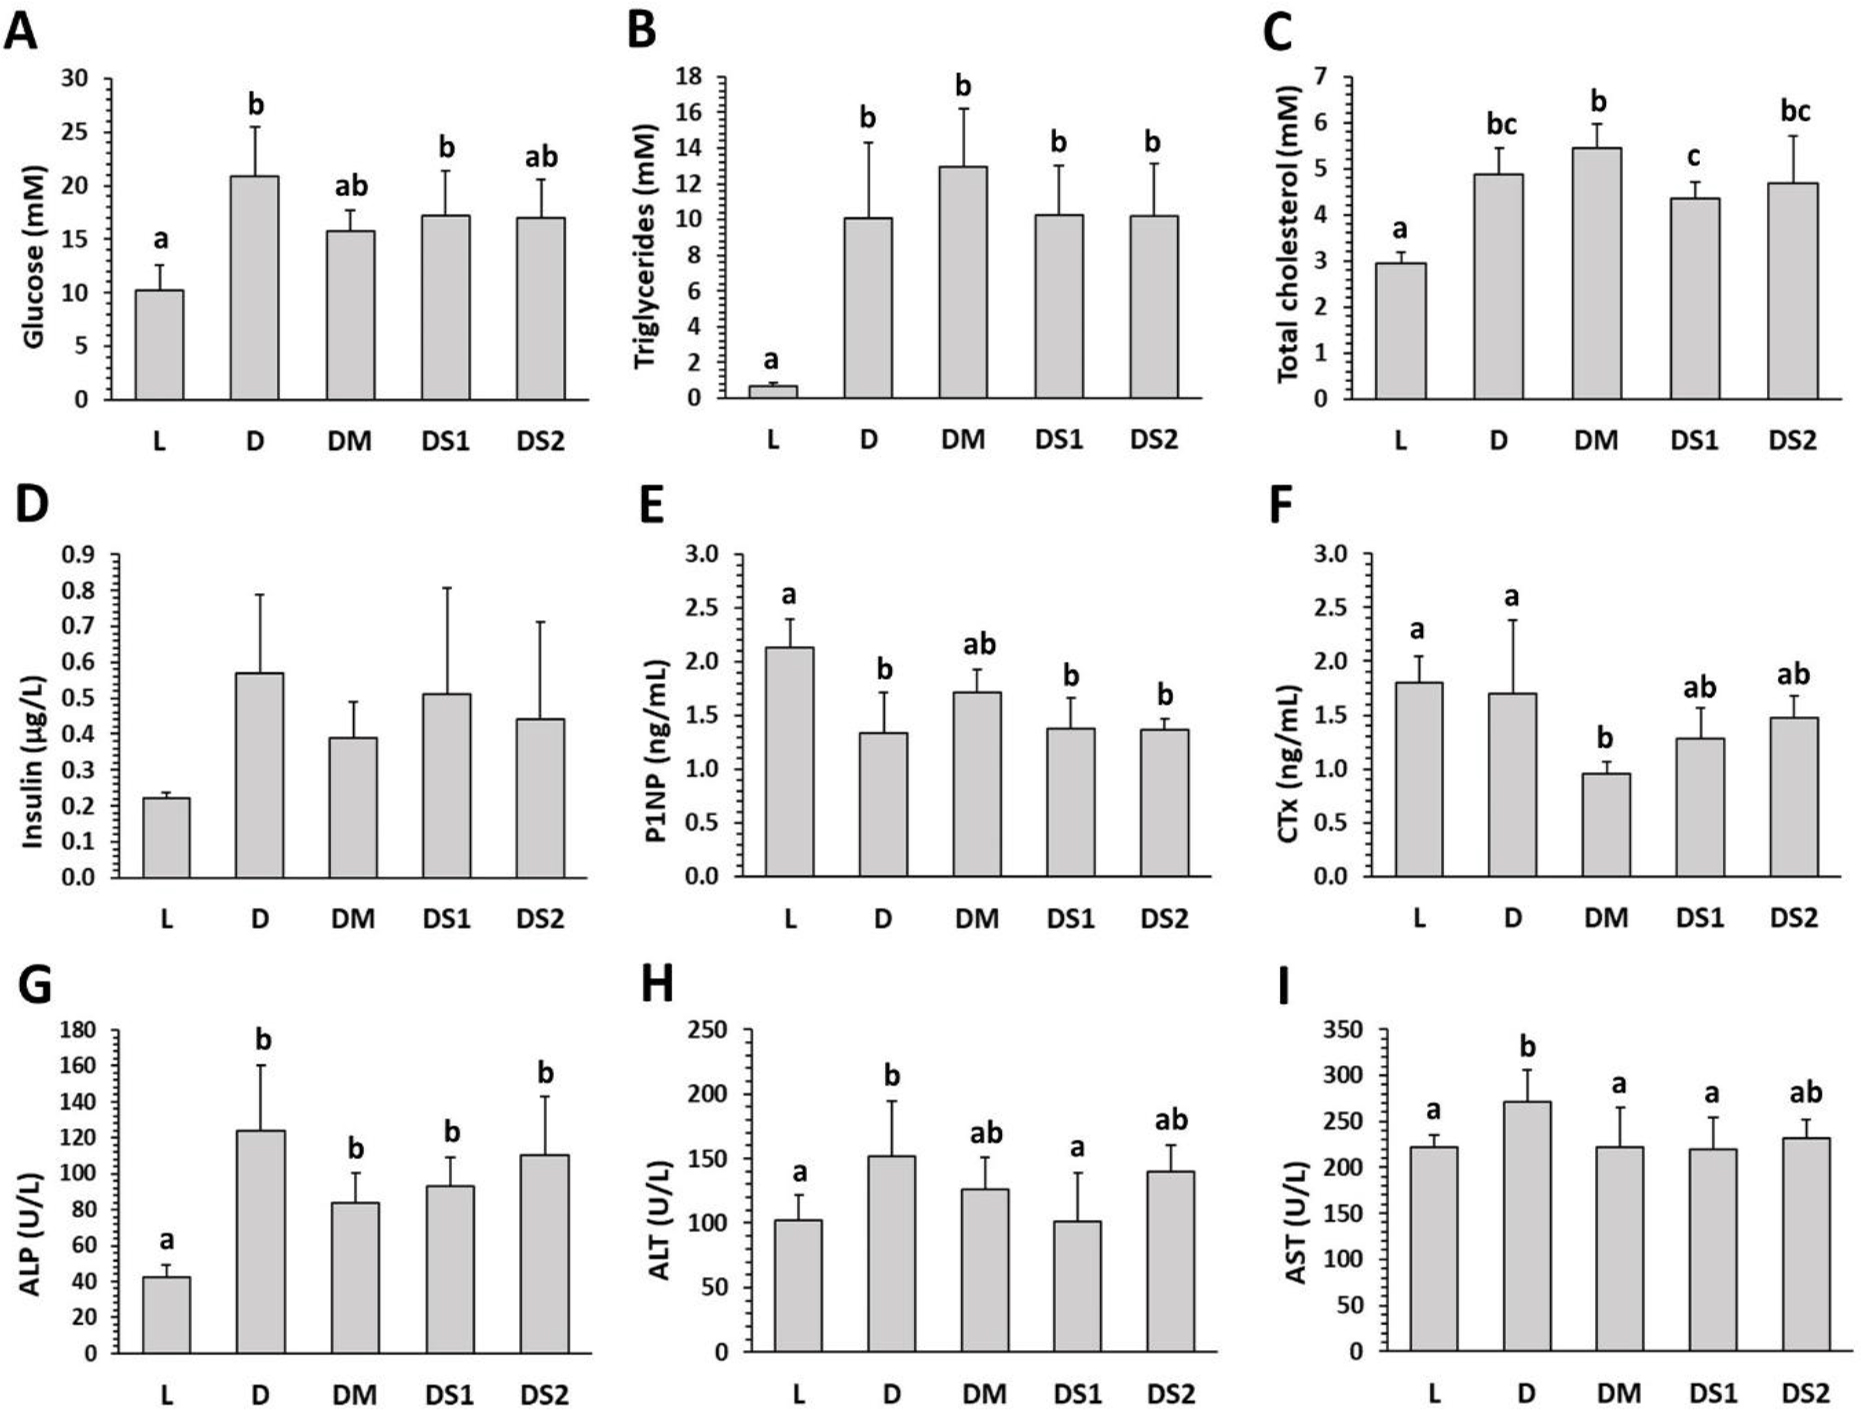
Fig. 1.
Biochemical markers investigated in lean untreated (group L), obese untreated (group D), obese metformin-treated (group DM on 150 mg/kg b.w./day), obese sea buckthorn–treated lower-dose (group DS1 on 250 mg/kg b.w./day), and obese sea buckthorn–treated higher-dose (group DS2 on 500 mg/kg b.w./day) Zucker diabetic fatty rats. P1NP – procollagen type I N-propeptide; CTx – C-terminal telopeptide of type 1 collagen; ALP – alkaline phosphatase. The data are presented as mean ±SD. a–c – different letters in the same chart indicate significant difference (P-value < 0.05)
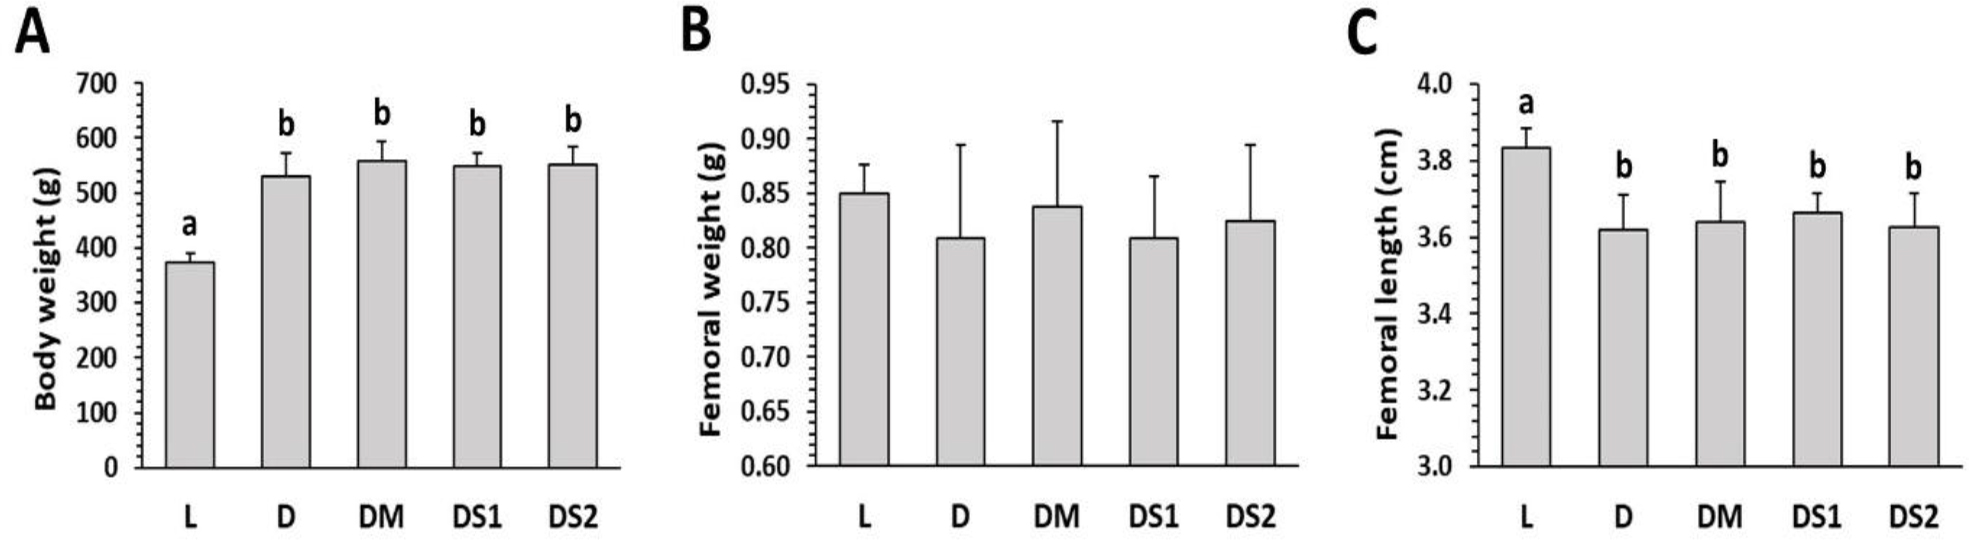
Fig. 2.
Macroscopic parameters investigated in lean untreated (group L), obese untreated (group D), obese metformin-treated (group DM on 150 mg/kg b.w./day), obese sea buckthorn–treated lower-dose (group DS1 on 250 mg/kg b.w,/day), and obese sea buckthorn–treated higher-dose (group DS2 on 500 mg/kg b.w./day) Zucker diabetic fatty rats. The data are presented as mean ±SD. a, b – different letters in the same chart indicate significant difference (P-value < 0.001)
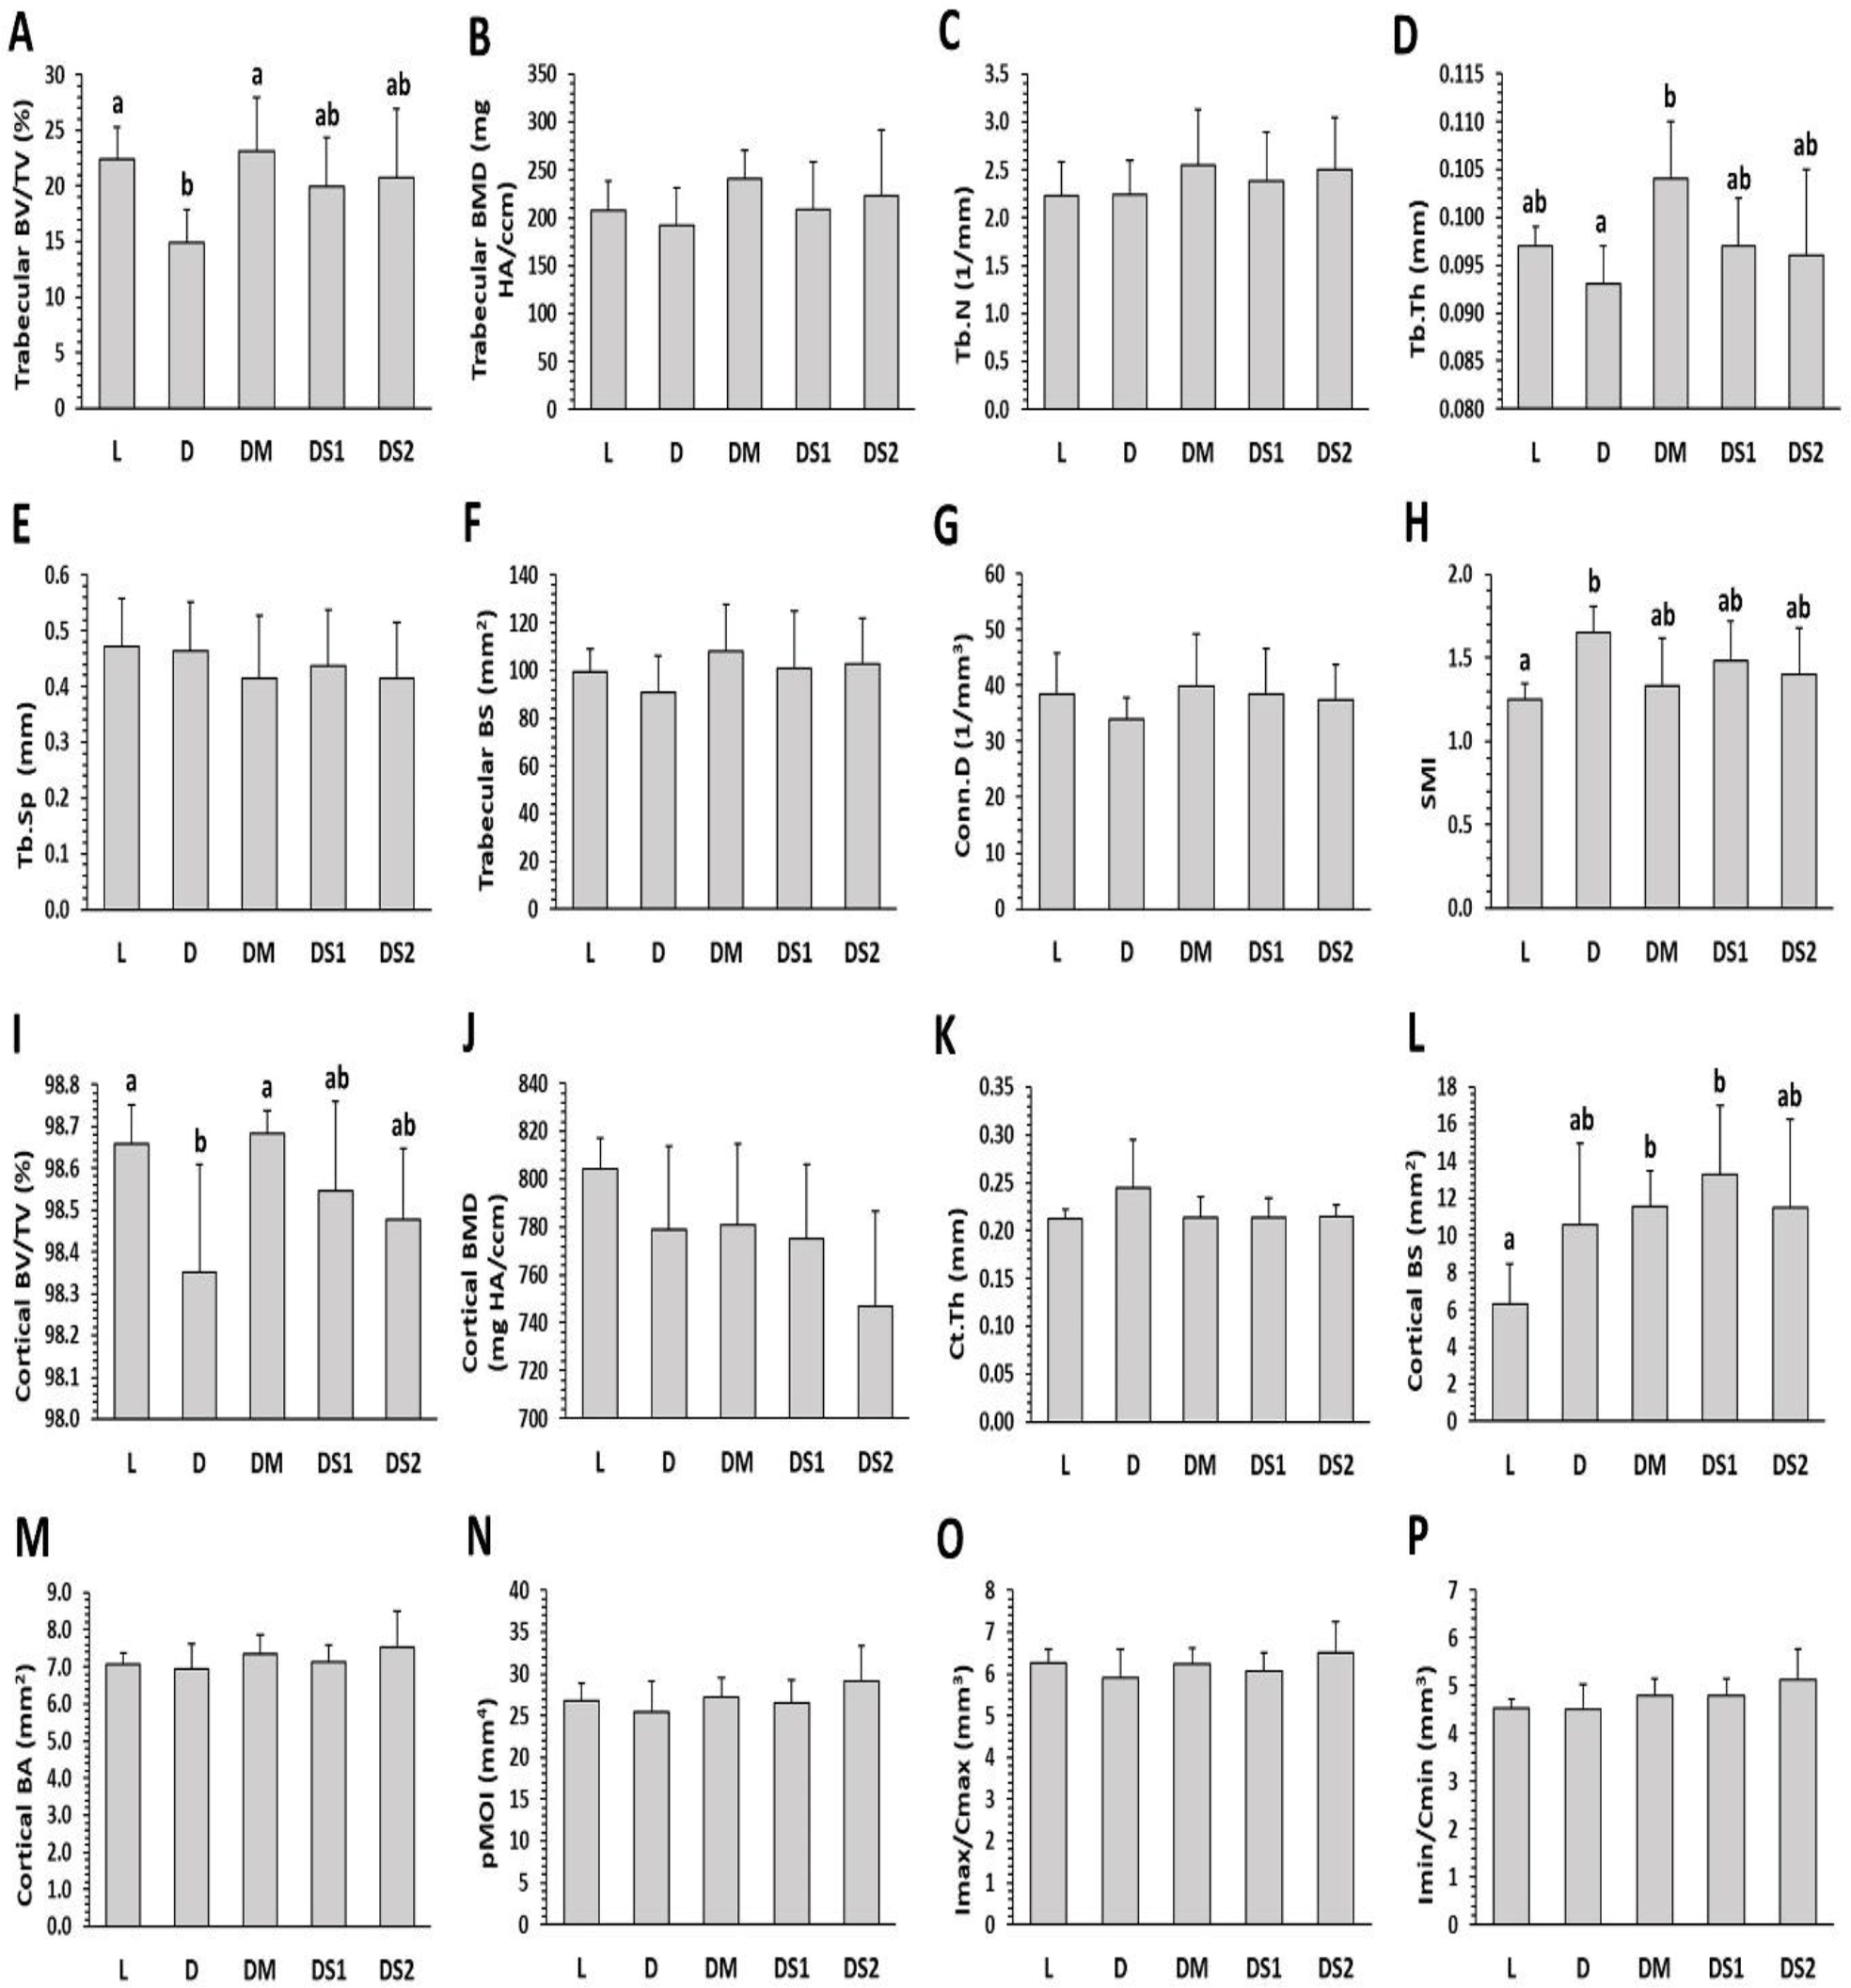
Fig. 3.
Micro-computed tomography trabecular and cortical bone metrics of the femoral bone in lean untreated (group L), obese untreated (group D on 150 mg/kg b.w./day), obese metformin-treated (group DM), obese sea buckthorn–treated lower-dose (group DS1 on 250 mg/kg b.w./day) and obese sea buckthorn–treated higher-dose (group DS2 on 500 mg/kg b.w./day) Zucker diabetic fatty rats. BV/TV – bone volume/total volume; BMD – bone mineral density; Tb.N – trabecular number; Tb.Th – trabecular thickness; Tb.Sp – trabecular separation; BS – bone surface; Conn.D – connectivity density; SMI – structure model index; Ct.Th – cortical thickness; BA – bone area; pMOI – polar moment of inertia; Imax/Cmax – maximum loading resistance; Imin/Cmin – minimum loading resistance. The data are presented as mean ±SD. a, b – different letters in the same chart indicate significant difference (P-value < 0.05)
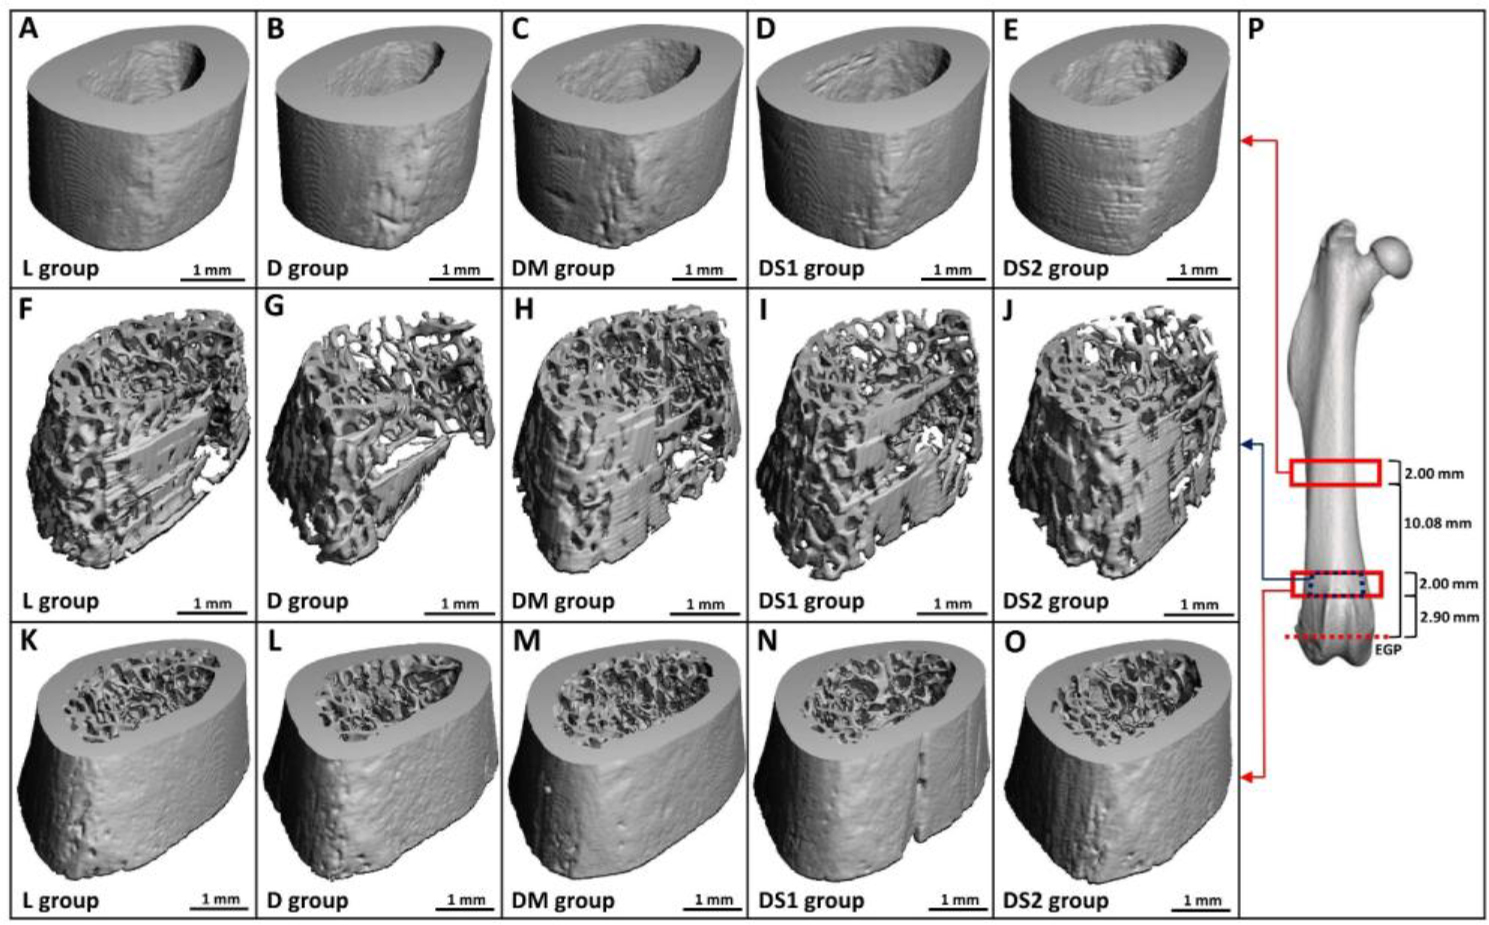
Fig. 4.
Representative osseous micro-computed tomography images from lean untreated (group L), obese untreated (group D), obese metformin-treated (group DM on 150 mg/kg b.w./day), obese sea buckthorn–treated lower-dose (group DS1 on 250 mg/kg b.w./day), and obese sea buckthorn– treated higher-dose (group DS2 on 500 mg/kg b.w./day) Zucker diabetic fatty rats. The panels show cortical bone in femoral diaphysis (A–E), trabecular bone in distal metaphysis (F–J), both bone compartments in distal metaphysis (K–O), and regions of interest in the diaphysis and distal metaphysis (P). EGP – end of the growth plate
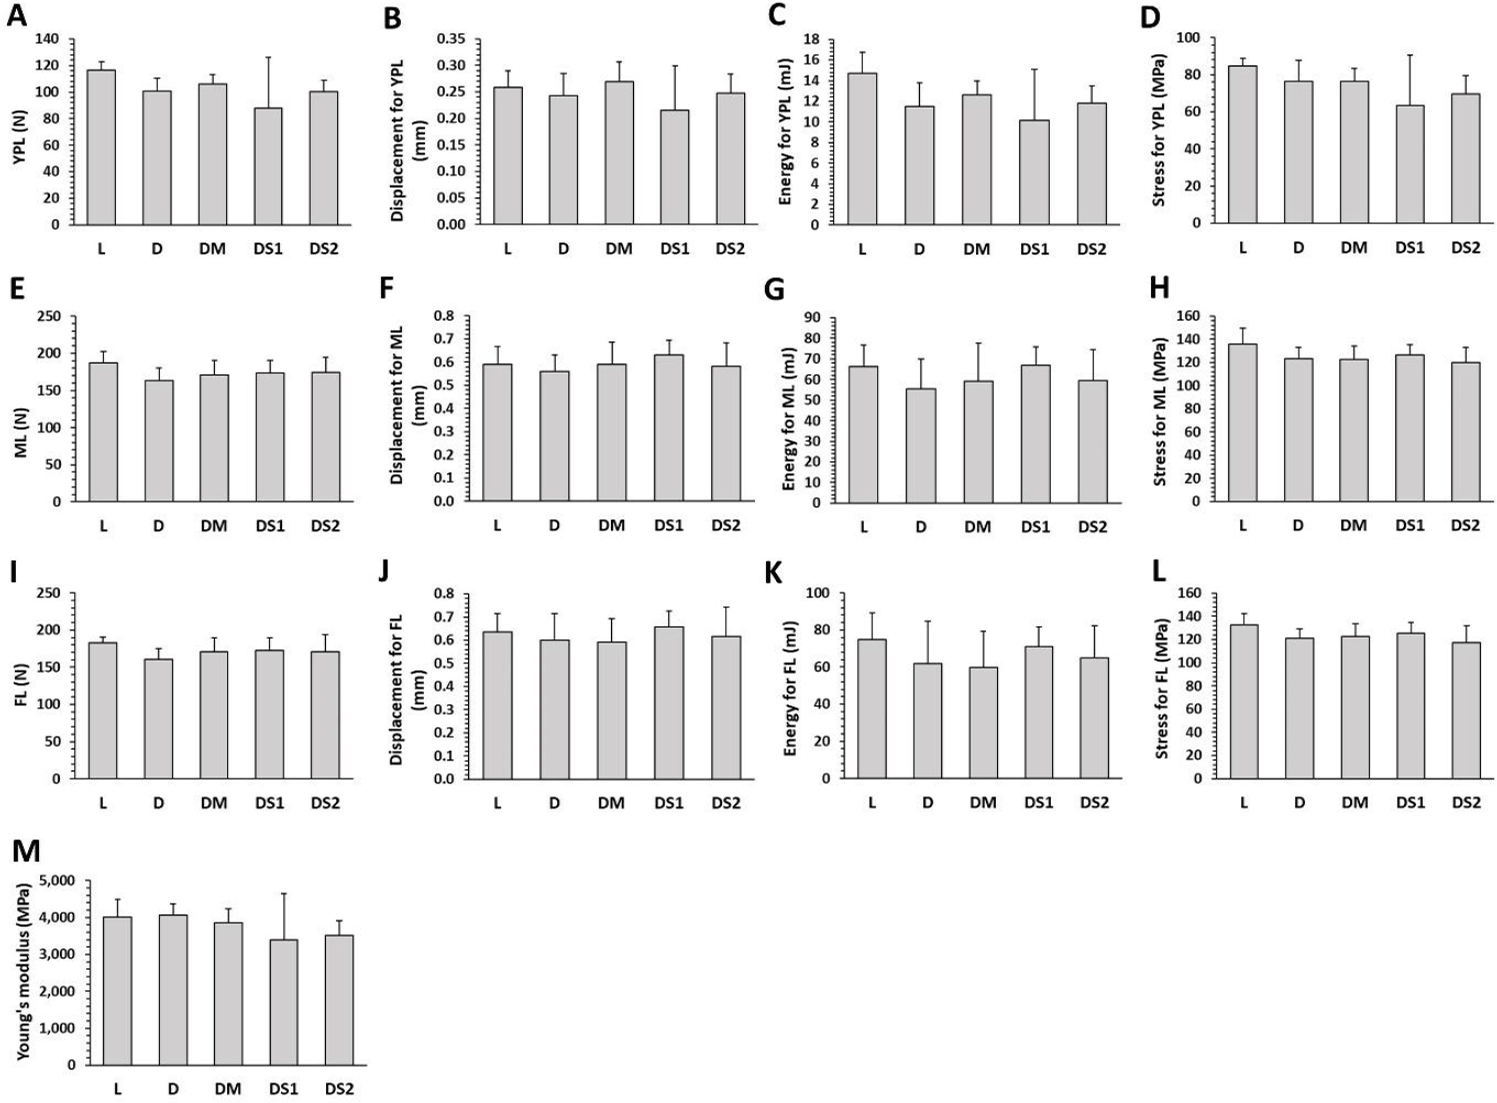
Fig. 5.
Mechanical properties of femoral bones in lean untreated (group L), obese untreated (group D), obese metformin-treated (group DM on 150 mg/kg b.w./day), obese sea buckthorn–treated lower-dose (group DS1 on 250 mg/kg b.w./day), and obese sea buckthorn–treated higher-dose (group DS2 on 500 mg/kg b.w./day) Zucker diabetic fatty rats. YPL – yield-point load; ML – maximum load; FL – fracture load. The data are presented as mean ±SD