
Introduction
Type 2 diabetes mellitus (T2DM) is a metabolic disorder prevalent worldwide which is defined by chronic hyperglycaemia and systemic insulin resistance. These disturbances trigger a cascade of oxidative stress and low-grade inflammation, ultimately leading to multisystem complications (36). In addition to having well-known negative effects on the nervous, renal, and cardiovascular systems, T2DM also adversely influences the skeletal system, leading to secondary osteoporosis, also referred to as diabetic bone disease. Despite preserved or elevated bone mineral density (BMD), individuals with T2DM are more susceptible to fragility fractures (24, 31, 32).
Management of T2DM typically involves a multimodal approach combining pharmacological treatment with lifestyle modifications. Owing to its efficacy, adaptability in combination therapy and affordability, metformin (MET, 1,1-dimethylbiguanide) remains the first-line oral antidiabetic drug. Stimulation of adenosine monophosphate–activated protein kinase is the best-known mechanism by which metformin achieves most of its beneficial effects, including osteogenesis (18). Regarding its effect on the skeletal system, metformin had a dose-dependent impact on several osteoblast-specific functional biomarkers in vitro (23). In vivo, metformin improved BMD in various animal models of T2DM (19). However, if this translates into a reduction of fracture risk remains to be established.
The use of natural glucose-lowering compounds of plant origin as supportive therapy for T2DM is currently being investigated. Sea buckthorn (SB, Elaeagnus rhamnoides (L.) A. Nelson), a flowering shrub native to Europe and Asia, has attracted research interest because of the unique composition of its bioactive metabolites, including phenolic metabolites (particularly flavonoids and phenolic acids), carotenoids, and vitamins (mainly C, E, and K), which point to its great therapeutic potential (22). Sea buckthorn berry extract has been demonstrated to promote bone metabolism-related biomarkers and collagen deposition in cultured osteoblasts (21). In animal models of osteoporosis and rheumatoid arthritis, SB has shown osteoprotective potential, as reflected by increased BMD and reduced bone erosion (15, 37). The medicinal plant’s most important bioactive metabolites that are believed to support bone health, include isorhamnetin, quercetin, kaempferol, vitamin C, and vitamin E (22). However, the impact of SB on the skeletal system in T2DM has not been evaluated yet.
The aim of this study was to investigate the effects of dried berries of Elaeagnus rhamnoides (L.) A. Nelson in comparison with MET administration on the skeletal system in male Zucker diabetic fatty (ZDF) rats, a translational model that spontaneously develops characteristic symptoms of T2DM. The research sought to determine whether administering SB would have a similar impact to administering MET on diabetic bone disease. This study is the first to evaluate the effects of dried SB berries on the skeletal system in ZDF rats in direct comparison with MET.
Material and Methods
Animals and experimental design. A total of 30 male ZDF rats (obese diabetic animals homozygous for the fatty allele of the leptin receptor gene (fa/fa)) and their lean littermate controls (fa/+) were obtained from the Centre of Experimental Medicine, Slovak Academy of Sciences (Dobra Voda, Slovakia) and housed at the Slovak University of Agriculture in Nitra (Slovakia). All animals were kept under standardised conditions with a 12:12 h light–dark cycle and a temperature of 22 ±2°C. The rats had unrestricted access to tap water and recommended rodent chow throughout the experiment. At the end of the third month, the rats were randomly divided into five groups of six animals each: L (untreated lean rats), D (untreated obese rats), DM (obese rats treated with MET at a dose of 150 mg/kg b.w./day), DS1 (obese rats treated with dried SB berries at a dose of 250 mg/kg b.w./day), and DS2 (obese rats treated with dried SB berries at a dose of 500 mg/kg b.w./day). Treatment lasted four months. The number of animals included was calculated using G*power software v. 3 (8) based on the effect sizes for biochemical, microstructural, and biomechanical parameters from our previous studies (20, 24) to achieve the required power of 0.8 (alpha = 0.05). The MET dose was based on standards for daily doses and was subsequently converted from the human dose of 1,500 mg to the equivalent dose for rats (1, 26). The doses of dried SB berries as well as the intervention period were selected based on previous efficacy studies in rats and humans, the human dose also being converted to an equivalent dose for rats (4, 6, 25). Metformin (Stadamet; STADA Arzneimittel, Bad Vilbel, Germany) was ground into a fine powder and suspended in distilled water. Sea buckthorn berries which had been dried at 60°C for 20 h were obtained from the Slovak University of Agriculture in Nitra (Slovakia) in sufficient quantity from one shrub for the entire duration of the experiment. Their chemical composition is listed in Table 1. Prior to administration, polyphenol levels were standardised. The day before application to the ZDF rats, aliquots were prepared in distilled water, homogenised and stored in a refrigerator. Preparations of MET and SB were administered to experimental animals via an oral gavage directly into the stomach. Untreated ZDF rats received only distilled water during the same period. The study was approved by the Ethical Committee of the NPPC-Research Institute for Animal Production Nitra and the State Veterinary and Food Administration of the Slovak Republic under No. 2674-3/2021–220.
Table 1.
Chemical composition of dried berries of Elaeagnus rhamnoides (L.) A. Nelson
| Parameter | Content | Parameter | Content | Parameter | Content |
|---|---|---|---|---|---|
| Proteins (%) | 17.3 | Fats (%) | 17.1 | Ca (mg/kg) | 857 |
| Alanine (g/kg) | 3.7 | Saturated fatty acids (g/100 g of fat) | 47.7 | P (mg/kg) | 2,383 |
| Arginine (g/kg) | 14.9 | Monounsaturated fatty acids (g/100 g of fat) | 24.9 | K (mg/kg) | 1,465 |
| Glycine (g/kg) | 6.3 | Polyunsaturated fatty acids (g/100 g of fat) | 37.5 | S (mg/kg) | 2,592 |
| Histidine (g/kg) | 4.4 | Palmitic acid (g/100 g of fat) | 43.5 | Mg (mg/kg) | 687 |
| Isoleucine (g/kg) | 5.5 | Palmitoleic acid (g/100 g of fat) | 12.5 | Mn (mg/kg) | 14.9 |
| Glutamic acid (g/kg) | 23.9 | Oleic acid (g/100 g of fat) | 12.1 | Zn (mg/kg) | 27 |
| Leucine (g/kg) | 9.2 | Linoleic acid (g/100 g of fat) | 27.8 | Na (mg/kg) | 88 |
| Lysine (g/kg) | 6.6 | Linolenic acid (g/100 g of fat) | 9.7 | Fe (mg/kg) | 37 |
| Phenylalanine (g/kg) | 7.7 | Myristic acid (g/100 g of fat) | 0.69 | Cu (mg/kg) | 10 |
| Proline (g/kg) | 6.1 | Heptadecanoic acid (g/100 g of fat) | 0.14 | Al (mg/kg) | 5.5 |
| Serine (g/kg) | 3.9 | Stearic acid (g/100 g of fat) | 2.6 | Se (mg/kg) | 0.48 |
| Threonine (g/kg) | 3.1 | Arachic acid (g/100 g of fat) | 0.55 | Cr (mg/kg) | <0.2 |
| Tyrosine (g/kg) | 3.5 | Eicosenoic acid (g/100 g of fat) | 0.19 | Vitamin C (mg/kg) | 1,959 |
| Valine (g/kg) | 7.1 | Docosadienoic acid (g/100 g of fat) | 0.52 | Vitamin E (mg/kg) | 124 |
| Aspartic acid (g/kg) | 17.2 | Behenic acid (g/100 g of fat) | 0.15 | Tartaric acid (g/kg) | 0.57 |
| Cystine (g/kg) | 3.2 | Total polyphenols (mg GAE/g) | 33.71 | Citric acid (g/kg) | <0.45 |
| Methionine (g/kg) | 0.8 | Total flavonoids (mg QE/g) | 36.05 | Malic acid (g/kg) | 31.3 |
| Tryptophan (g/kg) | 1.4 | Total phenolic acids (mg CAE/g) | 13.22 | β-carotene (mg/kg) | 63.1 |
| Fructose (g/kg) | 226.4 | Quercetin (mg/100 g) | 8.1 | ||
| Maltose (g/kg) | 1.2 | Isorhamnetin (mg/100 g) | 16.3 | ||
| Sucrose (g/kg) | 1.6 | Kaempferol (mg/100 g) | 2.3 |
Biochemical analysis. At the end of the experiment, intraperitoneal injection of xylazine (Xylazin; Ecuphar, Oostkamp, Belgium) in combination with tiletamine and zolazepam (Zoletil; Virbac, Carros, France) was used to anaesthetise the rats. Blood was collected by cardiac puncture into heparinised tubes, and plasma was frozen at −80°C. Blood glucose levels were measured using a Glucose Colorimetric Assay Kit (Elabscience, Houston, TX, USA). A Mercodia High Range Rat Insulin ELISA kit (Mercodia, Uppsala, Sweden) was used to determine insulin levels. The concentrations of total cholesterol and triglycerides and the activities of alkaline phosphatase (ALP), AST, and ALT were detected using commercially available kits (Randox Laboratories, Crumlin, UK and Mercodia) on a Biolis 24i Premium biochemical analyser (Tokyo Boeki MediSys, Tokyo, Japan). As bone turnover markers, procollagen type 1 N-propeptide (P1NP, a bone formation marker) and C-terminal telopeptide of type I collagen (CTx, a bone resorption marker) were measured using Rat PINP and Rat β-CTx ELISA kits (FineTest, Wuhan, China). The researchers performing the biochemical analyses were blinded to treatment groups.
Macroscopic analysis. The rats’ total body weights were measured after the end of the study. In addition, the weight and length of both femurs was measured and averaged for each individual.
Micro-computed tomography. Cortical and trabecular bone microstructure was evaluated using a μCT 50 system (Scanco Medical, Brüttisellen, Switzerland). Femoral bones were stored at −18°C wrapped in PBS-moistened gauze prior to analysis. High-resolution scans were performed with a voxel size of 14.8 μm. The region of interest for cortical bone analysis was identified to be 10.08 mm from the end of the growth plate (EGP). Trabecular bones were scanned at a distance of 2.90 mm from the EGP. Both scanned segments were 2 mm long. The scanning parameters were 70 kVp voltage, 200 mA current, 300 ms integration time, and 0.5 mm aluminium filter. Quantitative evaluation was performed using the Scanco microCT Evaluation Program v. 6.6. The cortical bone metrics included cortical bone volume fraction (bone volume/total volume (BV/TV)), volumetric cortical BMD, cortical bone thickness (Ct.Th), cortical bone surface (BS), cortical bone area (BA), polar moment of inertia (pMOI), maximum loading resistance (Imax/Cmax), and minimum loading resistance (Imin/Cmin). Trabecular bone measurements involved trabecular bone volume fraction (BV/TV), volumetric trabecular BMD, trabecular number (Tb.N), trabecular thickness (Tb.Th), trabecular separation (Tb.Sp), trabecular bone surface (BS), connectivity density (Conn.D), and structure model index (SMI). Investigators performing micro-computed tomography analysis were blinded to treatment groups.
Mechanical testing. Using a 3342 500 N single-column testing system (Instron, Norwood, MA, USA), the mechanical properties of the femoral diaphysis were determined in a three-point bending test. The data were analysed with Bluehill Universal v. 4.38 software (Instron). The left femur was placed on two supporting points spaced 16 mm apart. The load was applied perpendicularly to the boneߣs long axis, in the middle of the femoral length. After a preload of 1 N to ensure stable positioning, the test was started with a 100 Hz sampling rate and a 0.01 mm/s displacement rate. The following parameters were determined: Young’s modulus and the load, displacement, energy and stress for the yield point (0.05% offset), maximum load point and fracture point. The cross-sectional moment of inertia required to determine Young’s modulus and the stress values was estimated assuming that the femoral diaphysis was a circular beam; the mean diameter of the femur in the bone mid-length was measured with a caliper. Researchers performing mechanical testing were blinded to treatment groups.
Statistical analysis. Statistical evaluation was conducted using IBM SPSS Statistics 26.0 software (Armonk, NY, USA). The data were determined as mean ±SD. Normality tests and Levene’s test for equality of variance were employed for the data. The combination of ANOVA and Tukeyߣs post-hoc test was used to compare continuous variables between the groups. Welch’s ANOVA and the Games–Howell post-hoc test were applied if the assumption of homogeneity of variances was violated. A statistically significant P-value was defined as less than 0.05.
Results
Biochemical analysis. At the end of the experiment, higher concentrations of blood glucose (P-value < 0.001), triglycerides (P-value < 0.001), total cholesterol (P-value < 0.001), ALP (P-value < 0.001), AST (P-value = 0.040), and ALT (P-value = 0.041) were recorded in group D versus group L. On the other hand, group D had considerably reduced P1NP levels compared to group L (P-value < 0.001). Administration of MET resulted in significantly lower AST (P-value = 0.021) and CTx (P-value = 0.015) levels in comparison with group D, suggesting hepatoprotective and osteoprotective potential. Supplementation with SB (group DS1) only lowered AST (P-value = 0.015) and ALT levels (P-value = 0.017), while the other monitored parameters did not change (Fig. 1).
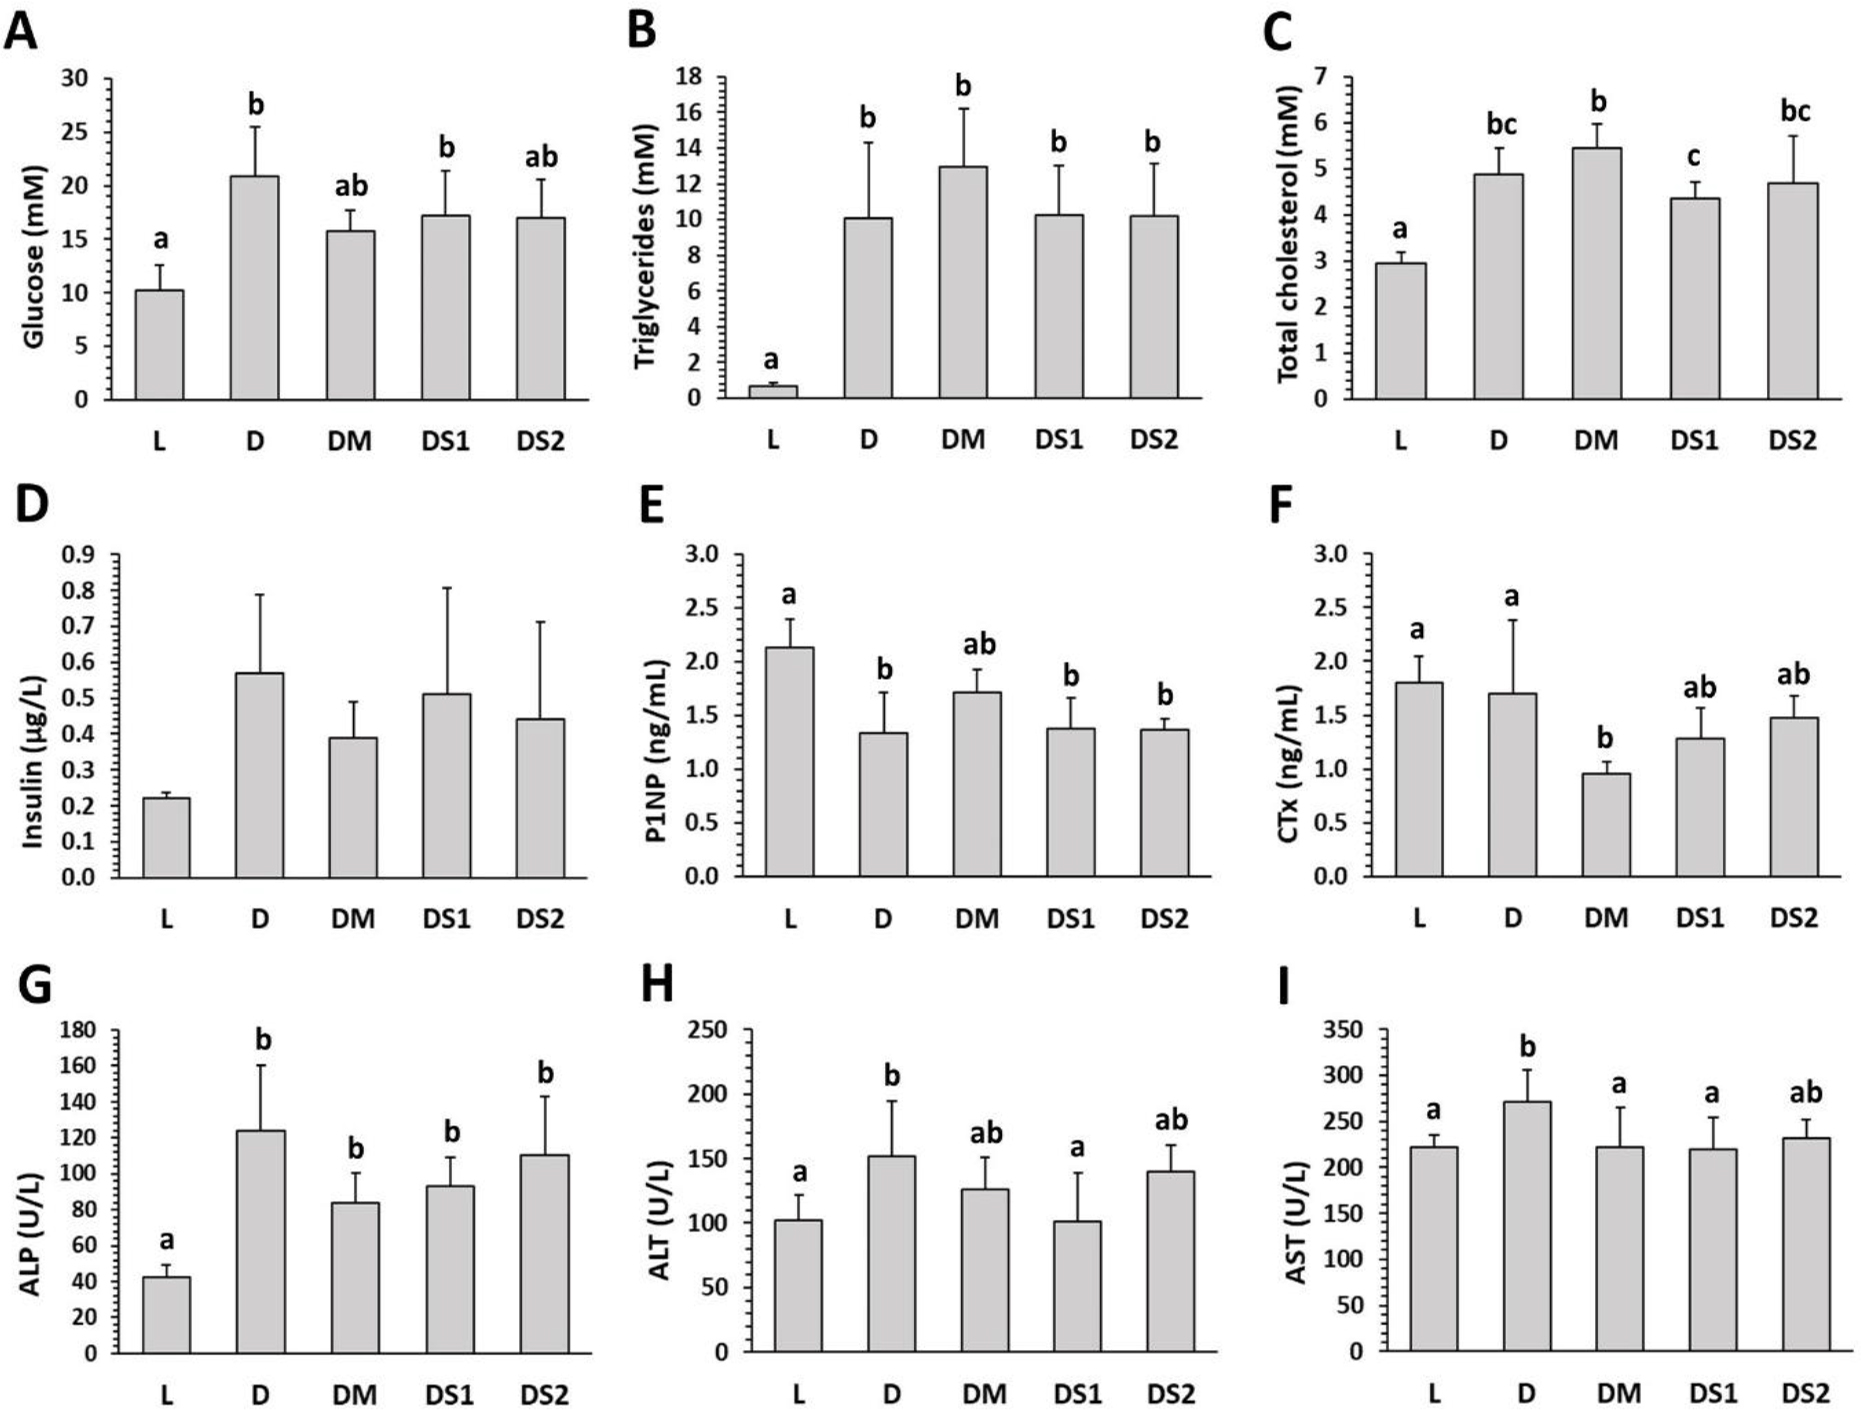
Fig. 1.
Biochemical markers investigated in lean untreated (group L), obese untreated (group D), obese metformin-treated (group DM on 150 mg/kg b.w./day), obese sea buckthorn–treated lower-dose (group DS1 on 250 mg/kg b.w./day), and obese sea buckthorn–treated higher-dose (group DS2 on 500 mg/kg b.w./day) Zucker diabetic fatty rats. P1NP – procollagen type I N-propeptide; CTx – C-terminal telopeptide of type 1 collagen; ALP – alkaline phosphatase. The data are presented as mean ±SD. a–c – different letters in the same chart indicate significant difference (P-value < 0.05)
Macroscopic analysis. Total body weight was significantly higher in group D (P-value < 0.001) than in group L. However, a greater mean femoral length was observed in group L than in group D (P-value < 0.001). After administration of MET or SB, no significant changes were found in the evaluated macroscopic parameters compared with group D. The findings are presented in Fig. 2.
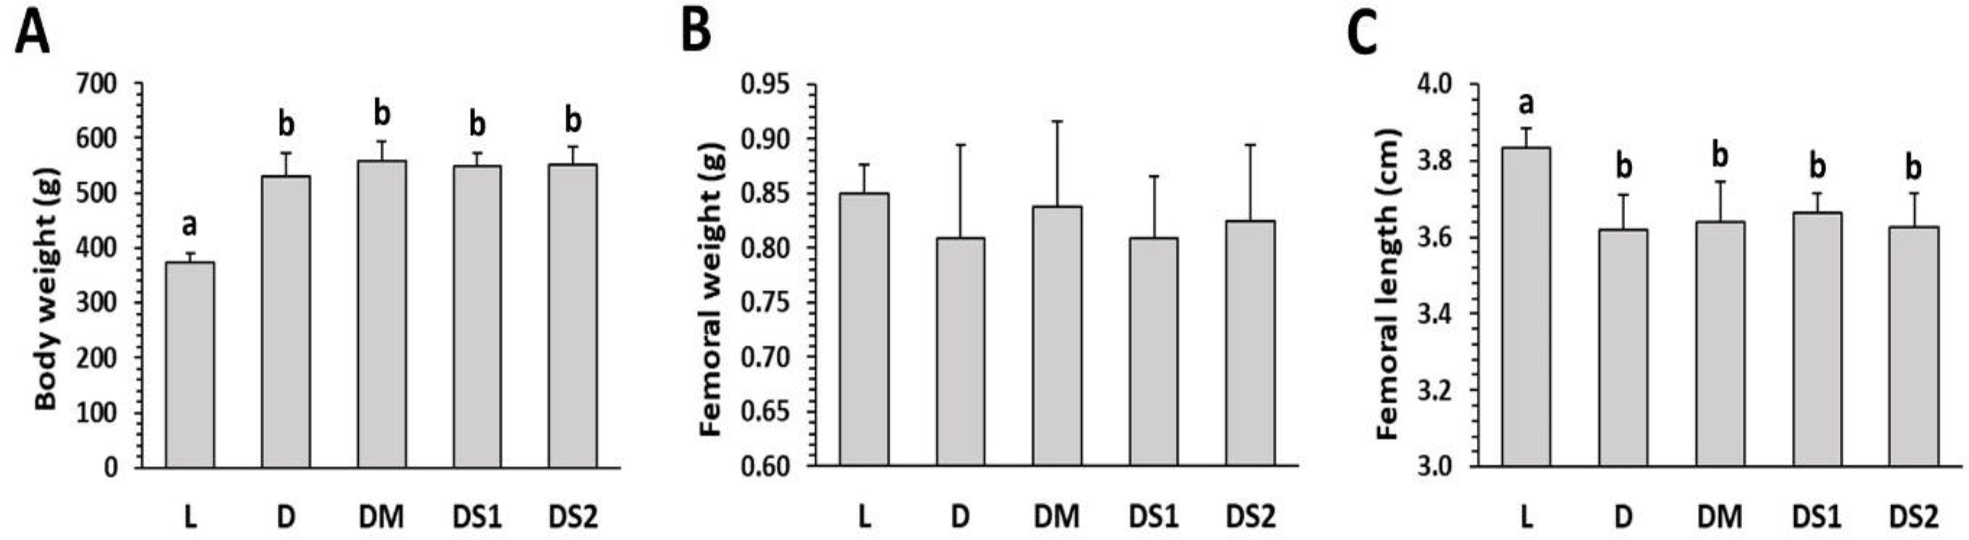
Fig. 2.
Macroscopic parameters investigated in lean untreated (group L), obese untreated (group D), obese metformin-treated (group DM on 150 mg/kg b.w./day), obese sea buckthorn–treated lower-dose (group DS1 on 250 mg/kg b.w,/day), and obese sea buckthorn–treated higher-dose (group DS2 on 500 mg/kg b.w./day) Zucker diabetic fatty rats. The data are presented as mean ±SD. a, b – different letters in the same chart indicate significant difference (P-value < 0.001)
Micro-computed tomography. In group D, significant decreases in trabecular BV/TV (P-value = 0.048) and cortical BV/TV (P-value = 0.049) were observed in comparison with group L. In contrast, SMI was considerably higher in group D versus group L (P-value = 0.034). Metformin administration resulted in higher trabecular BV/TV (P-value = 0.028), Tb.Th (P-value = 0.021), and cortical BV/TV (P-value = 0.028) compared with group D, reflecting increased bone formation. Sea buckthorn supplementation had no effect on any cortical or trabecular bone metrics (Fig. 3). Figure 4 shows representative micro-computed tomography images of cortical and trabecular bone in each group.
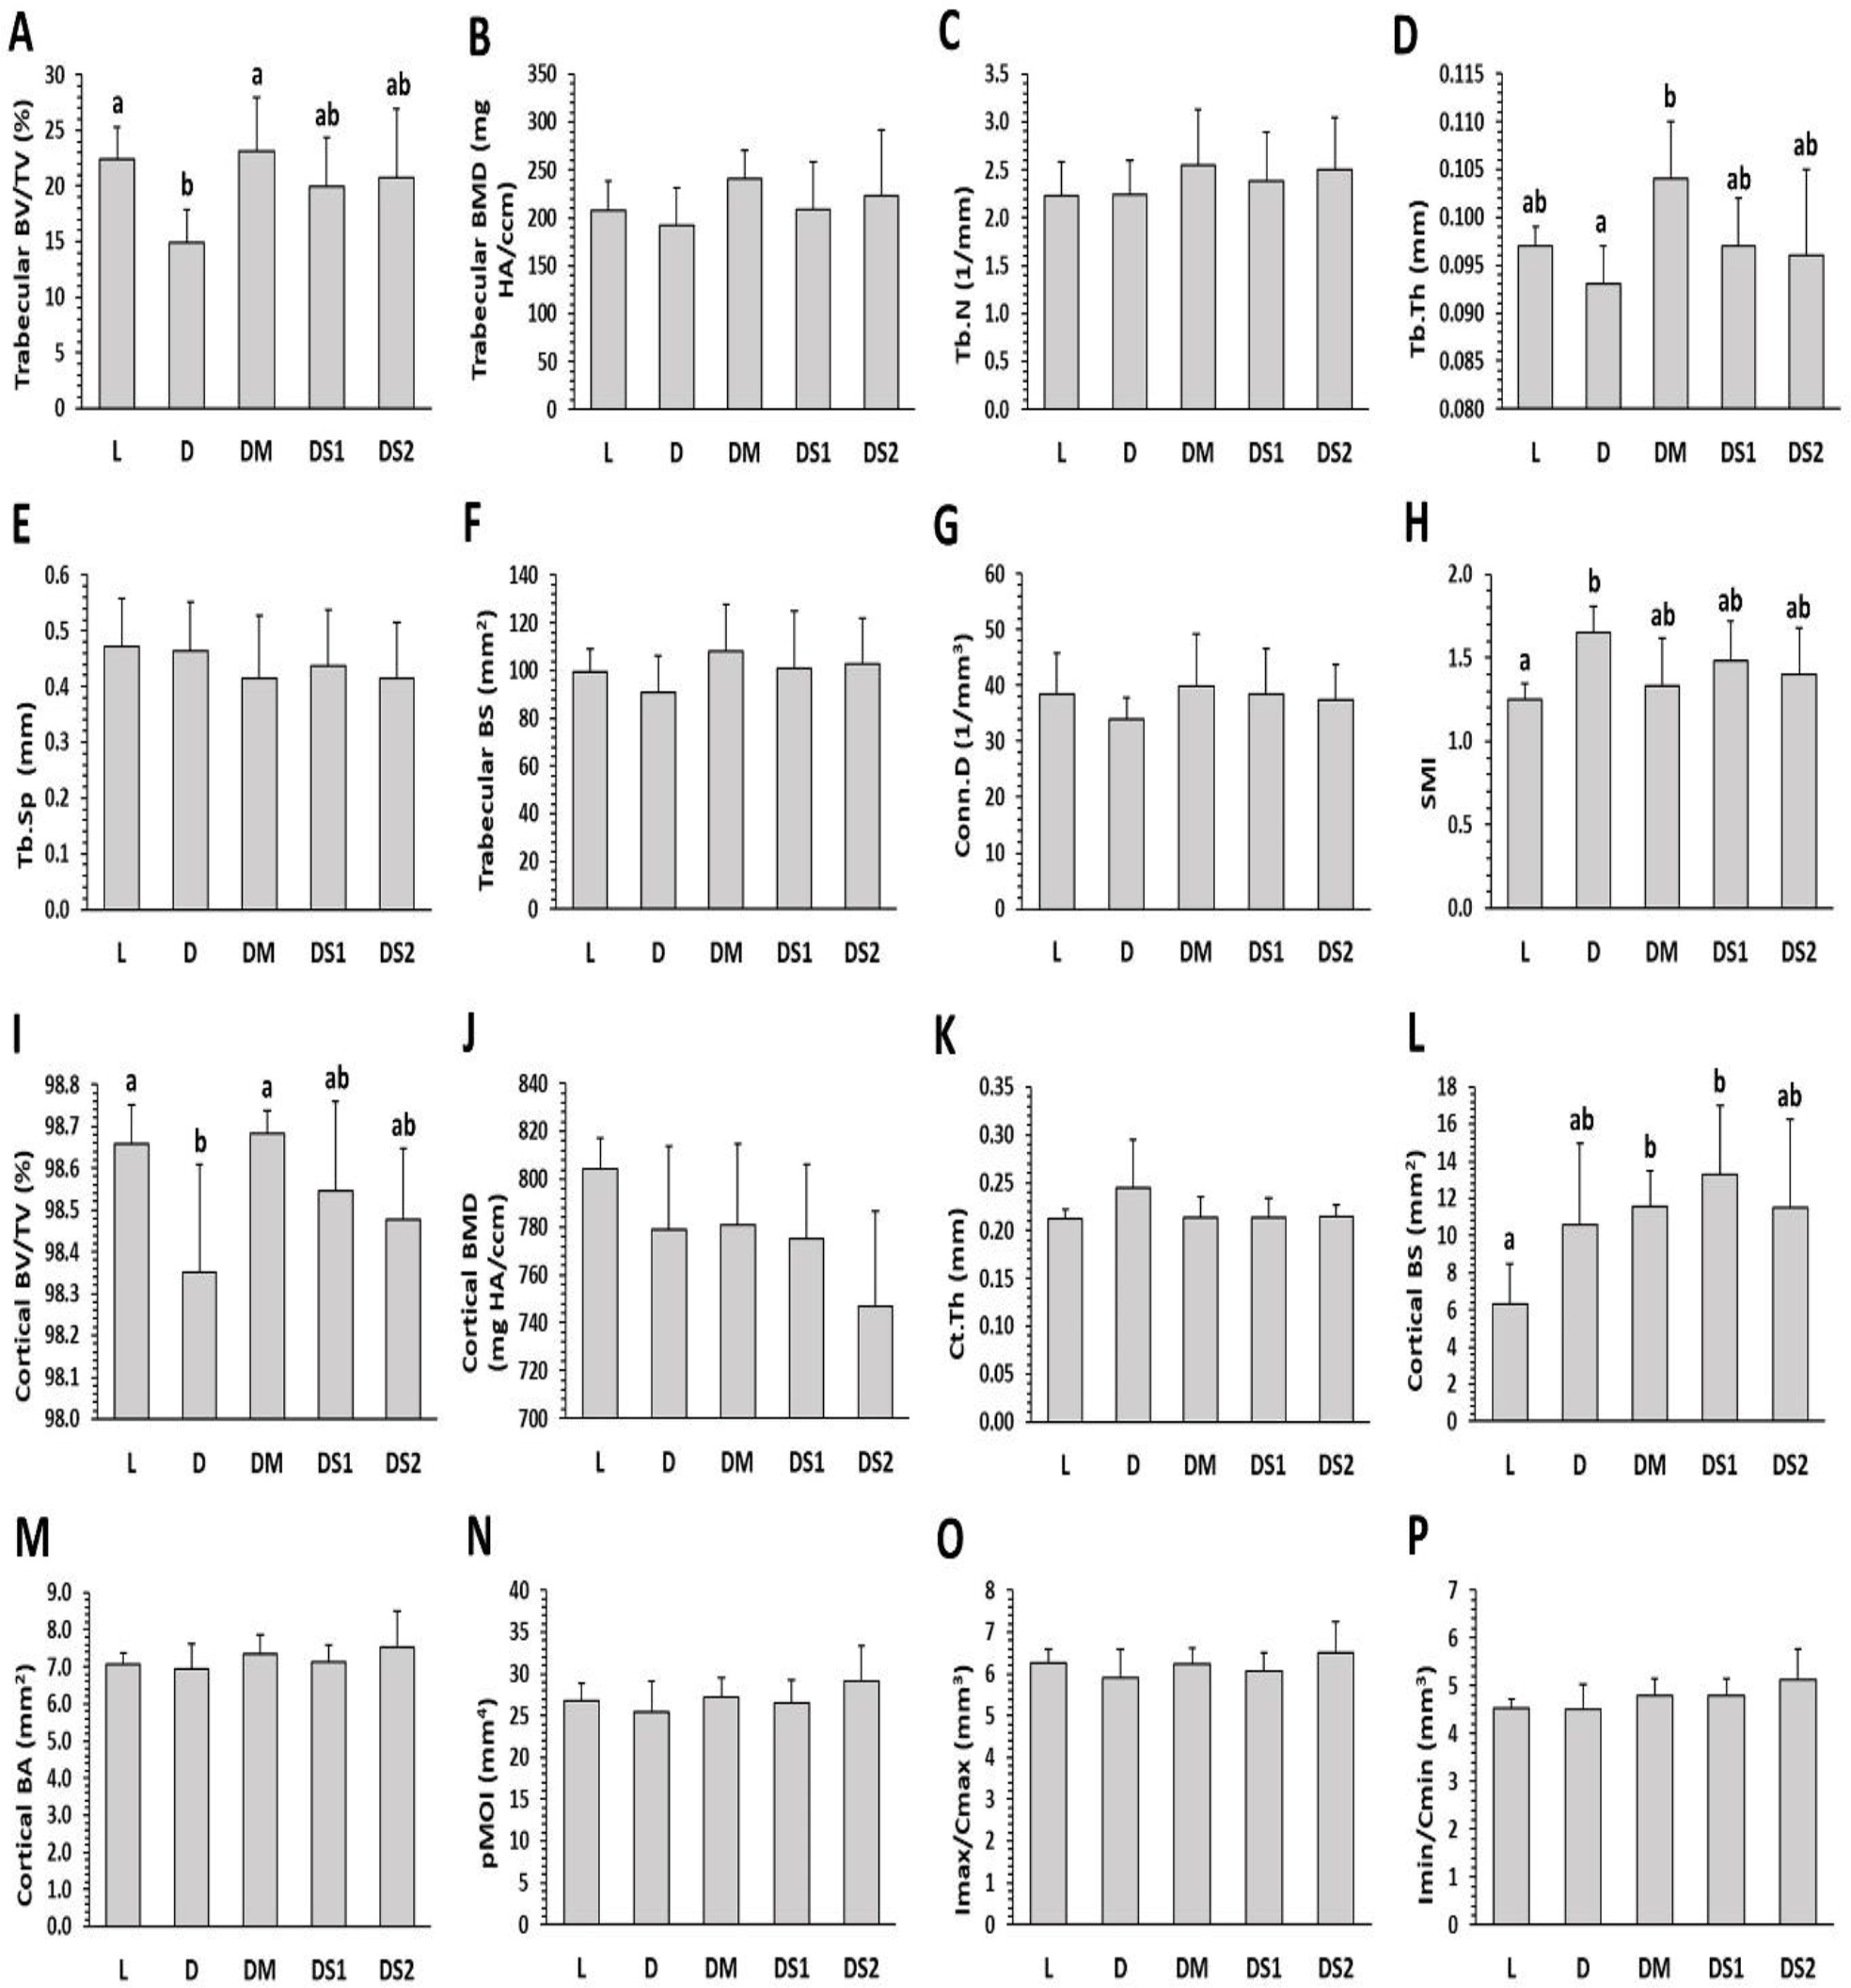
Fig. 3.
Micro-computed tomography trabecular and cortical bone metrics of the femoral bone in lean untreated (group L), obese untreated (group D on 150 mg/kg b.w./day), obese metformin-treated (group DM), obese sea buckthorn–treated lower-dose (group DS1 on 250 mg/kg b.w./day) and obese sea buckthorn–treated higher-dose (group DS2 on 500 mg/kg b.w./day) Zucker diabetic fatty rats. BV/TV – bone volume/total volume; BMD – bone mineral density; Tb.N – trabecular number; Tb.Th – trabecular thickness; Tb.Sp – trabecular separation; BS – bone surface; Conn.D – connectivity density; SMI – structure model index; Ct.Th – cortical thickness; BA – bone area; pMOI – polar moment of inertia; Imax/Cmax – maximum loading resistance; Imin/Cmin – minimum loading resistance. The data are presented as mean ±SD. a, b – different letters in the same chart indicate significant difference (P-value < 0.05)
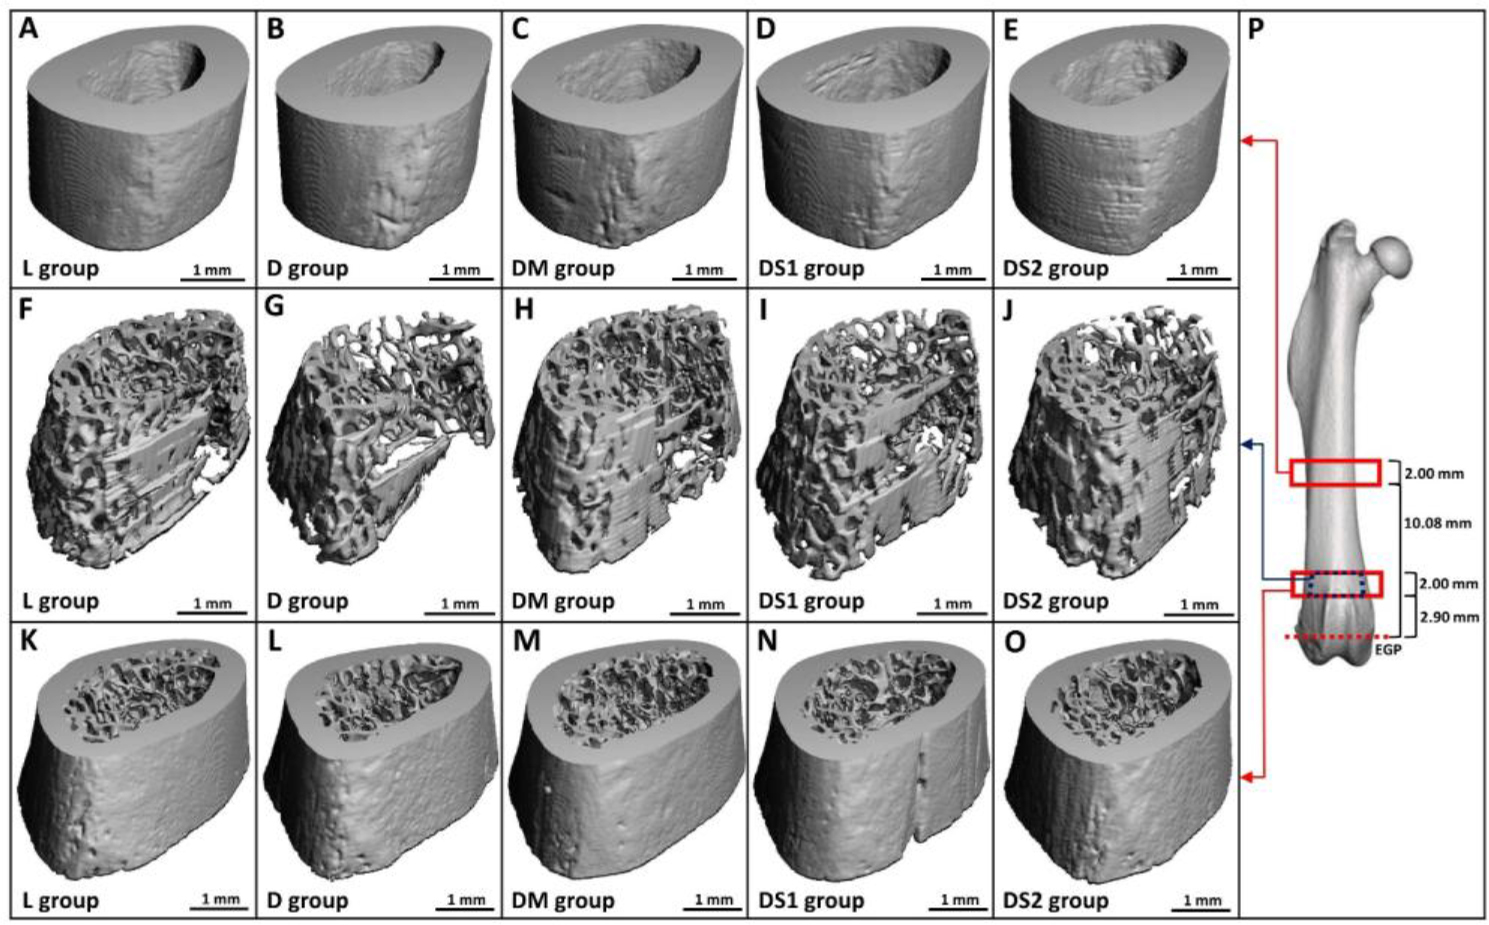
Fig. 4.
Representative osseous micro-computed tomography images from lean untreated (group L), obese untreated (group D), obese metformin-treated (group DM on 150 mg/kg b.w./day), obese sea buckthorn–treated lower-dose (group DS1 on 250 mg/kg b.w./day), and obese sea buckthorn– treated higher-dose (group DS2 on 500 mg/kg b.w./day) Zucker diabetic fatty rats. The panels show cortical bone in femoral diaphysis (A–E), trabecular bone in distal metaphysis (F–J), both bone compartments in distal metaphysis (K–O), and regions of interest in the diaphysis and distal metaphysis (P). EGP – end of the growth plate
Mechanical testing. No significant differences in the mechanical properties of the femoral diaphysis were recorded between groups D and L. Metformin and SB administration did not significantly influence any of the biomechanical parameters examined (Fig. 5).
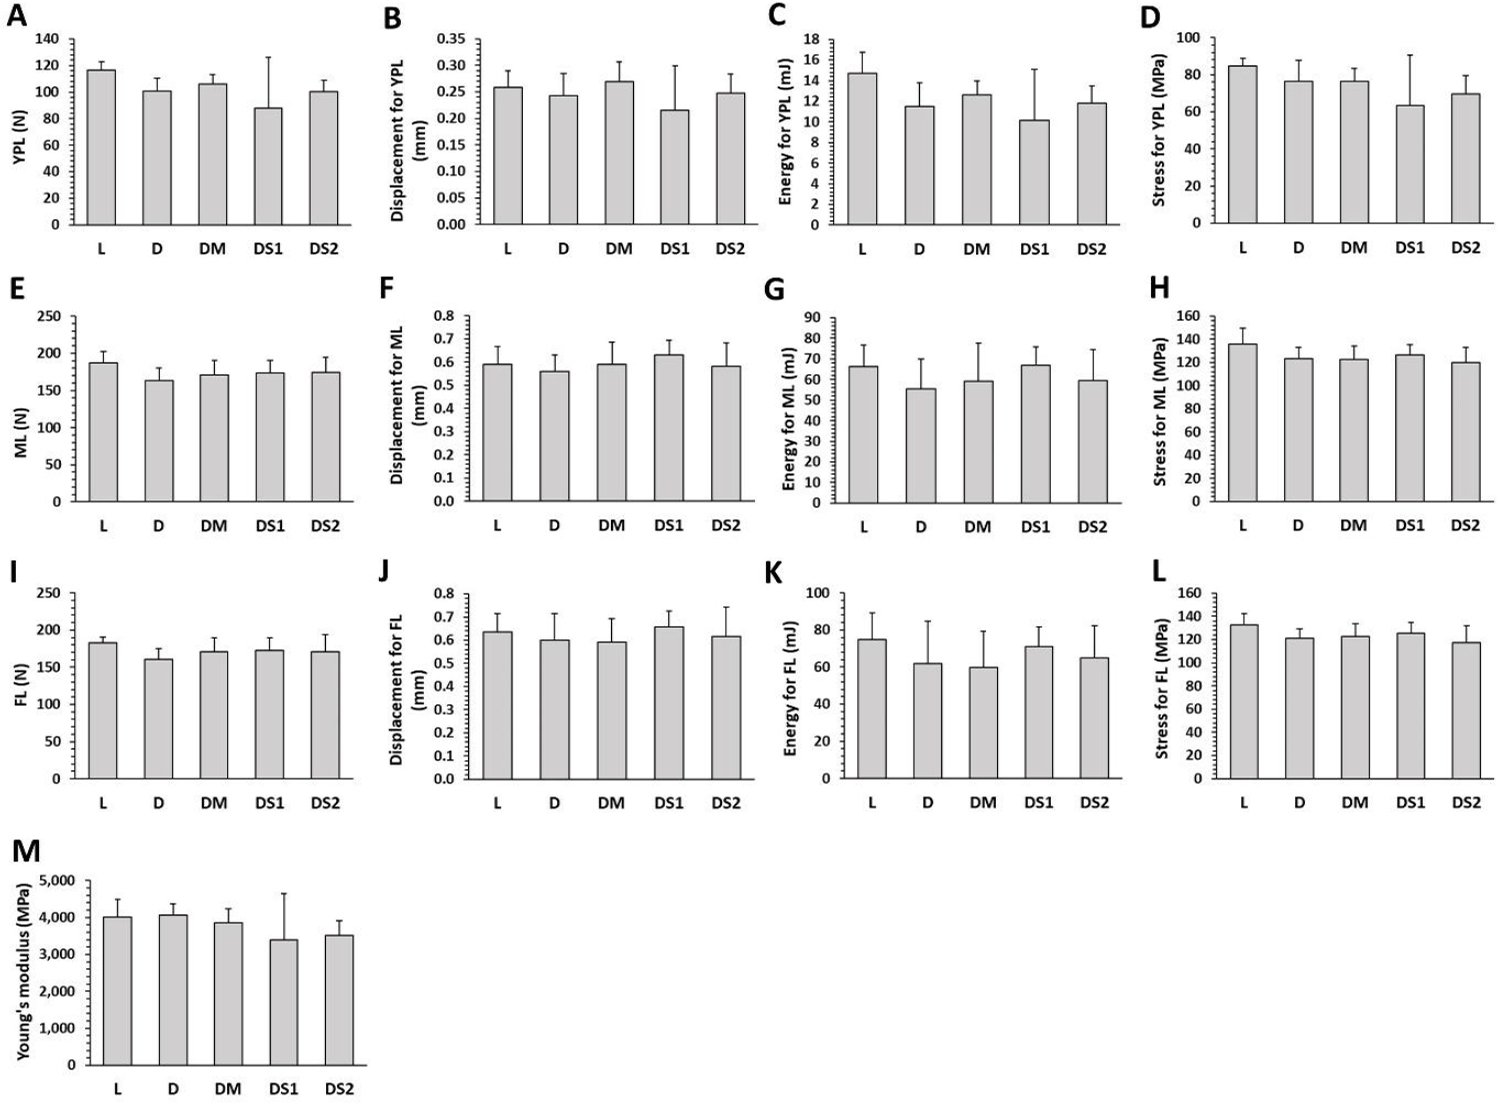
Fig. 5.
Mechanical properties of femoral bones in lean untreated (group L), obese untreated (group D), obese metformin-treated (group DM on 150 mg/kg b.w./day), obese sea buckthorn–treated lower-dose (group DS1 on 250 mg/kg b.w./day), and obese sea buckthorn–treated higher-dose (group DS2 on 500 mg/kg b.w./day) Zucker diabetic fatty rats. YPL – yield-point load; ML – maximum load; FL – fracture load. The data are presented as mean ±SD
Discussion
Male ZDF rats represent a well-established genetic model of T2DM. By 8 weeks of age, they develop hyperglycaemia and hyperlipidaemia, and by approximately 10 weeks of age, overt T2DM, replicating obesity-related insulin resistance and inflammation in humans (39). Abnormalities in bone microstructure and bone mechanical properties indicate poor bone quality in these rats. Consequently, the ZDF rat model is useful for investigating the skeletal system in T2DM (24).
The rats of group D showed higher concentrations of glucose, triglycerides, total cholesterol, ALP, AST, and ALT versus group L. Conversely, this group’s P1NP levels were lower, suggesting that this model is generally adequate. In other experiments, significantly impaired glucose, lipid, and liver profiles were also noted in obese ZDF rats compared to lean controls (24, 27). Regarding bone turnover markers, Picke et al. (29) found significantly reduced P1NP levels in ZDF rats, as were found in our study, but also increased CTx levels. However, Fajardo et al. (7) reported decreased levels of both P1NP and CTx in the ZDF rat model. We found that group DM had lower CTx and AST levels than group D, but other biochemical parameters did not change significantly. This suggests that the observed skeletal benefit of MET is predominantly anti-resorptive rather than anabolic in ZDF rats. Since T2DM is generally characterised by a low bone turnover state, this finding represents rather a modulation or normalisation of dysregulated bone remodelling. In contrast to our study, Lin et al. (17) did not report a decrease in CTx levels in Goto-Kakizaki spontaneous T2DM rats after MET treatment (200 mg/kg b.w. for 20 weeks), but did report significantly elevated osteocalcin (another marker of bone formation). However, in clinical studies, a concomitant decrease in both CTx and P1NP markers has been observed, demonstrating both anabolic and inhibitory effects of MET on these markers (12, 13, 34). This reflects its multiple, non-mutually exclusive mechanisms. In our study, MET significantly decreased AST levels in ZDF rats, indicating alleviated hepatocellular stress and improved liver metabolic function. García-Díez et al. (10) also revealed that MET treatment at a higher dose but for a shorter period (300 mg/kg b.w. for 12 weeks) reduced AST levels in ZDF rats. Similarly to our findings, Li et al. (16) revealed that MET administration (300 mg/kg b.w. for eight weeks) did not reduce glucose, triglyceride or total cholesterol levels in ZDF rats. Nistala et al. (28) reported that MET (300 mg/kg b.w. for 11 weeks) was able to suppress fasting blood glucose levels in the initial stage of disease but did not affect them at the end of treatment. Furthermore, MET administration significantly worsened the lipid profile, suggesting that its use in advanced stages of T2DM may be limited by adverse effects on metabolic profile. We identified a higher level of total cholesterol in group DM than in group DS1, suggesting differing effects of MET and SB on this parameter in ZDF rats. In contrast, Gosslau et al. (11) found no demonstrable changes in lipid profile in ZDF rats after MET administration (250 mg/kg b.w. for four weeks), but noted a decrease in fasting blood glucose levels.
The first evidence directly comparing the effects of dried SB berries with MET on the skeletal system in ZDF rats is provided in our study. Supplementation with SB only reduced AST and ALT levels, indicating hepatoprotective potential but not osteoprotective properties. In this context, Chen et al. (3) discovered that SB leaf tea improved liver function in hyperlipidaemic rats (a foundational model for studying T2DM because they replicate the metabolic syndrome), as reflected by lower AST and ALT levels. In contrast to our study, Dupak et al. (6) reported a significantly lower blood glucose level in ZDF rats given fresh berries of Elaeagnus rhamnoides (L.) A. Nelson for a shorter period of time (500 mg/kg b.w. for three months). These findings suggest that the duration of treatment and the dose of both administered agents (MET and SB) have pronounced effects on biochemical parameters in ZDF rats.
Significantly higher body weight but shorter femoral length was recorded in group D versus group L. Other studies have also documented increased body weight in obese Zucker rats compared to lean controls (24, 33). In general, bone size is known to be negatively impacted by T2DM. Shorter femoral length has also been found in ZDF rats in several other studies (24, 27, 30). Supplementation with MET or SB was unable to improve this bone abnormality in ZDF rats. Gosslau et al. (11) and Li et al. (16) similarly reported no change in total body weight of ZDF rats after MET administration at 250 mg/kg b.w. for four weeks and 300 mg/kg b.w. for eight weeks, respectively.
Disturbed skeletal microarchitecture, as evidenced by significantly reduced trabecular BV/TV and cortical BV/TV and increased SMI in group D versus group L, points to microstructural abnormalities associated with T2DM. This fact has also been demonstrated by previous research (5, 14, 27, 29, 30, 38). In our study, T2DM did not affect certain microstructural parameters of the femoral bone. Similarly, Cheng et al. (5) and Reinwald et al. (30) found no apparent changes in Tb.N in ZDF rats. According to Zeitoun et al. (38), obese ZDF rats had non-significantly lower volumetric cortical BMD and Conn.D compared to lean controls. Volumetric cortical BMD was also not affected by T2DM in the study by Kubota et al. (14). Our results subsequently showed that MET treatment raised trabecular BV/TV, Tb.Th, and cortical BV/TV in ZDF rats. Similarly, increased trabecular BV/TV but also volumetric BMD and Conn.D have been reported in Goto-Kakizaki spontaneous T2DM rats following MET treatment (200 mg/kg b.w./day for 20 weeks) (17). In a study by Zhu et al. (40), trabecular BV/TV, volumetric BMD, and trabecular BS were significantly higher in streptozotocin-induced diabetic rats receiving daily transabdominal MET (150 mg/kg b.w. for one week). However, Felice et al. (9) found no significant differences in cortical or trabecular compartments of the femoral bone in MET-treated rats (100 mg/kg b.w. for three weeks) with fructose-induced metabolic syndrome, a syndrome which demonstrably increases the risk of developing T2DM.
It has been demonstrated that the elevated fracture risk in T2DM may be exacerbated not only by significant microarchitectural abnormalities of trabecular bone but also by the quality of cortical bone. Based on current knowledge (2, 30, 38), cortical bone is essential for bone strength. The micro-computed tomography analysis parameters linked to torsional resistance and breaking strength (Imax/Cmax, Imin/Cmin and pMOI) indicate that we did not detect significant differences between groups D and L even using mechanical testing. For most parameters, these results correspond to previous findings in ZDF rats (5, 30). In our study, administration of MET and SB had no significant effect on mechanical properties of the femoral diaphysis. The constancy of the biomechanical parameters, despite improvements in bone microstructure, suggests that structural alterations may not have been sufficient to affect functional bone strength. In this context, mechanical testing of trabecular bone would be desirable. Contrary to our findings, Lin et al. (17) found increased maximum load, fracture load and femoral stiffness in Goto-Kakizaki rats with spontaneous T2DM treated with a higher dose of MET (200 mg/kg b.w./day for 20 weeks). However, a recent meta-analysis by Wang et al. (35) did not report any significant correlation between MET treatment and lower fracture risk in human patients with T2DM.
From the information mentioned above, it is clear that MET treatment demonstrated both hepatoprotective and osteoprotective potential in our study. However, supplementation with dried SB berries did not show osteoprotective effects, although hepatoprotective potential was noted. Therefore, such supplementation does not achieve METߣs therapeutic effects in relation to diabetic bone disease. The ineffectiveness of SB as an osteoprotective agent may be related to the limited bioavailability of its bioactive compounds, as well as to the use of hot-air-dried berries rather than extracts or fresh fruit, which may have superior biological activity. During the hot-air drying process, some thermolabile bioactive metabolites in SB can be partially lost and/or degraded (especially vitamin C and flavonoid glycosides), which may lead to reduced antioxidant and bioactive efficacy of the berries. The utility of dried SB berries as a supportive therapy for diabetic bone disease remains uncertain on the evidence of its administration in an animal model of T2DM; however, the results suggest that MET may exert beneficial effects on bone metabolism. These results cannot be generalised to all SB-derived products, as different preparations may exhibit distinct biological effects.
Our study has some limitations, including the relatively small sample size, the limited range of doses tested, the absence of mechanical testing of trabecular bone, and the lack of histological or molecular analyses, which may restrict mechanistic interpretation.
Conclusion
We found that MET treatment at a dose of 150 mg/kg/day for four months reduced the CTx level and improved the cortical and trabecular BV/TV and trabecular thickness, evidencing osteoprotective potential. In contrast, supplementation with dried berries of SB at doses of 250 and 500 mg/kg b.w./day for four months had no osteoprotective potential. Therefore, administration of dried SB berries was not as effective as MET in relation to diabetic bone disease. Low bioavailability and degradation of bioactive metabolites during the hot-air drying process and/or insufficient dosage of SB berries may explain the absence of an osteoprotective effect. However, treatment with SB at this dose demonstrated hepatoprotective effects by reducing ALT, also reducing AST (as MET did), and being associated with lower total cholesterol levels in ZDF rats compared with MET. Further studies are needed with different doses of both substances and using SB as leaves, seeds or whole fresh berries, to clearly evaluate the effect of these agents on the skeletal system in T2DM.
Notes
[2] Conflicts of interest Conflict of Interests Statement: The authors declare that there is no conflict of interests regarding the publication of this article.
[3] Financial Disclosure Statement: This work was supported by the Ministry of Education, Science, Research and Youth of the Slovak Republic, grant No. VEGA 1/0328/24.
[4] Animal Rights Statement: The study was approved by the Ethical Committee of the NPPC-Research Institute for Animal Production Nitra and the State Veterinary and Food Administration of the Slovak Republic under No. 2674-3/2021–220.
[5] CRediT Authorship Contribution Statement: Monika Martiniaková: research concept and design, data analysis and interpretation, writing the article, critical revision of the article, final approval of the article. Marcela Capcarová: research concept and design, collection and assembly of data. Anna Šarocká: data analysis and interpretation. Veronika Kováčová: data analysis and interpretation. Noémi Pénzes: data analysis and interpretation. Vladimira Mondočková: data analysis and interpretation. Piotr Londzin: data analysis and interpretation. Joanna Folwarczna: data analysis and interpretation, critical revision of the article. Radoslav Omelka: collection and assembly of data, writing the article, critical revision of the article, final approval of the article.