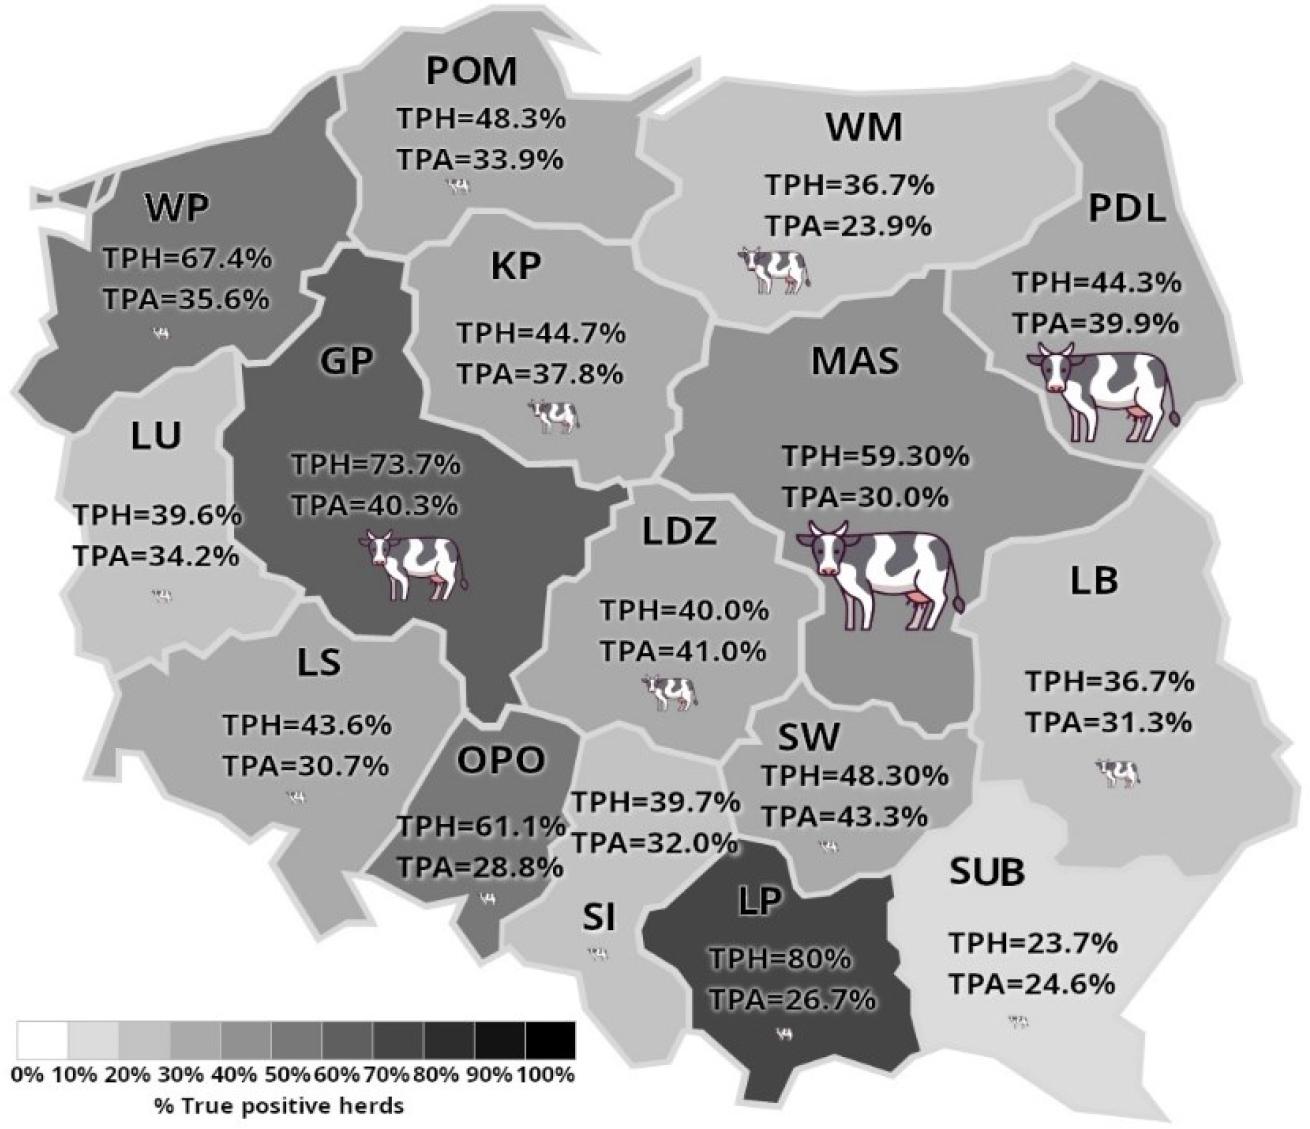
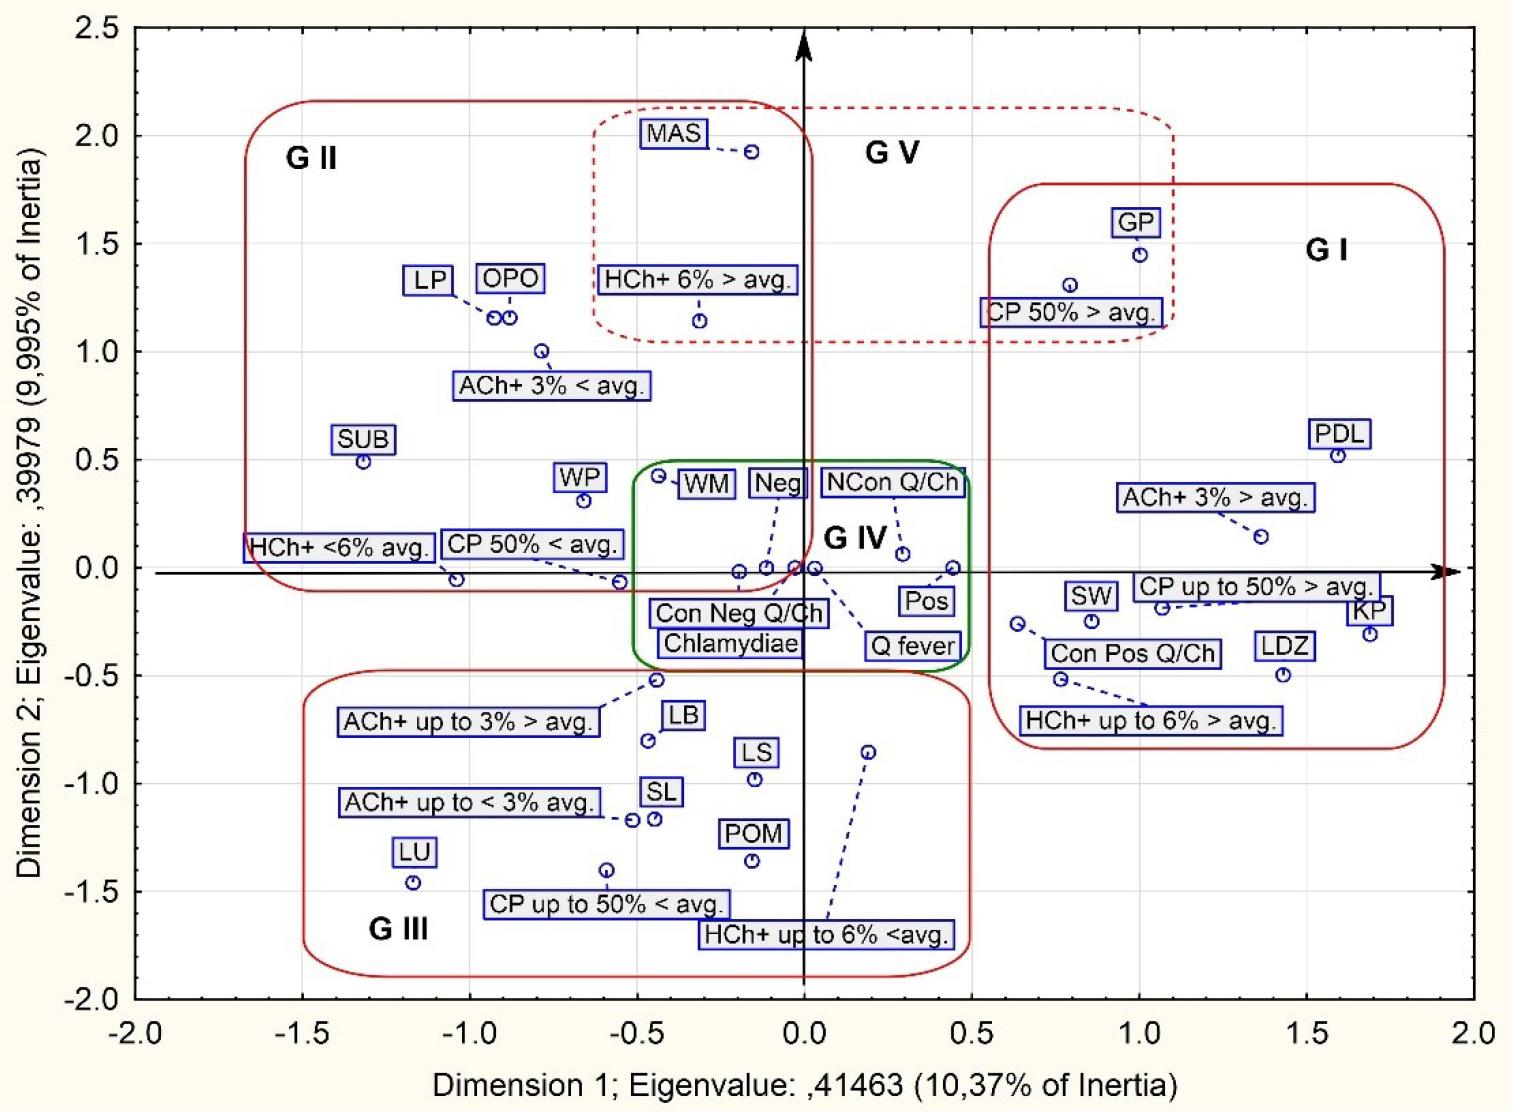
Have a personal or library account? Click to login
Prevalence of chlamydiae in dairy cattle herds and factors contributing to the spread of infections Cover

Prevalence of chlamydiae in dairy cattle herds and factors contributing to the spread of infections

Open Access
|Dec 2024

Figures & Tables

Fig 1.

True seroprevalence of chlamydiae at animal and herd level in cattle herds in the voivodeships of Poland based on serum analyses by complement fixation test. TPH – true-positive herds; TPA – true-positive animals; Voivodeships: GP – Greater Poland; PDL – Podlaskie; SW – Świętokrzyskie, LDZ – Łódź; KP – Kuyavia-Pomerania; MAS – Masovia; OPO – Opole; LP – Lesser Poland; SUB – Subcarpathia; WP – West Pomerania; LB – Lublin; SL – Silesia; POM – Pomerania; LS – Lower Silesia; LU – Lubusz; WM – Warmia-Masuria
 – the size of the symbol corresponds to the number of cows in the voivodeship
True seroprevalence of chlamydiae at animal and herd level in cattle herds in the voivodeships of Poland based on serum analyses by complement fixation test. TPH – true-positive herds; TPA – true-positive animals; Voivodeships: GP – Greater Poland; PDL – Podlaskie; SW – Świętokrzyskie, LDZ – Łódź; KP – Kuyavia-Pomerania; MAS – Masovia; OPO – Opole; LP – Lesser Poland; SUB – Subcarpathia; WP – West Pomerania; LB – Lublin; SL – Silesia; POM – Pomerania; LS – Lower Silesia; LU – Lubusz; WM – Warmia-Masuria – the size of the symbol corresponds to the number of cows in the voivodeship

Fig. 2.

Multivariate analysis of the presence of antibodies against chlamydiae in sera at herd and animal level, the geographical location of the farms and the dairy cow stock in the voivodeship and the positive and negative conformity rates between the results of serological screening for chlamydiae and Coxiella burnetii in the same sera samples. Blue points represent each category of analysed variables. Blue points with similar profiles (low value of distances indicating a strong association between variables) are marked by the red rectangles. Blue points located in the green rectangle in the graph’s centre show the points with similar profiles but representing eigenvalues indicating the lack of any association. Blue points located in the dashed rectangle shows the points with similar profiles but representing eigenvalues indicating the association with more than one groups
ACh+ – seroprevalence of chlamydiae at animal level; HCh+ – seroprevalence of chlamydiae at herd level; CP – dairy cattle population; Con Pos Q/Ch – conformity between positive results of presence of Chlamydia spp. and Coxiella burnetii antibodies in the same sera samples; Con Neg Q/Ch – conformity between negative results of presence of Chlamydia spp. and Coxiella burnetii antibodies in the same sera samples. Voivodeships: GP – Greater Poland; PDL – Podlaskie; SW – Świętokrzyskie, LDZ – Łódź; KP – Kuyavia-Pomerania; MAS – Masovia; OPO – Opole; LP – Lesser Poland; SUB – Subcarpathia; WP – West Pomerania; LB – Lublin; SL – Silesia; POM – Pomerania; LS – Lower Silesia; LU – Lubusz; WM – Warmia-Masuria
Multivariate analysis of the presence of antibodies against chlamydiae in sera at herd and animal level, the geographical location of the farms and the dairy cow stock in the voivodeship and the positive and negative conformity rates between the results of serological screening for chlamydiae and Coxiella burnetii in the same sera samples. Blue points represent each category of analysed variables. Blue points with similar profiles (low value of distances indicating a strong association between variables) are marked by the red rectangles. Blue points located in the green rectangle in the graph’s centre show the points with similar profiles but representing eigenvalues indicating the lack of any association. Blue points located in the dashed rectangle shows the points with similar profiles but representing eigenvalues indicating the association with more than one groups ACh+ – seroprevalence of chlamydiae at animal level; HCh+ – seroprevalence of chlamydiae at herd level; CP – dairy cattle population; Con Pos Q/Ch – conformity between positive results of presence of Chlamydia spp. and Coxiella burnetii antibodies in the same sera samples; Con Neg Q/Ch – conformity between negative results of presence of Chlamydia spp. and Coxiella burnetii antibodies in the same sera samples. Voivodeships: GP – Greater Poland; PDL – Podlaskie; SW – Świętokrzyskie, LDZ – Łódź; KP – Kuyavia-Pomerania; MAS – Masovia; OPO – Opole; LP – Lesser Poland; SUB – Subcarpathia; WP – West Pomerania; LB – Lublin; SL – Silesia; POM – Pomerania; LS – Lower Silesia; LU – Lubusz; WM – Warmia-Masuria

Results of complement fixation tests for chlamydiae on dairy cow serum samples at herd and animal level in each Polish voivodeship

GroupVoivodeshipAnimalsHerds
Number tested% positive% positive (Clopper– Pearson 95% CI)% true positive (95% CI)Number tested% positive% positive (Clopper– Pearson 95% CI)% true positive (95% CI)
G1, G5Greater Poland1465437.0 (29.2–45.4)40.3 (26.9–95.5)191473.7 (48.8–90.9)73.7 (51.6–89.2)c, d, l, o
G1Podlaskie1756436.6 (29.4–44.2)39.9 (26.8–94.5)974344.3 (34.2–54.8)44.3 (34.7–54.2)i
G1Świętokrzyskie1204638.3 (29.6–47.6)43.3 (28.3–95.9)602948.3 (35.2–61.6)48.3 (36.0–60.8)k
G1Łódź1967136.2 (29.5–43.4)41.0 (27.0–95.1)1606440 (32.3–48.0)40 (32.6–47.7)d, e
G1Kuyavia-Pomerania2509036.0 (30.0–42.3)37.8 (26.4–93.5)1526844.7 (36.7–53.0)44.7 (37.0–52.7)a, b
G2, G5Masovia1644628.0 (21.3–35.6)30.0 (15.3–76.8)271659.3 (38.8–77.6)59.3 (40.6–76.1)g
G2Opole2005427.0 (21.0–33.7)28.8 (14.4–71.9)543361.1 (46.9–74.1)61.1 (47.8–73.3)d, h
G2Lesser Poland902325.6 (16.9–35.8)26.7 (10.4–73.4)10880.0 (44.4–97.5)80 (49.7–95.6)c, d, f
G2Subcarpathia1784324.2 (18.1–31.1)24.6 (10.2–63.3)1734123.7 (17.6–30.7)23.7 (17.8–30.6)a, e, f, g, h, i, j, k, l, m
G2West Pomerania2458333.9 (23.8–37.2)35.6 (24.0–90.7)432967.4 (51.5–80.9)67.4 (52.7–80.0)b, c, d, m, n, p
G3Lublin1123228.3 (20.2–37.6)31.3 (15.4–78.8)602236.7 (24.6–50.1)36.7 (25.3–49.3)c
G3Silesia2206630.0 (24.0–36.5)32.0 (19.3–80.2)582339.7 (27.0–53.6)39.7 (27.8–52.5)h
G3Pomerania1925830.2 (23.8–37.2)33.9 (18.8–80.1)874248.3 (37.4–59.2)48.3 (38.0–58.7)j
G3Lower Silesia2507329.2 (23.6–35.3)30.7 (18.0–77.1)391743.6 (27.8–60.3)43.6 (28.9–59.1)
G3Lubusz912830.8 (21.5–41.3)34.2 (17.0–87.3)481939.6 (25.8–54.7)39.6 (26.7–53.7)
G4Warmia-Masuria1503523.3 (16.8–30.9)23.9 (8.5–63.0)662436.4 (24.9–49.1)36.4 (25.5–48.4)e, o, p
Total/mean2,78086631.2 (29.4–32.9)33.3 (21.2–76.8)1,15349242.7 (39.8–45.6)42.7 (39.8–45.5)
Language: English
Page range: 531 - 538
Submitted on: Sep 10, 2024
Accepted on: Dec 24, 2024
Published on: Dec 31, 2024
Published by: National Veterinary Research Institute in Pulawy
In partnership with: Paradigm Publishing Services
Publication frequency: 4 issues per year

© 2024 Mońika Szymańska-Czerwińska, Agnieszka Jodełko, Zbigniew Osiński, Kinga Zaręba-Marchewka, Krzysztof Niemczuk, published by National Veterinary Research Institute in Pulawy
This work is licensed under the Creative Commons Attribution-NonCommercial-NoDerivatives 3.0 License.