
Table 1
Group composition and blood sampling time
| Experiment | Study group | Haemolactia grade | Prepartum week | Postpartum week | ||||
|---|---|---|---|---|---|---|---|---|
| n | −4 | −2 | 0 | 2 | 4 | |||
| Haemolactic | Severe | 11 | - | - | 〇a) | - | - | |
| Exp. 1 | Non-haemolactic | - | 11 | - | - | 〇a) | - | - |
| Haemolactic | Moderate | 6 | 〇 | 〇 | 〇b) | 〇 | 〇 | |
| Exp. 2 | Non-haemolactic | - | 6 | 〇 | 〇 | 〇b) | 〇 | 〇 |
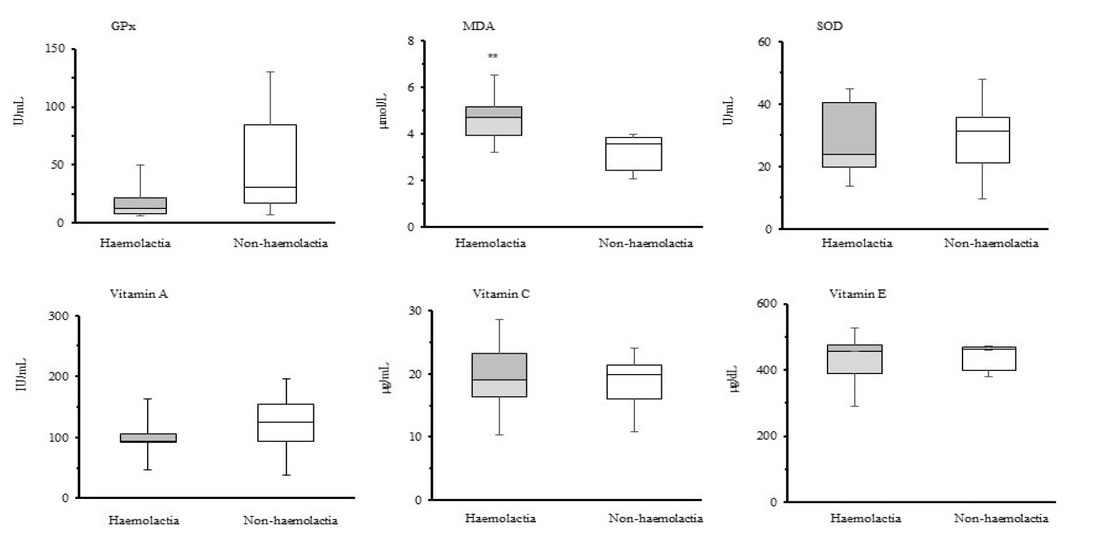
Fig. 1
Changes in plasma or serum indices of oxidative stress in dairy cows with haemolactia (solid grey column, n = 11) or without haemolactia (void column, n = 11) after calving
Upper bars – maxima; lower bars – minima; horizontal bars through boxes – medians; GPx – glutathione peroxidase; MDA – malondialdehyde; SOD – superoxide dismutase. ** – P < 0.01 vs. non-haemolactic group
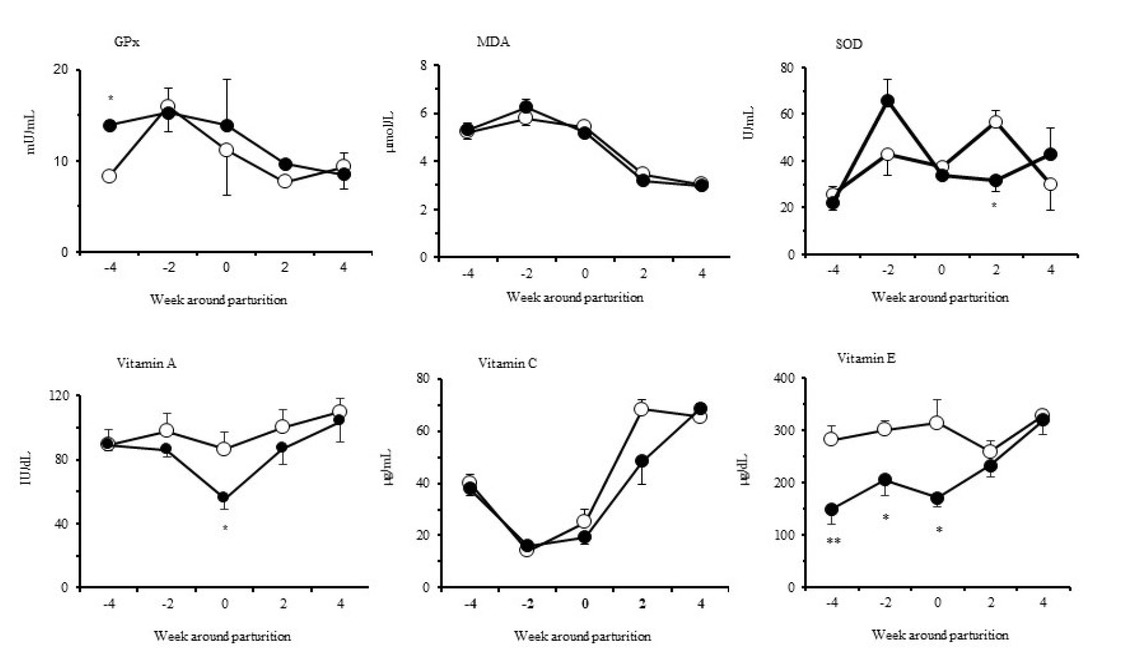
Fig. 2
Changes in plasma or serum indices of oxidative stress in dairy cows with haemolactia (solid circles, n = 6) or without haemolactia (void circles, n = 6) during the peripartum period. Values are expressed as the mean ± standard error of the mean. * – P < 0.05 and ** – P < 0.01 vs. non-haemolactic group; GPx – glutathione peroxidase; MDA – malondialdehyde; SOD – superoxide dismutase