
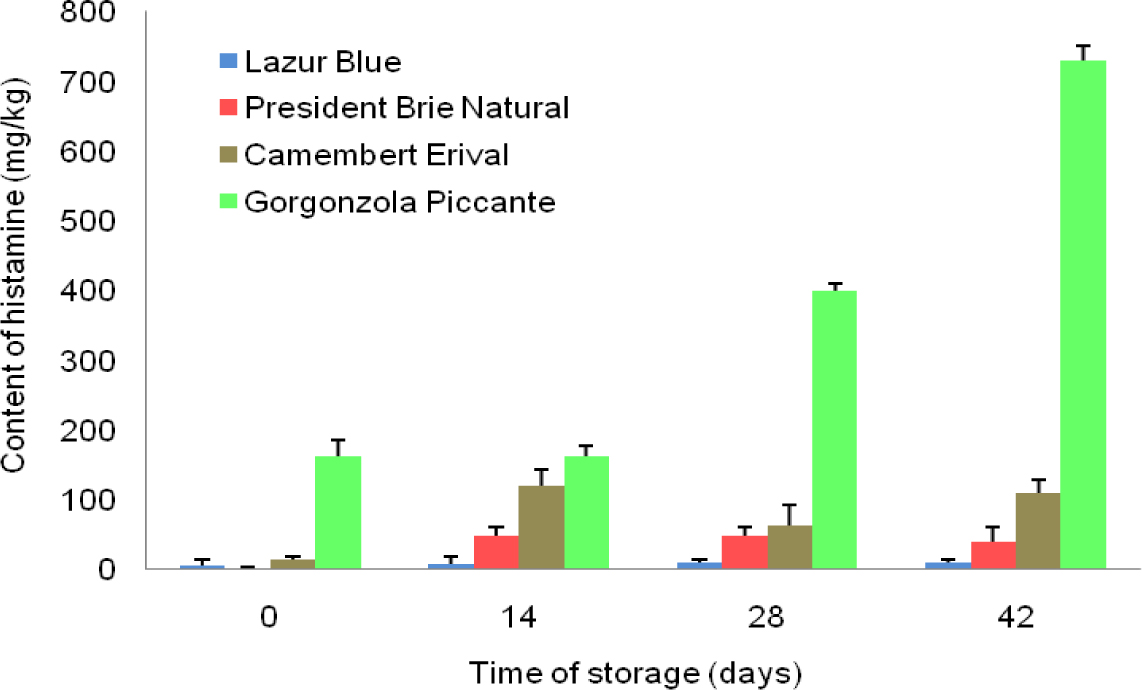
Fig. 1
Concentration of histamine in mould cheeses during storage at 22 ± 2°C. Each bar represents results as mean ± SD
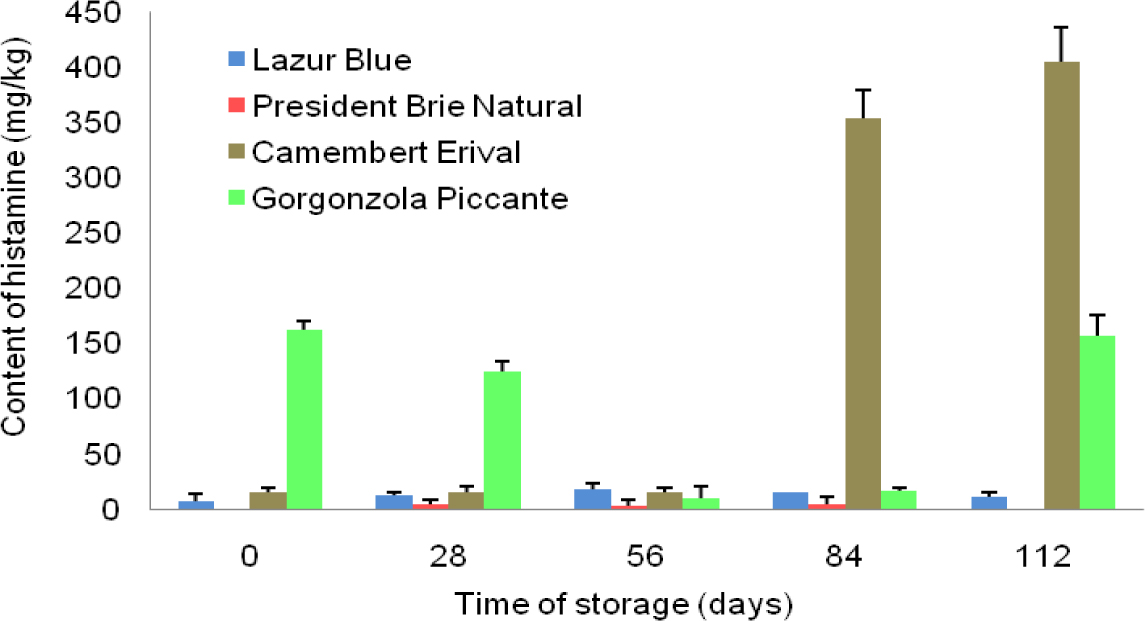
Fig. 2
Concentration of histamine in mould cheeses during storage at 4 ± 2°C. Each bar represents results as mean ± SD
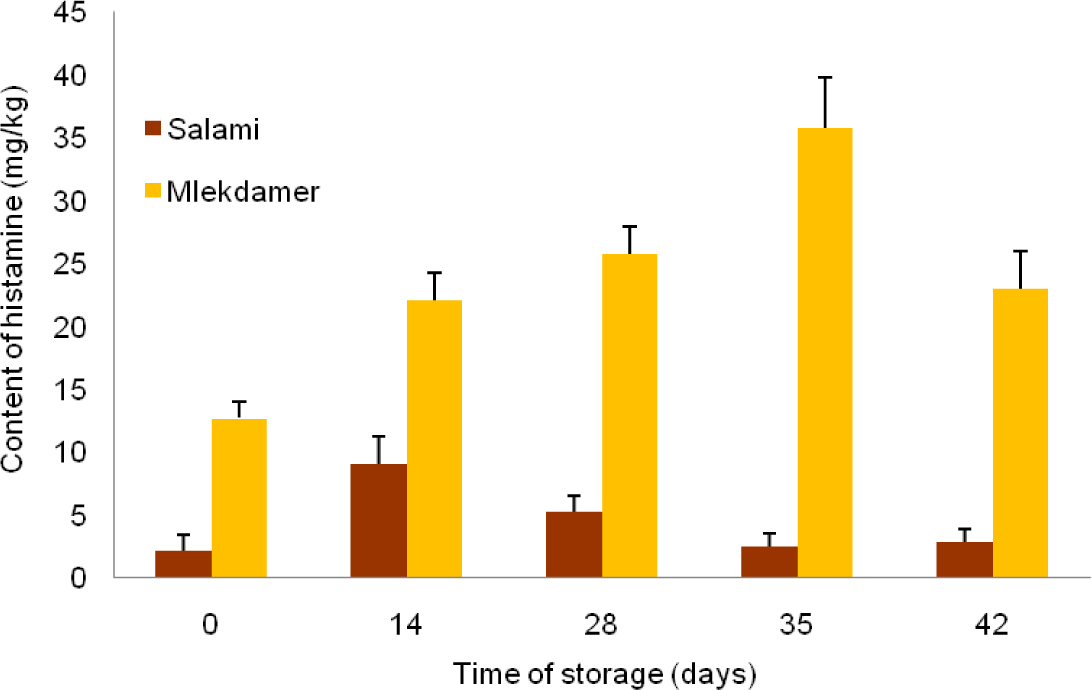
Fig. 3
Concentration of histamine in hard cheeses during storage at 22 ± 2°C. Each bar represents results as mean ± SD of three replicates
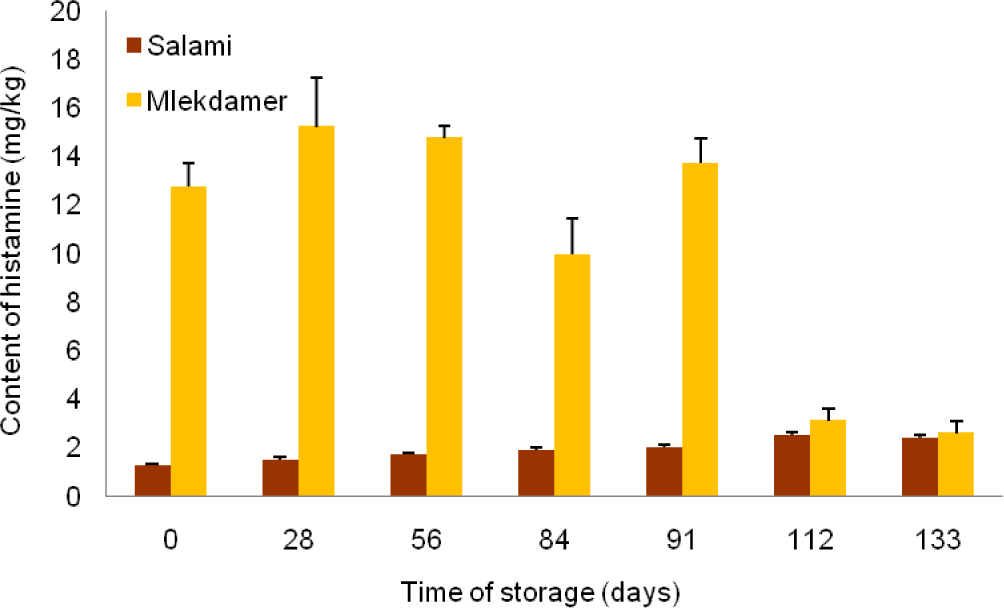
Fig. 4
Concentration of histamine in hard cheeses during storage at 4 ± 2°C. Each bar represents results as mean ± SD of three replicates