
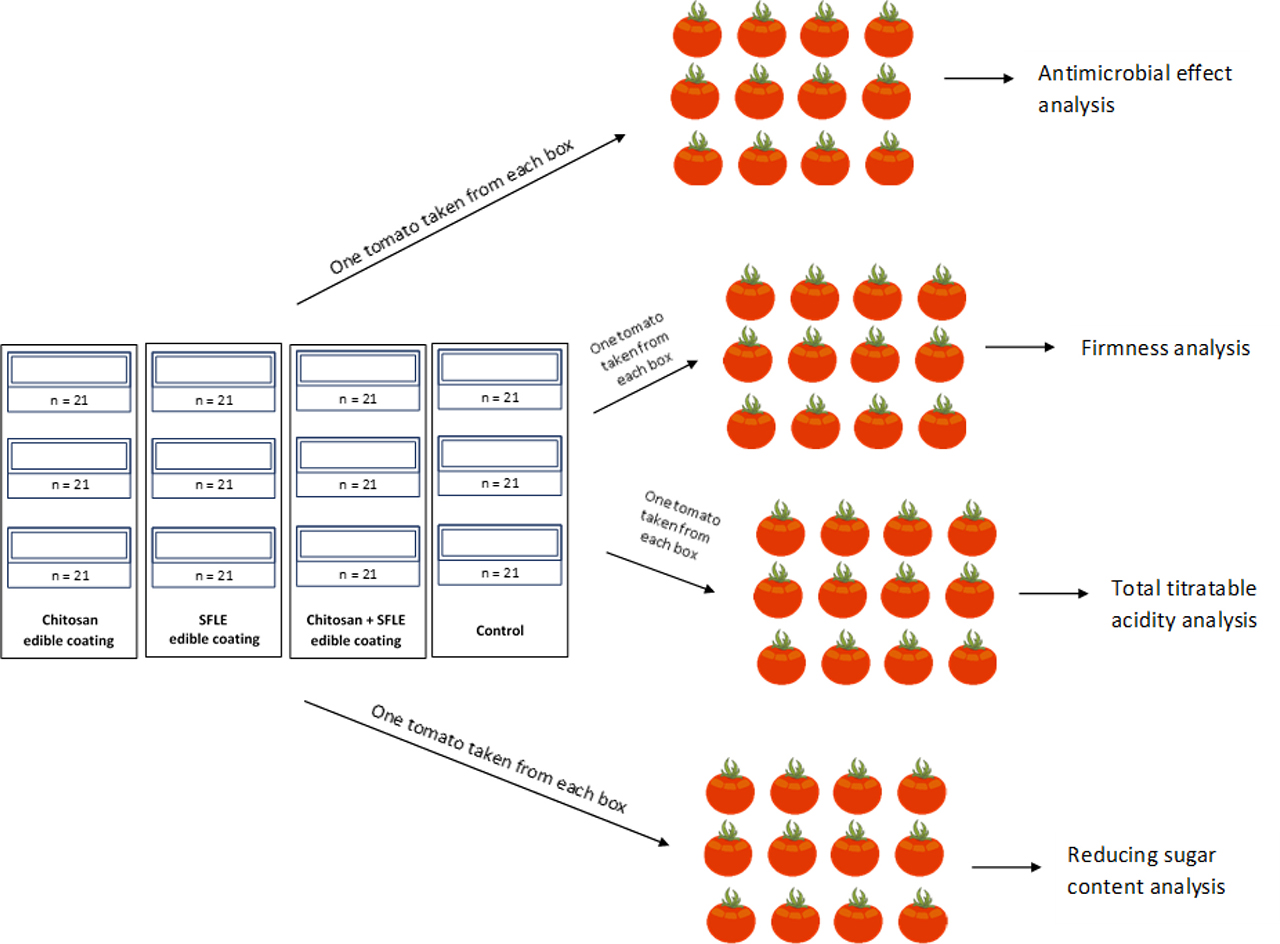
Figure 1
Scheme of study design for one-day measurement
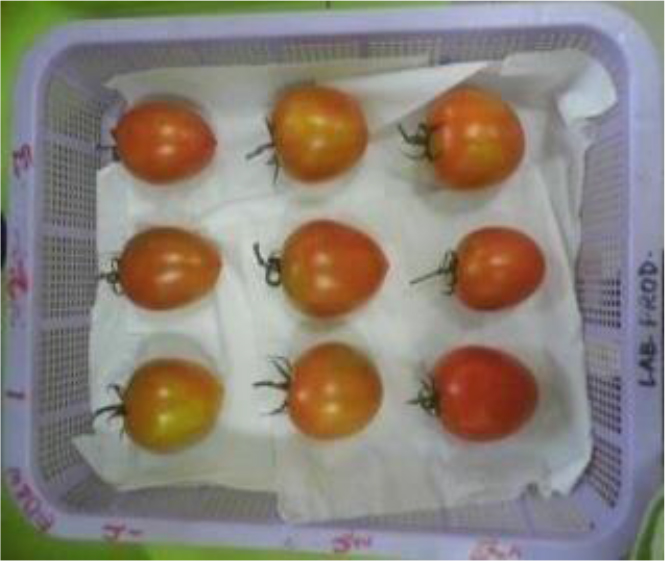
Figure 2
Image of the stored samples
Table 1
Total plate count (log CFU per mL ± SD)
| Day | Chitosan | SFLE | Chitosan + SFLE | Control | p-value |
|---|---|---|---|---|---|
| 5 | 5.70 ± 0.35a | 6.09 ± 0.44a | 5.67 ± 0.31a | 6.50 ± 0.35a | 0.330 |
| 10 | 6.12 ± 0.34ab | 5.73 ± 0.40a | 5.45 ± 0.45a | 7.12 ± 0.56b | 0.043 |
| 15 | 6.76 ± 0.41b | 5.90 ± 0.09a | 5.81 ± 0.26a | 7.01 ± 0.3b | 0.008 |
| 20 | 6.66 ± 0.70b | 6.28 ± 0.27b | 6.17 ± 0.38b | 7.02 ± 0.81b | ≈1.000 |
| 25 | 7.07 ± 0.71b | 7.11 ± 0.73b | 6.88 ± 0.66b | 7.81 ± 0.58b | ≈1.000 |
[i] The p-value indicates to F-statistical probability of each day separately as a result of one-way ANOVA test. The results with the same superscript letter(s) and order indicate that no significant difference was found between the results (p > 0.05) according to the Tukey HSD test with Bonferroni correction
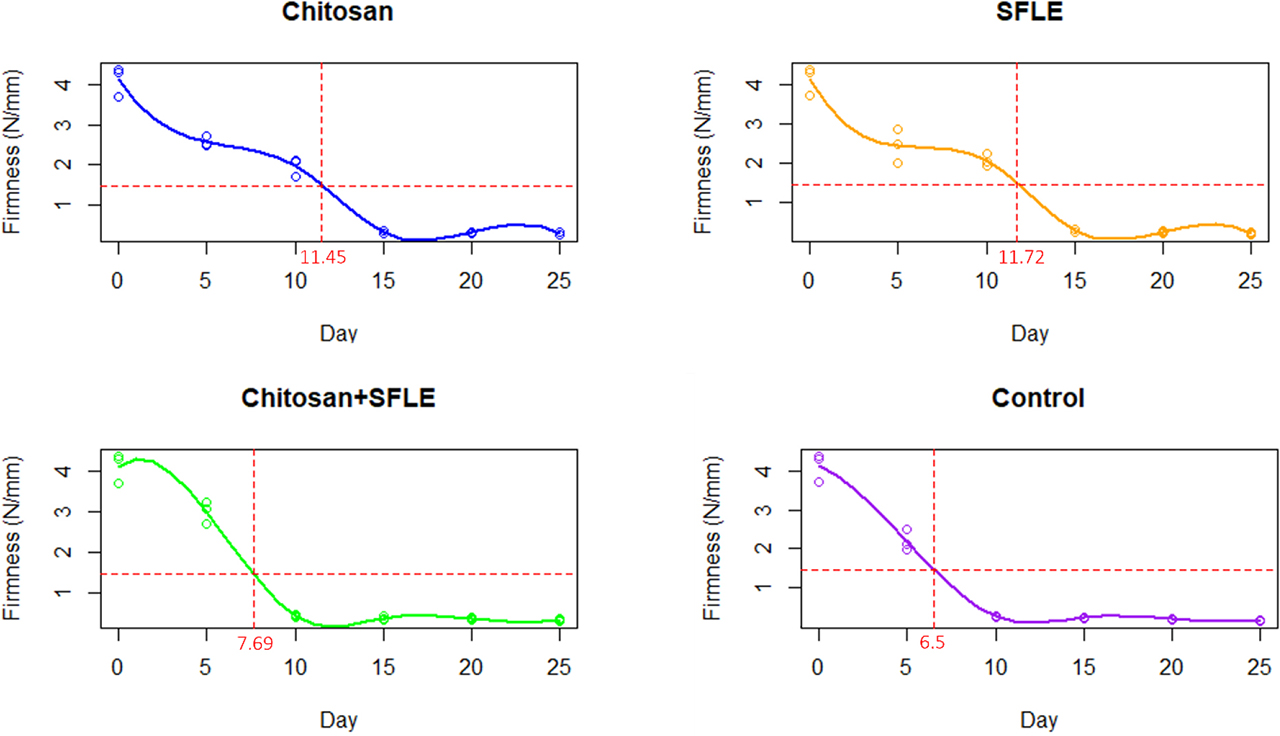
Figure 3
Firmness as a function of observation days in tomato coated with different composition of chitosan-based edible coating enriched with SFLE
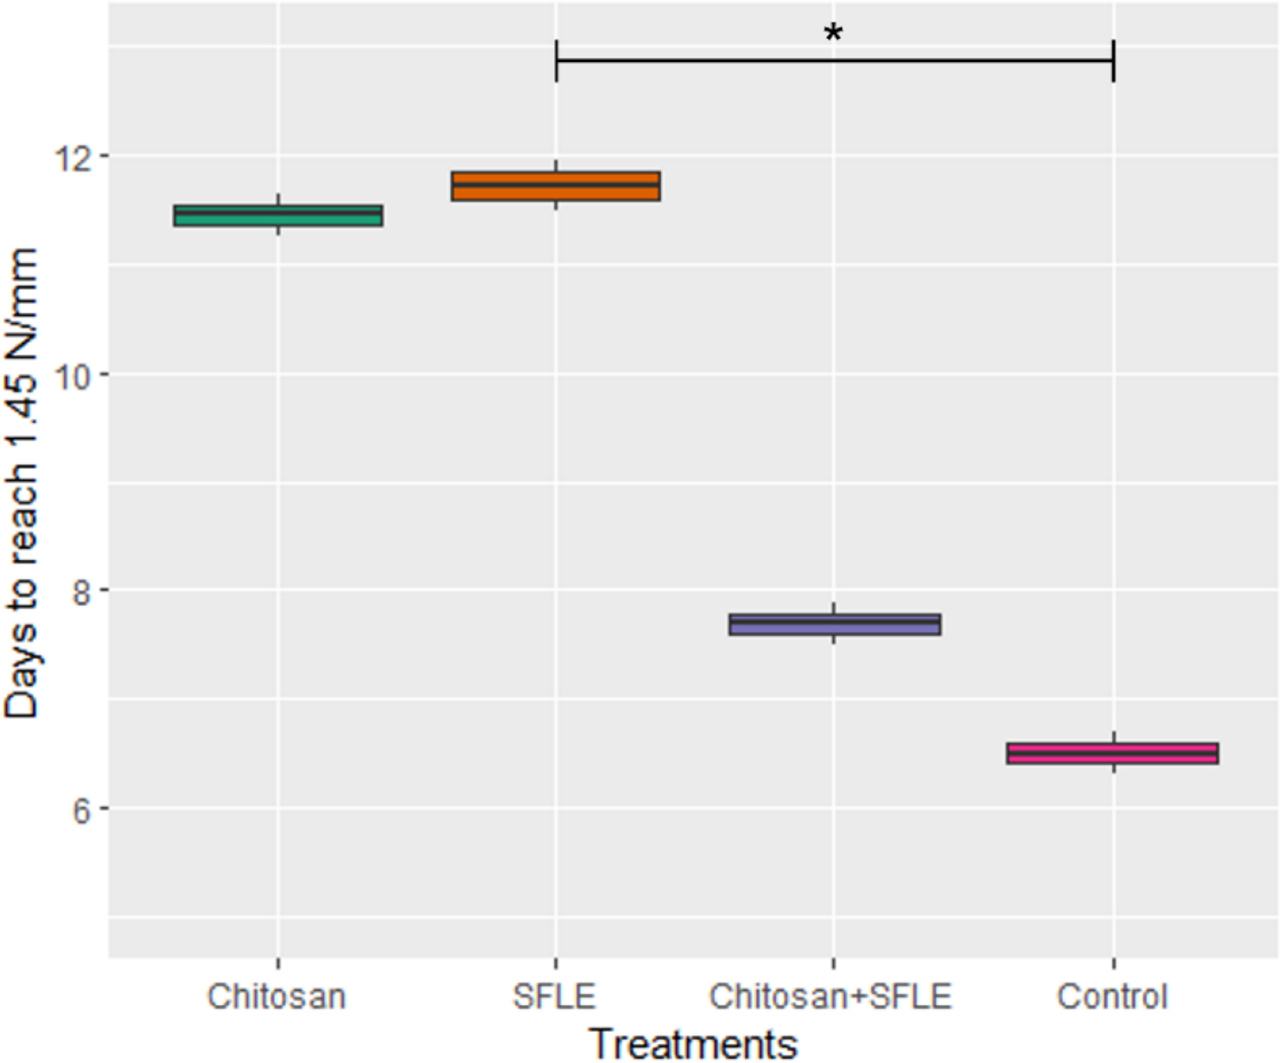
Figure 4
Days needed to reach 1.45 N·mm−1 firmness for tomato treated with different composition of chitosan-based edible coating enriched with SFLE
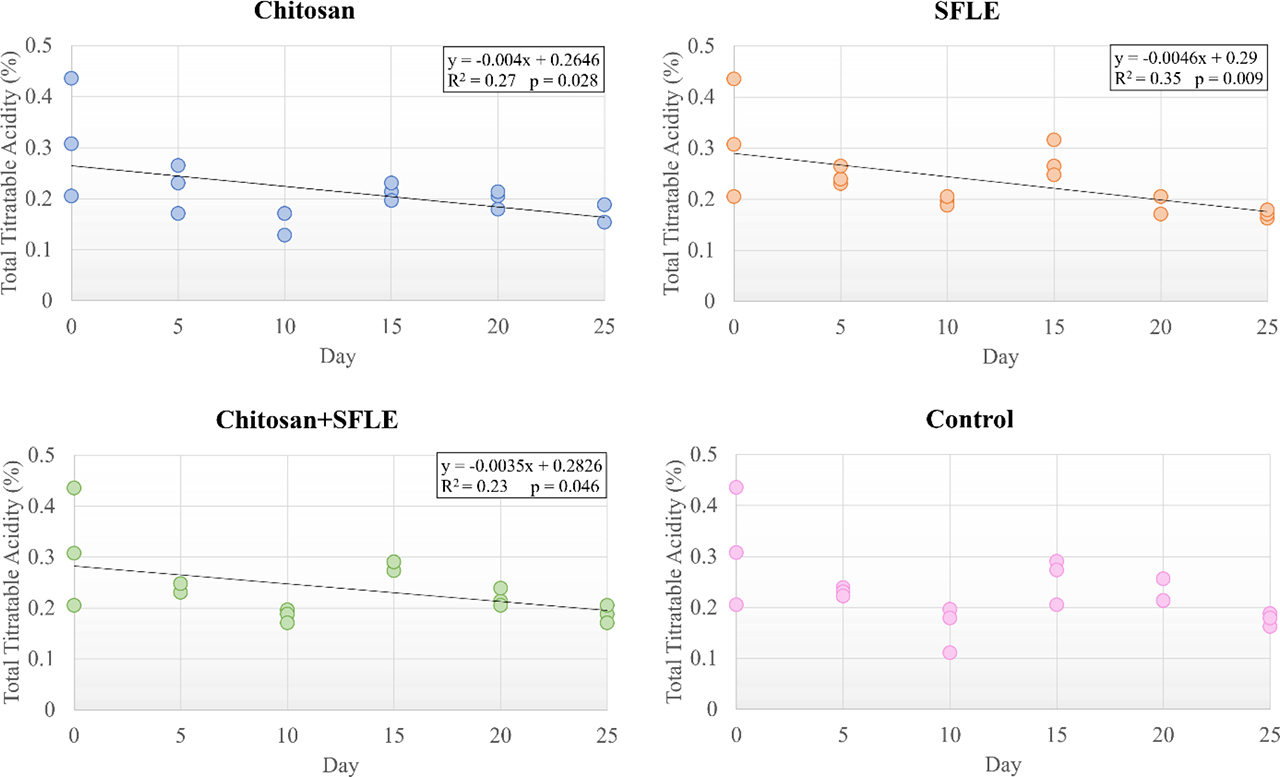
Figure 5
Total titratable acidity as a function of observation days in tomato coated different composition of chitosan-based edible coating enriched with SFLE
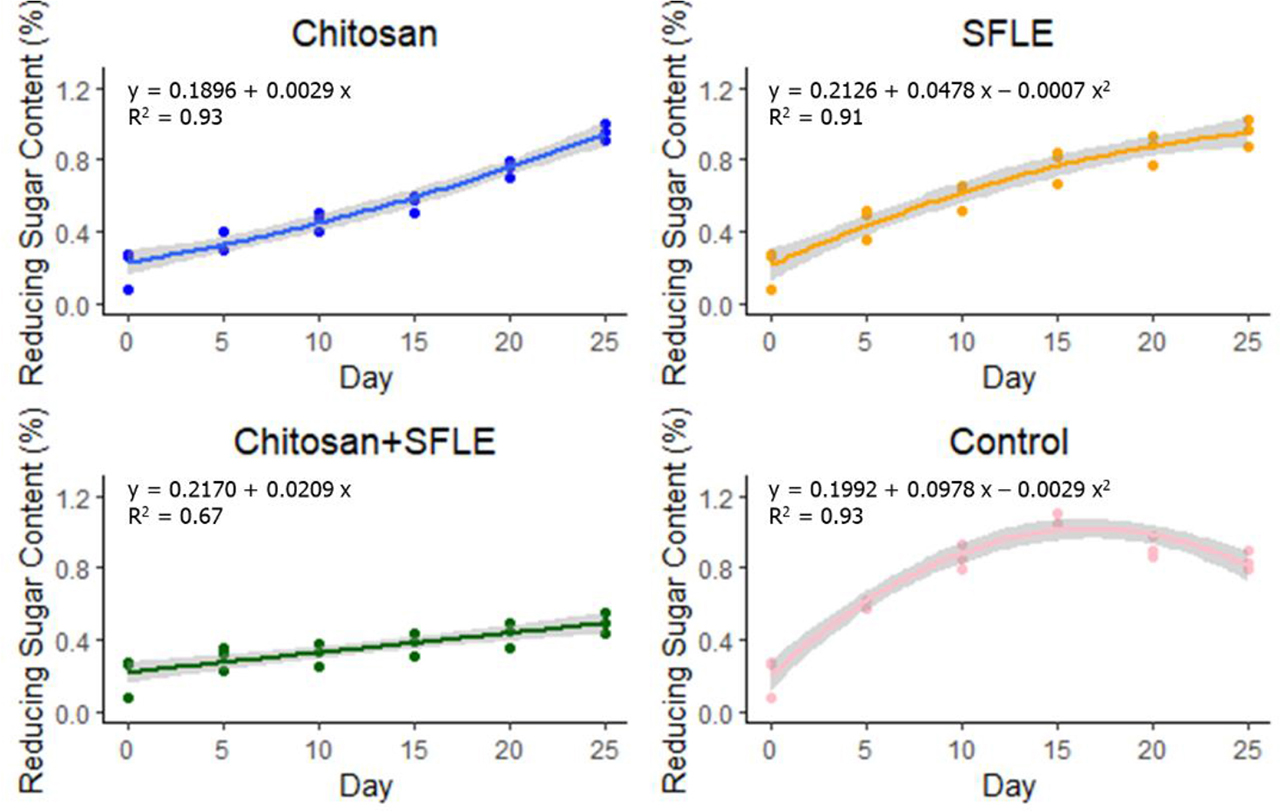
Figure 6
Reducing sugar content as a function of observation days in tomato coated different composition of chitosan-based edible coating enriched with SFLE