
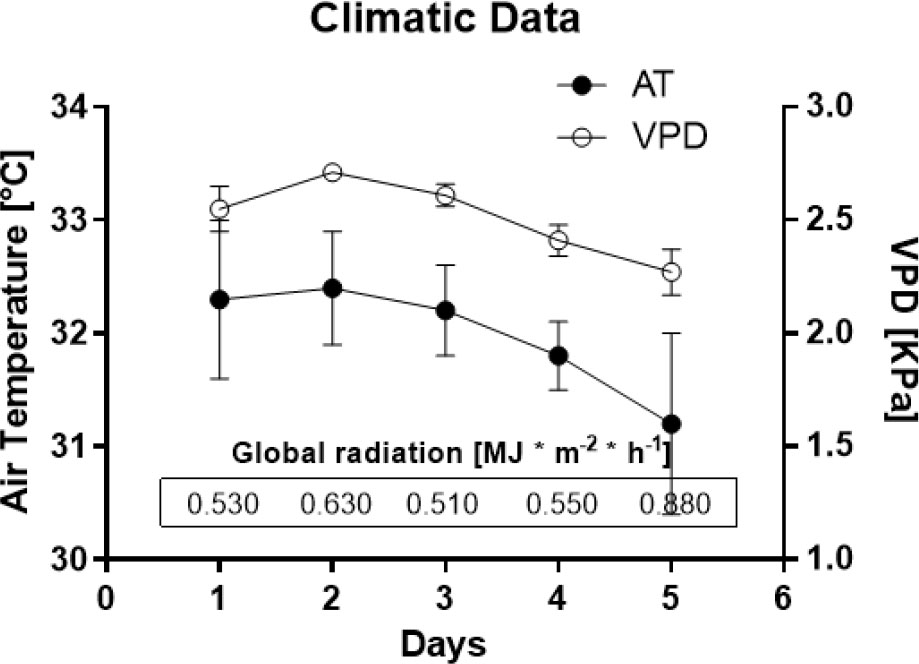
Fig. 1
Trend of climatic data during the days of experiment: Temperature (closed circles), vapor pressure deficit (VPD, open circles), and global radiation (RG) are shown. Error bars for each average value of temperature and VPD come from 3 measurements, taken at the hours of the day with highest radiation (11:30, 12:30, and 13:30). RG values refer to the interval 11:30–13:30
Table 1
Substrate water tension (SWT) versus percentage of container capacity for the three investigated species
| N. oleander | L. japonicum | P. tobira | |||
|---|---|---|---|---|---|
| SWT | % C.C. | SWT | % C.C. | SWT | % C.C. |
| 8 | 100 | 18 | 100 | 23 | 100 |
| 26 | 89.5 | 35 | 90.7 | 41 | 90.7 |
| 46 | 78.8 | 41 | 85.6 | 65 | 85.6 |
| 78 | 69.6 | 65 | 76.1 | 90 | 76.1 |
| 117 | 59.8 | 101 | 65.3 | 135 | 65.3 |
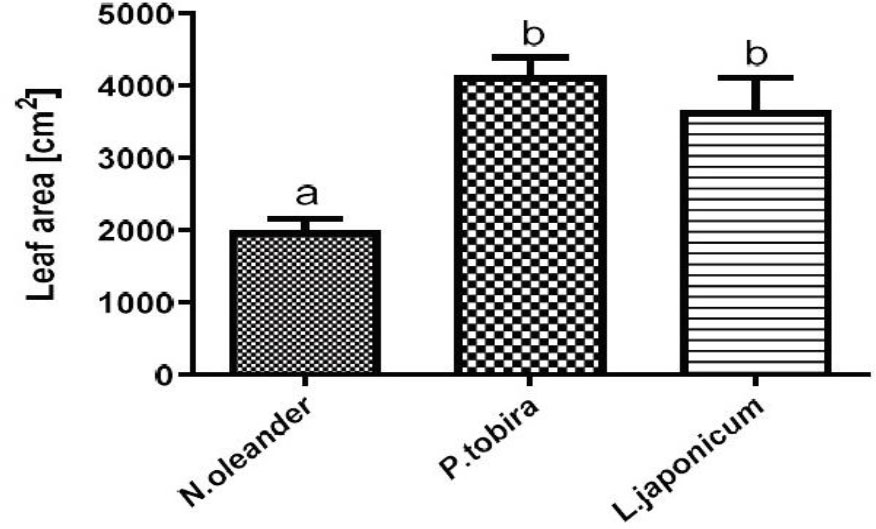
Fig. 2
Leaf area by species. Values marked with the same letter are not statistically different at p < 0.05, according to Duncan's multiple range test. Error bars were calculated from six measurements (replicates) for each average value
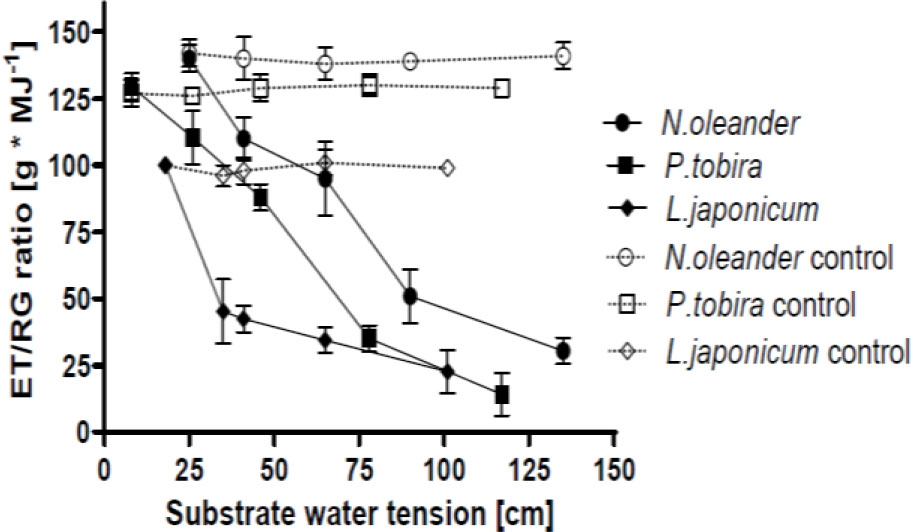
Fig. 3
ET/RG ratio versus substrate water tension
Note: See Fig. 2
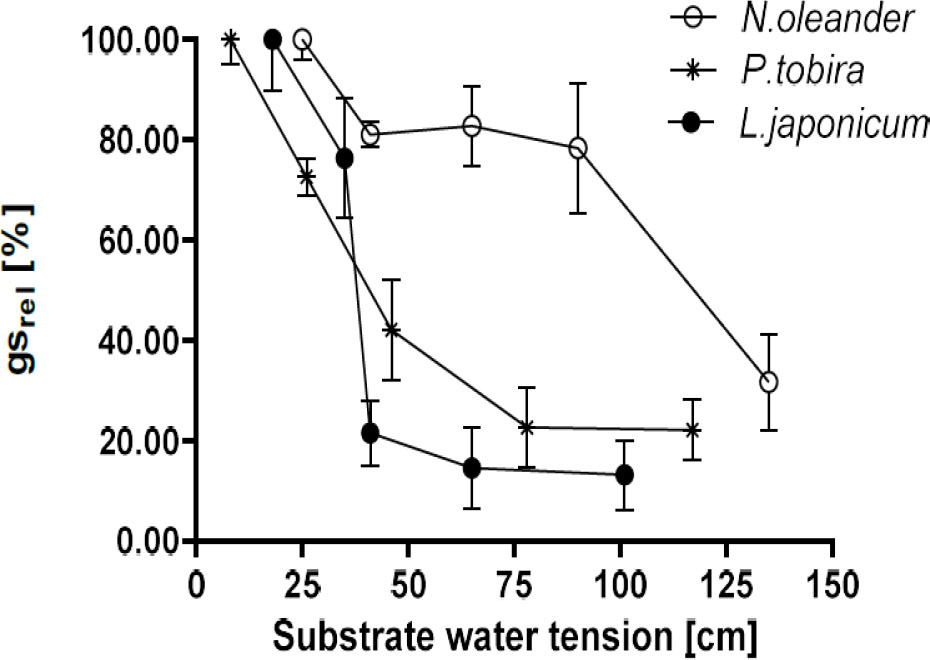
Fig. 4
Relative stomatal conductance (gsrel) versus substrate water tension
Note: See Fig. 2
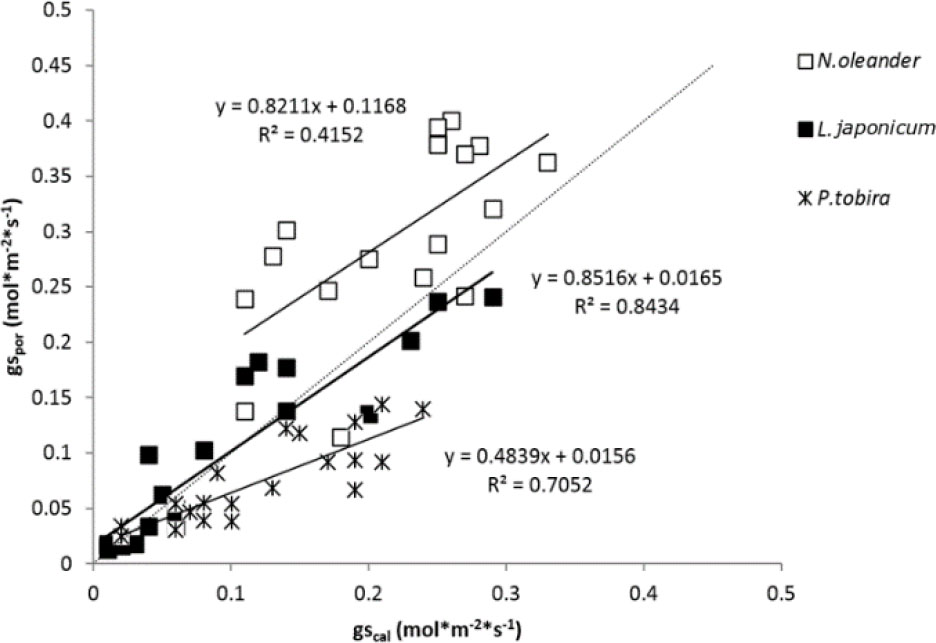
Fig. 5
Linear correlation between measured and calculated stomatal conductance; for each species, a single regression line, with slope and R2, is presented in the graph; the central dotted line represents the ideal 1 : 1 relationship between measured and calculated gs
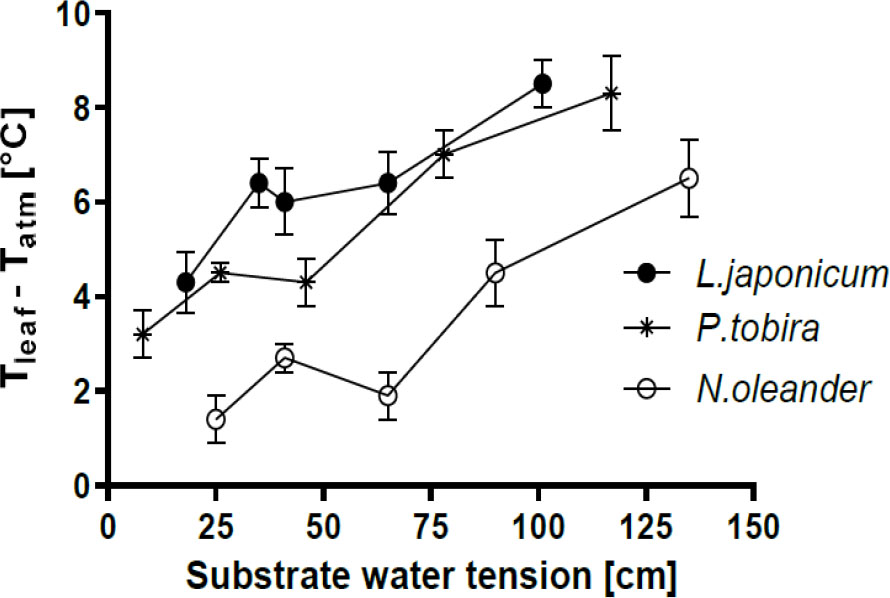
Fig. 6
ΔT versus substrate water tension. Note: See Fig. 2