
Table 1
Number of reniform nematodes in four developmental stages (vermiform, swelling, reniform, gravid) and total number of nematodes per gram of root on susceptible (Braxton) and resistant (JTN-5203, 02011-126, and PI 404166) soybean in growth chamber tests at 2 days intervals during the first 10 DAI
| Developmental stage | Soybean genotype | 2 DAI | 4 DAI | 6 DAI | 8 DAI | 10 DAI | |||||
|---|---|---|---|---|---|---|---|---|---|---|---|
| Vermiform | Braxton | 0.1 | 0.4 | 0.6 | 0.2 | 0.0 | - & | ||||
| JTN-5203 | 0.0 | 0.3 | 0.6 | 0.0 | 0.0 | - | |||||
| PI 404166 | 0.0 | 0.7 | 1.1 | 0.0 | 0.0 | - | |||||
| 02011-126* | 0.0 | 0.2 | 0.6 | 0.1 | 0.0 | - | |||||
| Swelling | Braxton | 0.0 | - & | 1.3 | b | 4.8 | 2.0 | 0.7 | b | ||
| JTN-5203 | 0.0 | - | 1.4 | b | 7.6 | 1.8 | 3.0 | a | |||
| PI 404166 | 0.0 | - | 5.4 | a | 4.8 | 2.1 | 0.7 | b | |||
| 02011-126* | 0.0 | - | 1.2 | b | 4.3 | 3.2 | 2.5 | a | |||
| Reniform | Braxton | 0.0 | - & | 0.0 | 0.6 | 5.7 | a | 4.1 | |||
| JTN-5203 | 0.0 | - | 0.1 | 0.8 | 1.0 | b | 3.6 | ||||
| PI 404166 | 0.0 | - | 0.1 | 0.5 | 1.6 | b | 1.4 | ||||
| 02011-126* | 0.0 | - | 0.0 | 0.4 | 0.9 | b | 1.7 | ||||
| Gravid | Braxton | 0.0 | - & | 0.0 | - & | 0.0 | - & | 2.5 | a | 4.1 | a |
| JTN-5203 | 0.0 | - | 0.0 | - | 0.0 | - | 0.2 | b | 1.6 | ab | |
| PI 404166 | 0.0 | - | 0.0 | - | 0.0 | - | 0.4 | b | 0.6 | b | |
| 02011-126* | 0.0 | - | 0.0 | - | 0.0 | - | 0.1 | b | 1.0 | b | |
| All stages combined | Braxton | 0.1 | 1.6 | b | 7.1 | 14.3 | a | 10.0 | a | ||
| JTN-5203 | 0.0 | 1.9 | b | 9.9 | 4.3 | b | 9.9 | a | |||
| PI 404166 | 0.0 | 6.5 | a | 7.0 | 5.3 | b | 2.4 | b | |||
| 02011-126* | 0.0 | 1.5 | b | 6.7 | 5.4 | b | 5.2 | ab | |||
Within each developmental stage and interval, mean values (20 plants; pooled data from two tests) followed by the same letter are not significantly different (differences of least squares means, P ≤ 0.05).
Table 2
Number of reniform nematodes in three developmental stages (swelling, reniform, gravid) and total number of nematodes per gram of root on susceptible (Braxton) and resistant (JTN-5203, 02011-126, and PI 404166) soybean in growth chamber tests at 5 days intervals from 15 to 30 DAI
| Developmental stage | Soybean genotype | 15 DAI | 20 DAI | 25 DAI | 30 DAI | ||||
|---|---|---|---|---|---|---|---|---|---|
| Swelling | Braxton | 1.0 | 0.4 | 0.1 | b | 0.3 | a | ||
| JTN-5203 | 1.0 | 0.2 | 0.2 | b | 0.0 | b | |||
| PI 404166 | 0.4 | 0.1 | 0.0 | b | 0.0 | b | |||
| 02011-126* | 2.5 | 0.3 | 0.6 | a | 0.1 | b | |||
| Reniform | Braxton | 2.4 | 1.5 | a | 0.5 | 1.5 | a | ||
| JTN-5203 | 1.0 | 0.3 | b | 0.2 | 0.1 | b | |||
| PI 404166 | 0.7 | 0.1 | b | 0.1 | 0.2 | b | |||
| 02011-126* | 1.5 | 0.2 | b | 0.2 | 0.1 | b | |||
| Gravid | Braxton | 9.8 | a | 6.1 | a | 5.8 | a | 3.7 | a |
| JTN-5203 | 2.0 | b | 0.4 | b | 0.2 | b | 0.2 | b | |
| PI 404166 | 0.9 | b | 0.1 | b | 0.1 | b | 0.1 | b | |
| 02011-126* | 0.5 | b | 0.3 | b | 0.2 | b | 0.5 | b | |
| All stages combined | Braxton | 13.7 | a | 8.2 | a | 6.4 | a | 5.6 | a |
| JTN-5203 | 3.9 | b | 0.7 | b | 0.5 | b | 0.3 | b | |
| PI 404166 | 1.9 | b | 0.2 | b | 0.2 | b | 0.2 | b | |
| 02011-126* | 4.3 | b | 0.7 | b | 0.9 | b | 0.6 | b | |
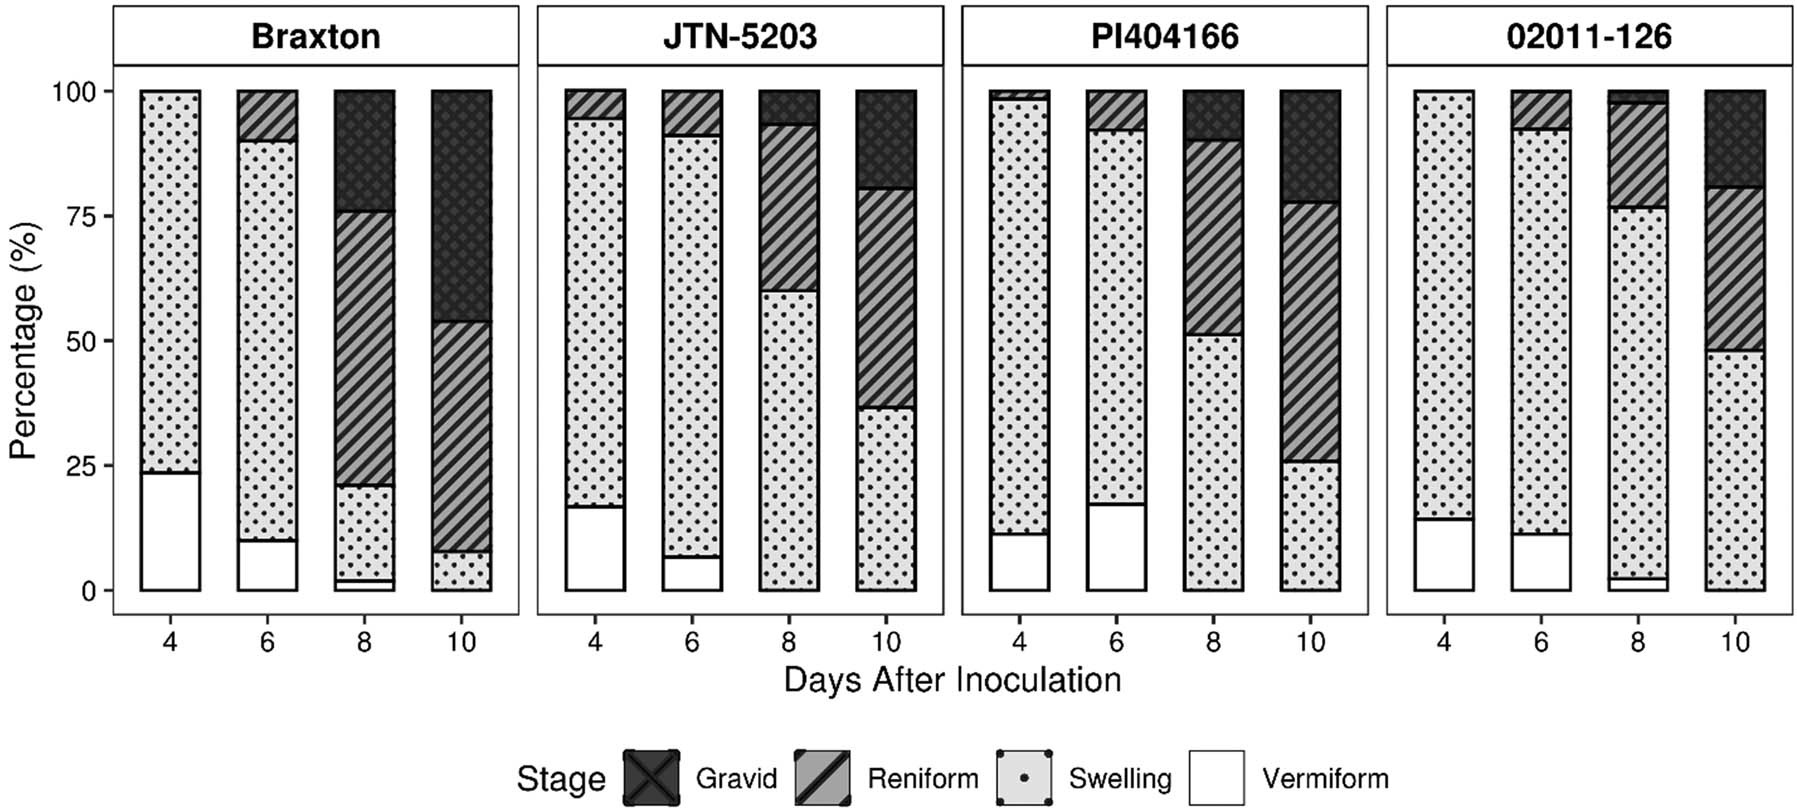
Figure 1
Proportion of the reniform nematode population in four developmental cohorts ranging from vermiform (immature) to gravid (mature) (Y-axis) at 2 days intervals from 4 to 10 DAI (X-axis) on susceptible soybean cultivar Braxton and the resistant soybean genotypes 02011-126-1-1-5-1-1 (0211-126), JTN-5203, and PI 404166.
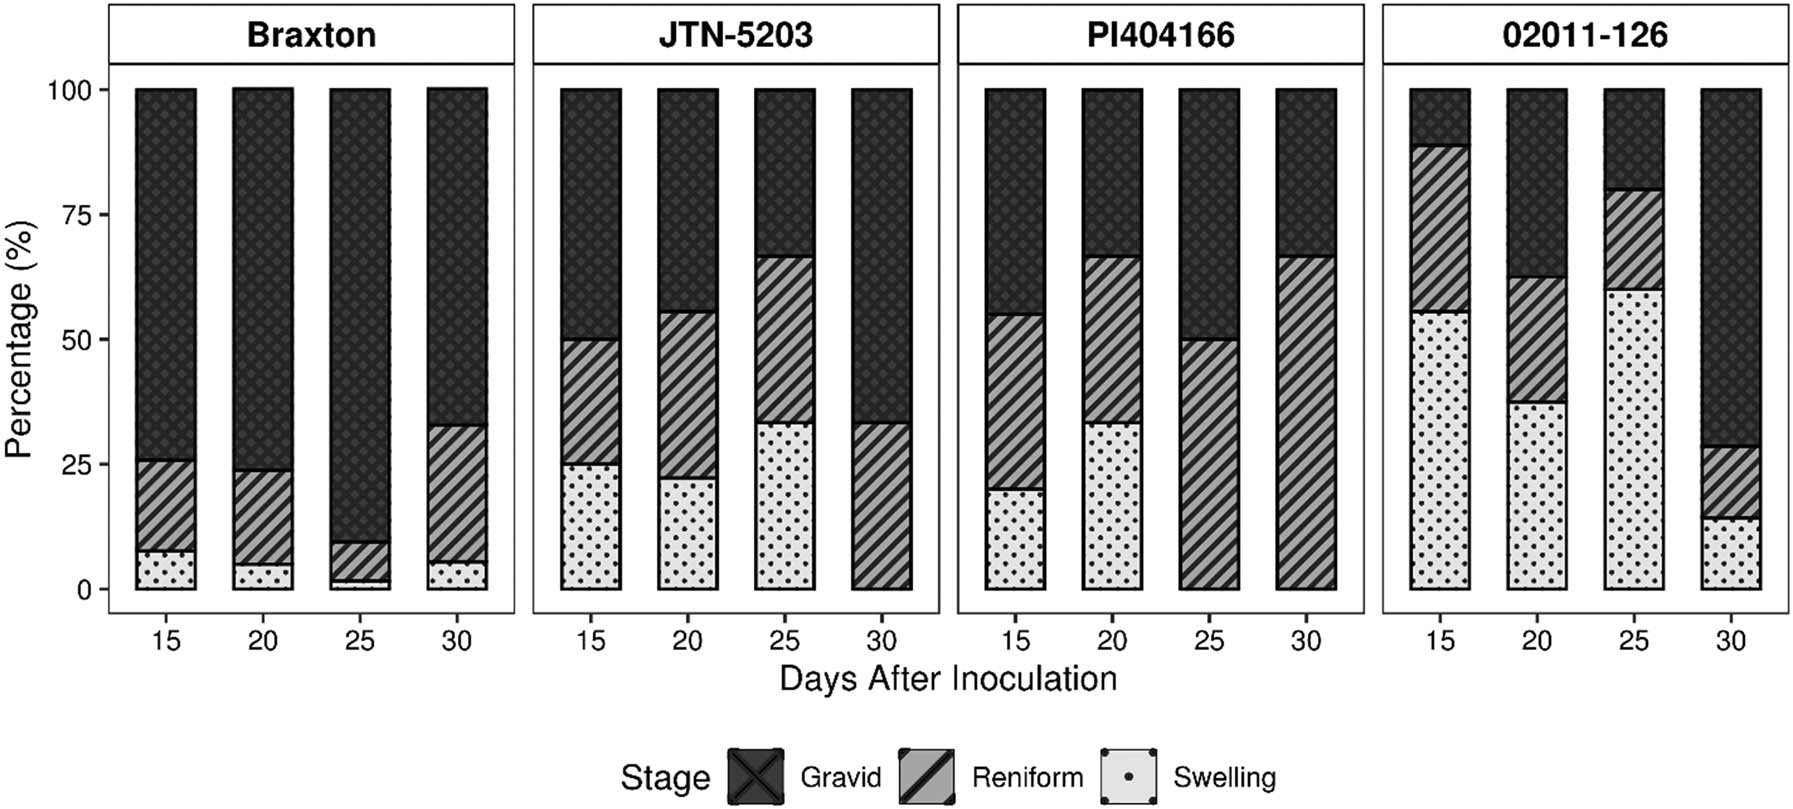
Figure 2
Proportion of the reniform nematode population in three developmental cohorts ranging from swelling (immature) to gravid (mature) (Y-axis) at 5 days intervals from 15 to 30 DAI (X-axis) on susceptible soybean cultivar Braxton and the resistant soybean genotypes 02011-126-1-1-5-1-1 (02011-126), JTN-5203, and PI 404166; none of the nematodes observed were in the vermiform stage of development on any genotype during this later stage of the infection cycle.
Table 3
Reniform nematode egg production on susceptible (Braxton) and resistant (JTN-5203, 02011-126, and PI 404166) soybean in two growth chamber tests
| 25 DAI | 30 DAI | ||||||||
|---|---|---|---|---|---|---|---|---|---|
| Eggs per egg mass | Eggs per egg mass | ||||||||
| Test | Soybean line | Number of egg masses counted | Mean value | Max$ | Min& | Number of egg masses counted | Mean value | Max$ | Min& |
| 1 | Braxton | 50 | 28.4a | 99 | 0 | 50 | 35.7a | 217 | 3 |
| JTN-5203 | 45 | 9.2b | 50 | 0 | 37 | 4.1b | 51 | 0 | |
| PI 404166 | 32 | 6.2b | 26 | 0 | 4 | 7.1b | 20 | 0 | |
| 02011-126* | 13 | 9.2b | 40 | 0 | 10 | 2.3b | 17 | 0 | |
| 2 | Braxton | 50 | 38.5a | 136 | 3 | 50 | 56.2a | 181 | 3 |
| JTN-5203 | 6 | 2.1c | 21 | 0 | 8 | 1.3b | 6 | 0 | |
| PI 404166 | 1 | 3.0bc | - | - | 1 | 10.0ab | - | - | |
| 02011-126* | 8 | 9.4b | 20 | 2 | 16 | 4.8b | 16 | 0 | |