
Table 1:
Response of TC banana accessions to R. similis infection.
| Accession | Genome group | Resistance response |
|---|---|---|
| cv. Rose | AA | Unknown |
| TMB2x 9172 | AA | Unknown |
| SH3142 | AA | Resistant |
| Pahang | AA | Unknown |
| PITA 7 | AAAB | Unknown |
| PITA 6 | AAAB | Unknown |
| Obino l'Ewai | AAB | Susceptible |
| Mchare | AA | Susceptible |
| Mbwazirume | EA-AAA | Susceptible |
| IITA hybrid 2145/1320 | AA | Unknown |
| 716 | AA | Unknown |
| 401K-1 | AAAA | Unknown |
| 376K-1 | AAAA | Unknown |
| 365K-1 | AAAA | Unknown |
| 29275S-5 | AAAA | Unknown |
| 201087K-4 | AA | Unknown |
| 201071K | AA | Unknown |
| 10969S-1 | AA | Unknown |
| Yangambi km5 | AAA | Resistant |
| Valery | AAA | Susceptible |
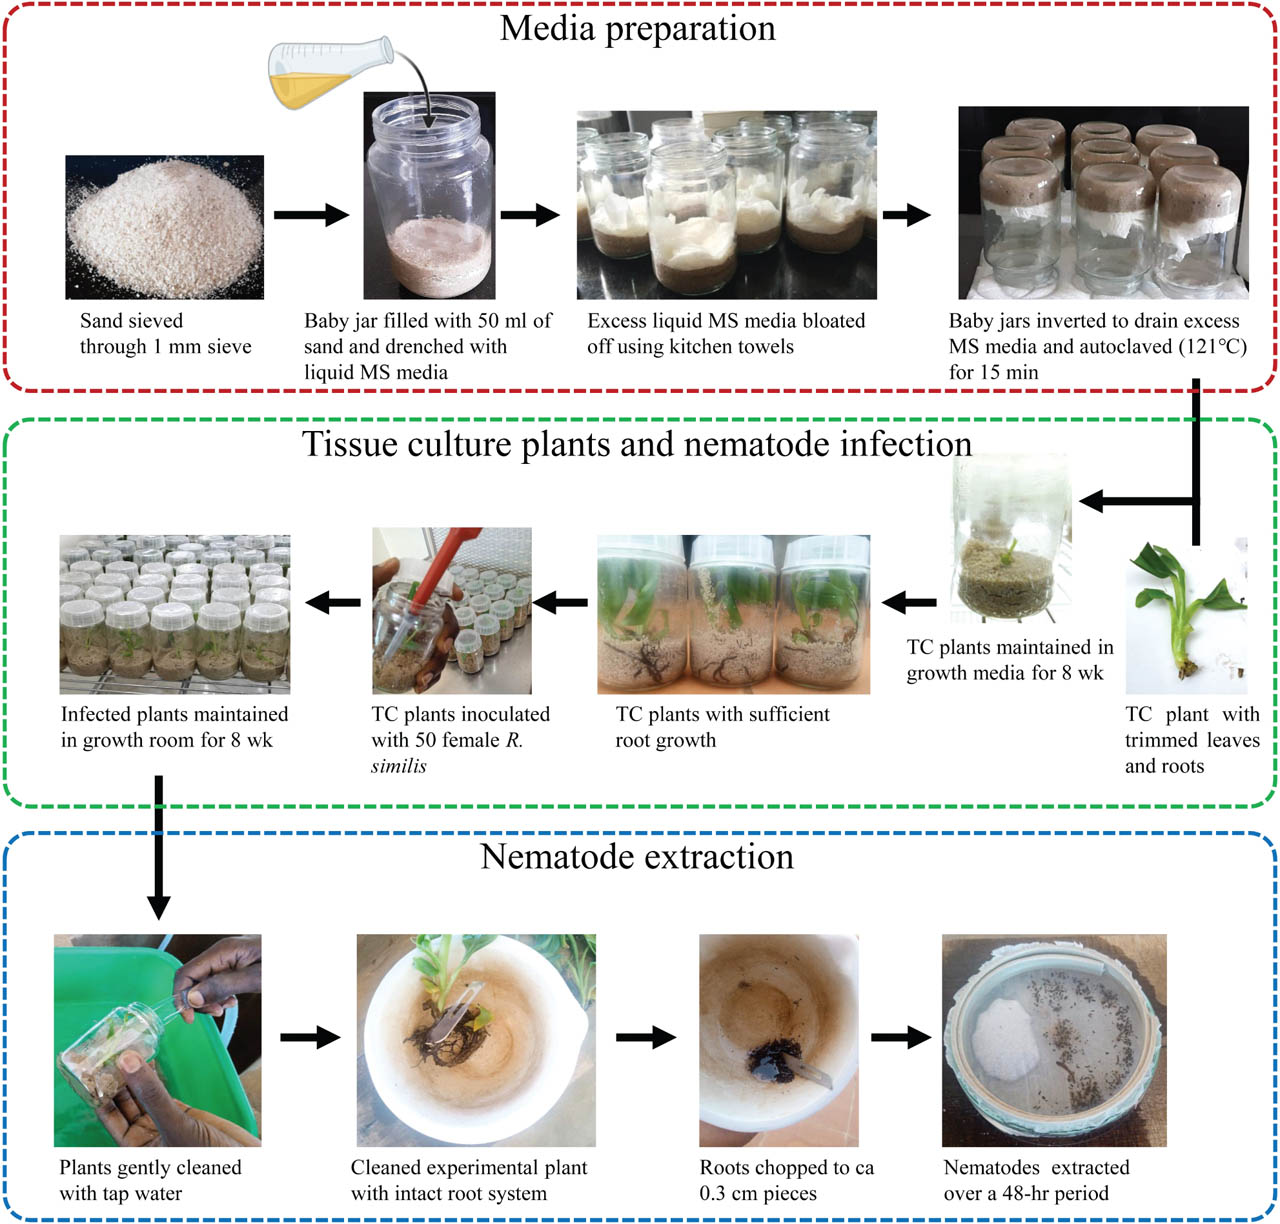
Figure 1:
Schematic representation of the methodology used in preparation of modified MS media, nematode inoculation and extraction. MS, Murashige and Skoog, TC, tissue-culture.
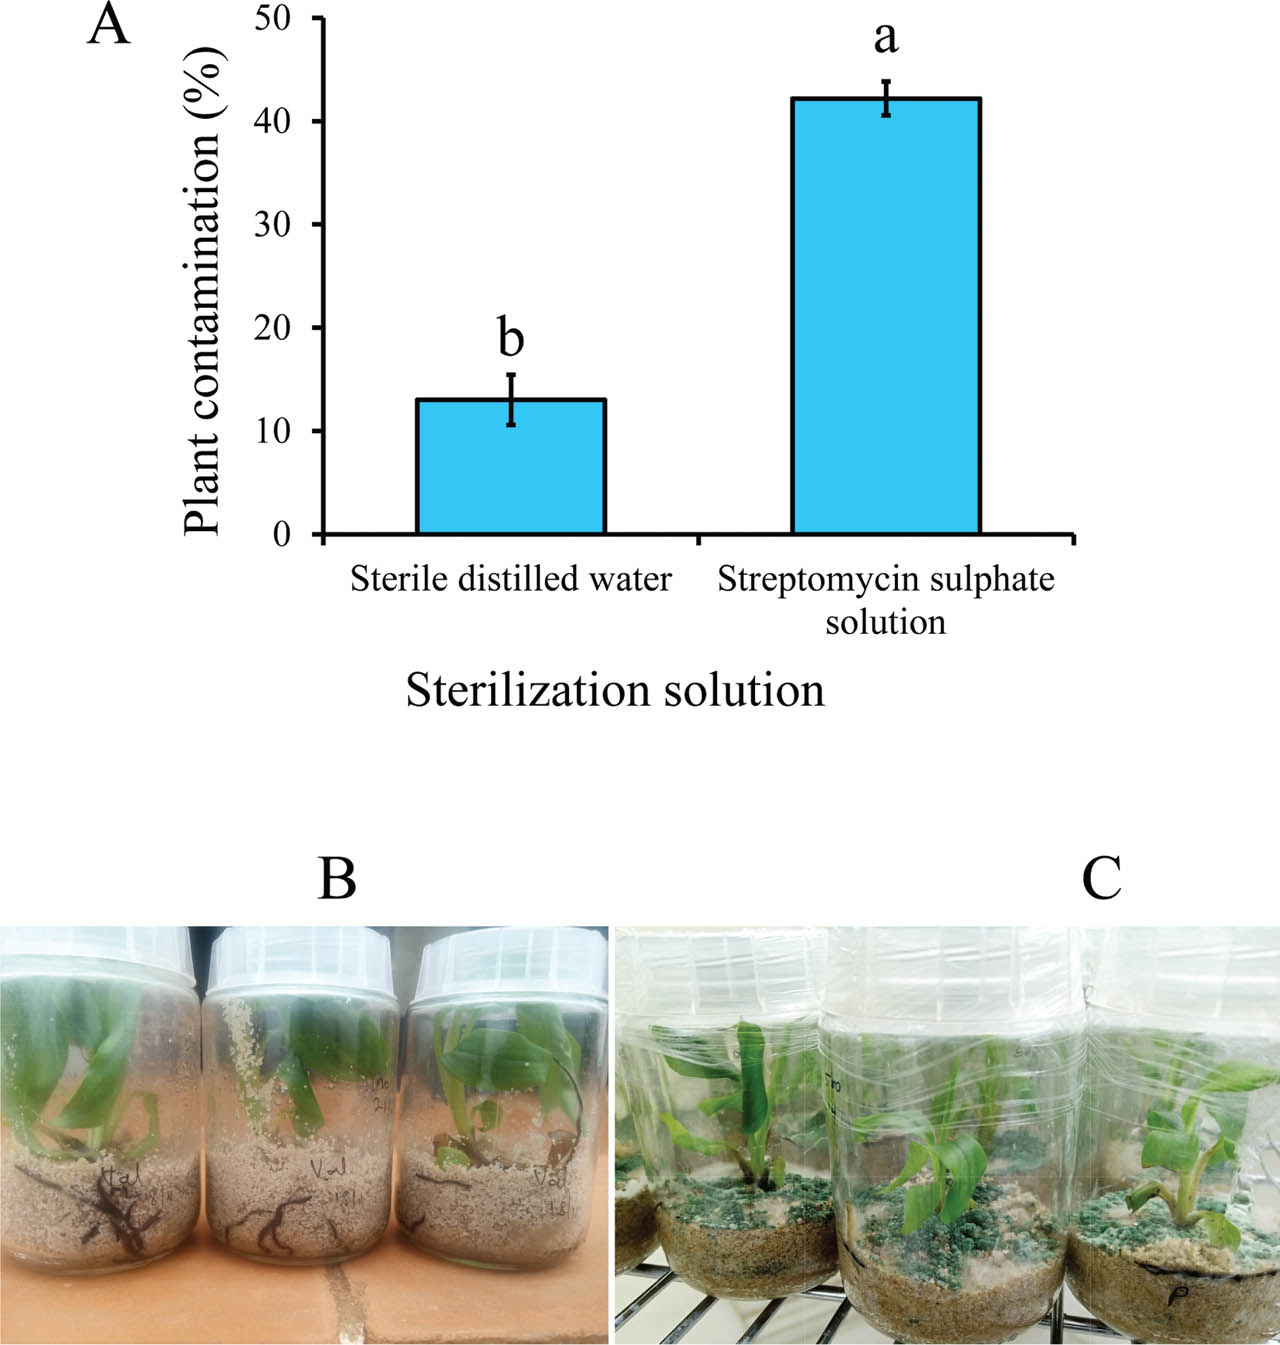
Figure 2:
Contamination intensity (A) in banana tissue-cultured plants at 8 wk post-infection with 50 female R. similis sterilized with either SDW or streptomycin sulfate solution. Data pooled across two experiments and four banana accessions. A bar graph with different letters indicates a significant difference. Means separated by Tukey's HSD test at P < 0.05; Uncontaminated (B) and contaminated (C) plants at 8 wk post infection with R. similis sterilized with SDW and streptomycin sulfate solution, respectively. HSD, honestly significant difference; SDW, sterile distilled water.
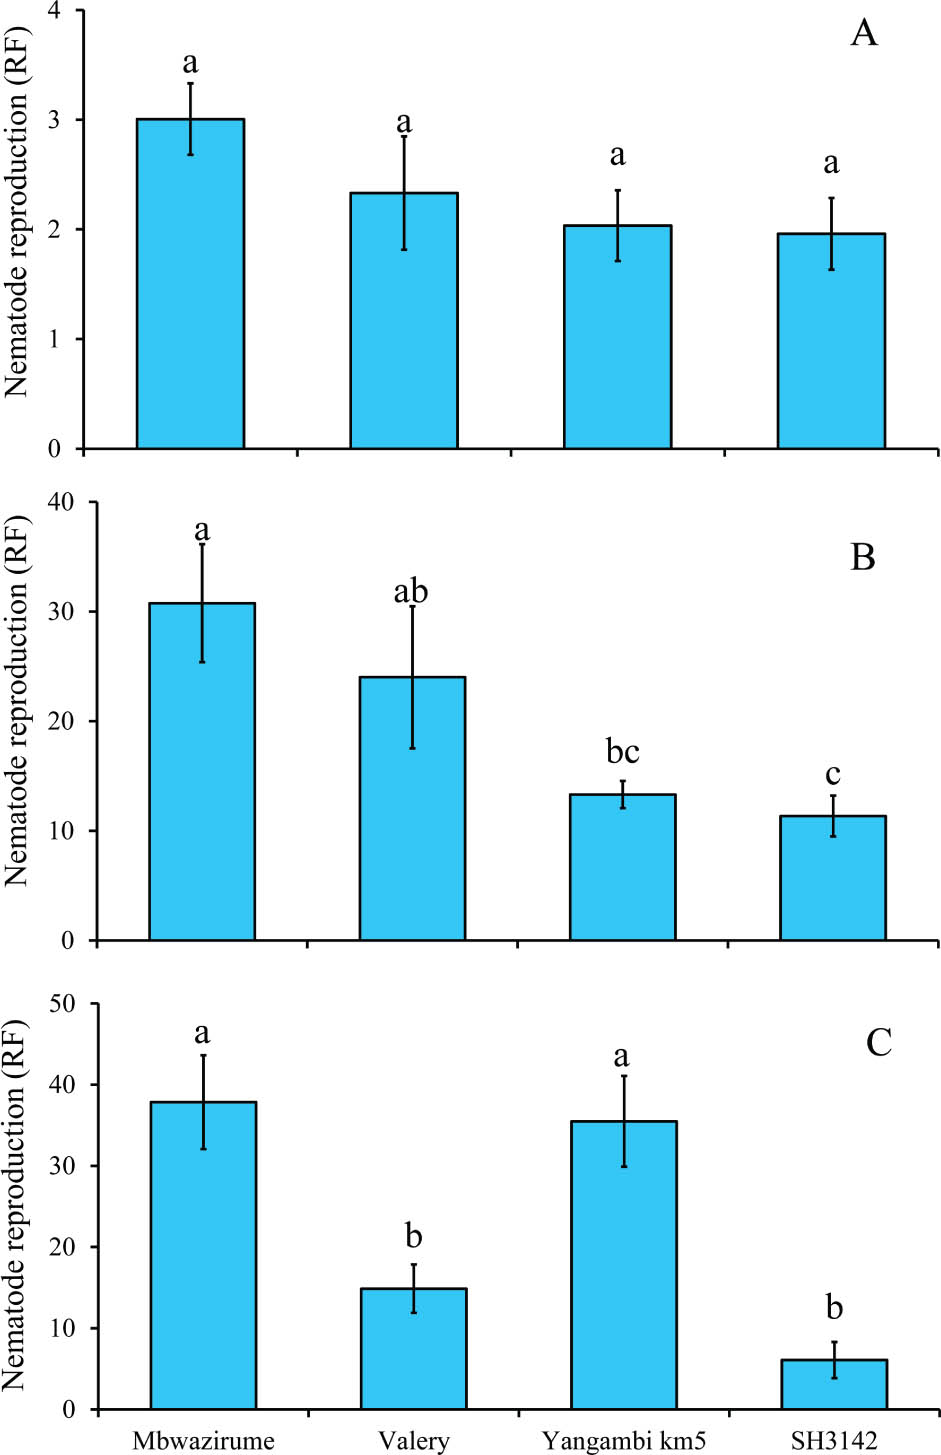
Figure 3:
Reproduction of R. similis in roots of control banana accessions at 2 wk (A), 4 wk (B), and 8 wk (C) post nematode inoculation under in vitro conditions. At each time point, means followed by different letter(s) indicate a significant difference. Means separated by Tukey's HSD test at P < 0.05. HSD, honestly significant difference; RF, reproduction factor.
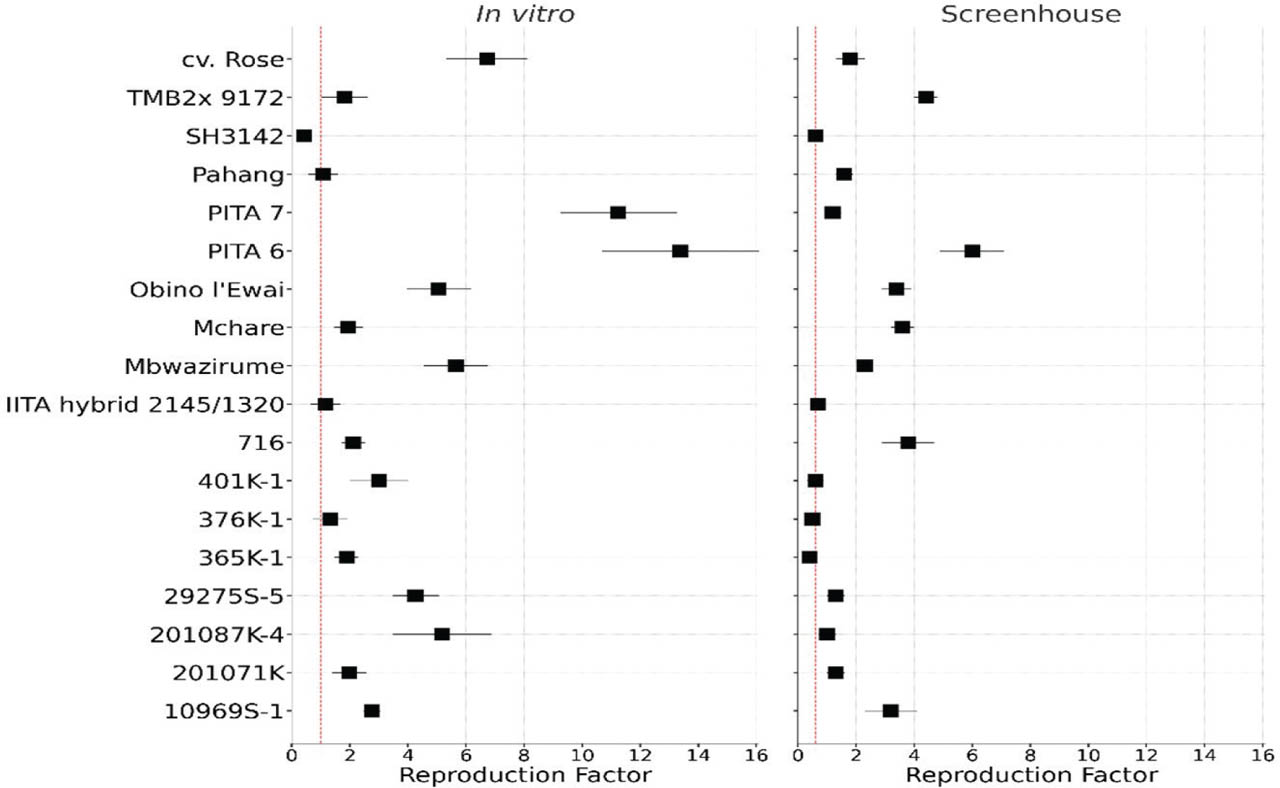
Figure 4:
Forest plot comparing nematode reproduction (RF) in banana accessions under in vitro and screenhouse conditions. For each accession, square markers represent the mean RF value, with horizontal standard error bars. The vertical dotted red line indicates the highest RF value at which no significant difference (P > 0.05) from the resistant check is observed. RF, reproduction factor.