
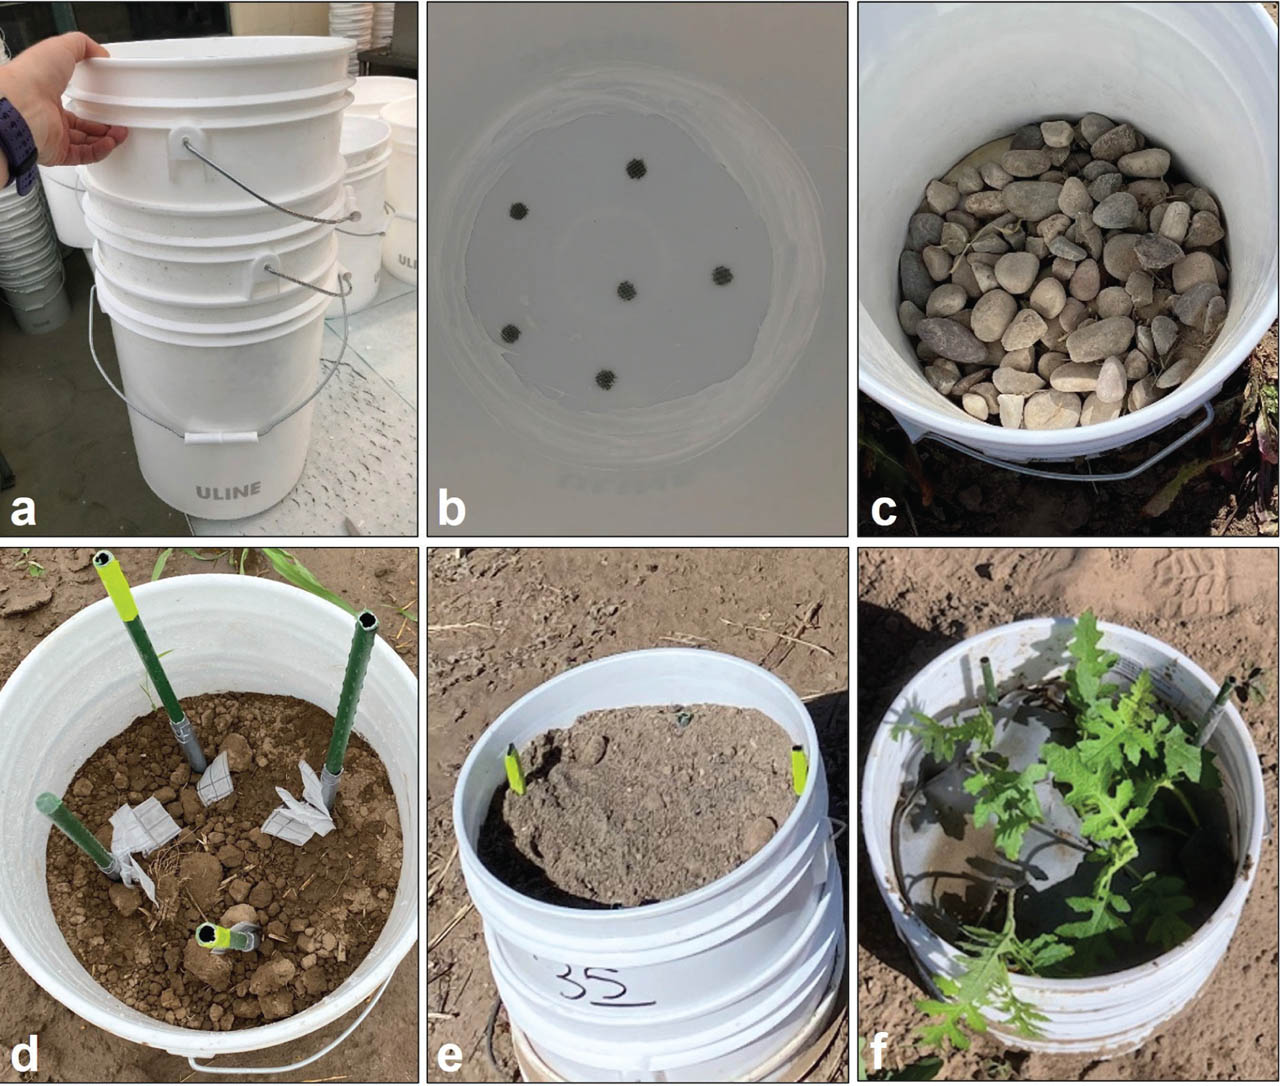
Figure 1:
Field microplot design for G. pallida containment. (A) Microplot design of three 19-l buckets consisting of an upper bucket, a middle half bucket, and a lower bucket. (B) The upper bucket had six 1-cm-diam holes drilled into the bottom for drainage, covered by 250-μm pore nylon mesh caulked into the bottom of the bucket with silicone. (C) The upper bucket of the microplot was filled with a layer of river rock approximately 7.6 cm in depth. (D) G. pallida cyst bags were attached to stakes placed in the microplots so that cyst bags would be in the anticipated root zone at a depth of approximately 15 cm below the soil surface. (E) Field soil was added to the upper bucket, approximately 25 cm in total depth. (F) The soil surface of the upper bucket covered with a layer of landscape fabric on top of a layer of 250-μm pore nylon mesh and 4-wk-old S. sisymbriifolium seedlings planted into the microplot.
Table 1:
Rotation sequences with corresponding abbreviations.
| Year 1 | Year 2 | Year 3 | Rotation sequence abbreviationa |
|---|---|---|---|
| ‘Innovator’ resistant potato | ‘Innovator’ resistant potato | ‘Russet Burbank’ susceptible potato | INN-INN-RB |
| ‘Innovator’ resistant potato | S. sisymbriifolium | ‘Russet Burbank’ susceptible potato | INN-S. sisym.-RB |
| ‘Innovator’ resistant potato | Barley (non-host) | ‘Russet Burbank’ susceptible potato | INN-Barley-RB |
| S. sisymbriifolium | ‘Innovator’ resistant potato | ‘Russet Burbank’ susceptible potato | S. sisym.-INN-RB |
| S. sisymbriifolium | S. sisymbriifolium | ‘Russet Burbank’ susceptible potato | S. sisym.-S. sisym.-RB |
| S. sisymbriifolium | Barley (non-host) | ‘Russet Burbank’ susceptible potato | S. sisym.-Barley-RB |
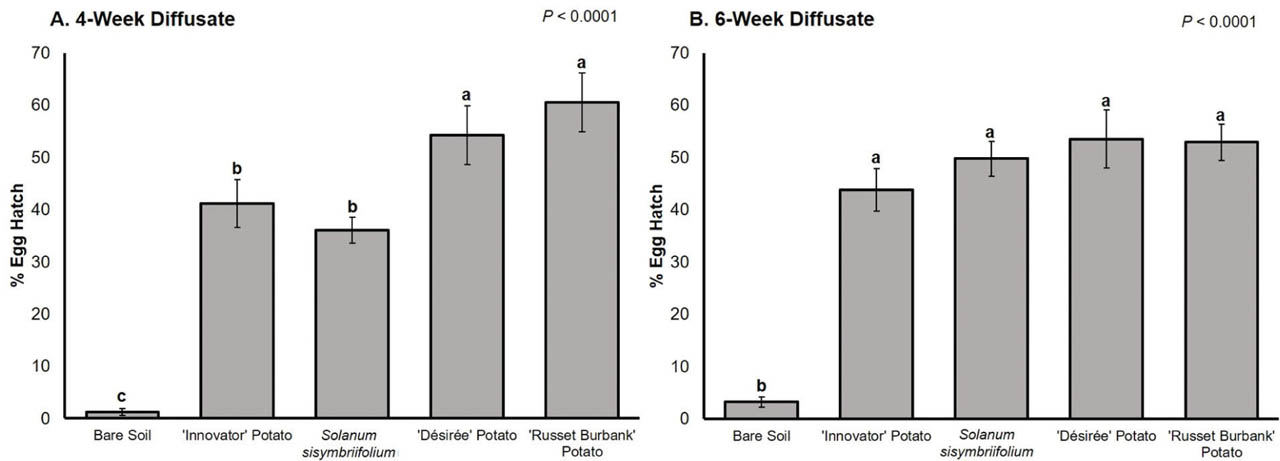
Figure 2:
Mean percentage G. pallida egg hatch 2 wk after root exudate application. (A) Percentage egg hatch for root exudates was collected at 4 wk of growth. (B) Percentage of egg hatch for root exudates were collected at 6 wk of growth. Standard error of the means is indicated by the bars. Different letters indicate significantly different means based on least squares means at α = 0.05.
Table 2:
Remaining G. pallida encysted egg densities, viability, and hatch at the end of the first year of rotation.a
| Year 1 treatment | Remaining encysted eggs per cyst | Remaining viable encysted eggs per cystb | Egg viability (%)b | Egg hatch in PRD (%)c |
|---|---|---|---|---|
| ‘Innovator’ resistant potato | 76.4 ± 5.5 | 63.8 ± 3.7 a | 88.5 ± 2.0 a | 4.2 ± 0.6 |
| S. sisymbriifolium | 73.0 ± 5.1 | 39.3 ± 2.5 b | 58.4 ± 3.6 b | 5.4 ± 0.7 |
a Data presented are means of two trials with 15 replicates per trial. Numbers following means are standard error. Significant differences are denoted by different letters in the columns based on least squares means at α = 0.05.
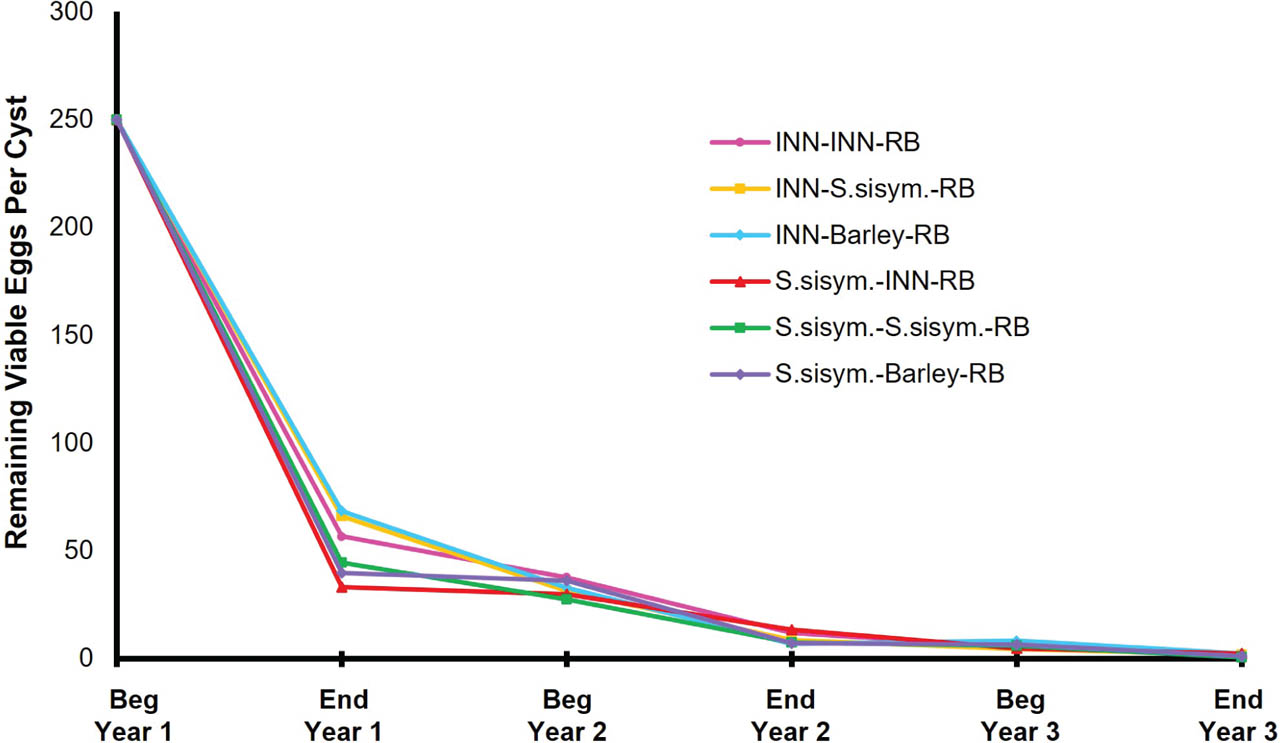
Figure 3:
Remaining viable G. pallida encysted eggs per cyst of the initial G. pallida population over the 3-yr rotation. The initial G. pallida population at the beginning of year 1 in rotation started with an average of 250 eggs/cyst and an initial infestation rate of 7.5 eggs/g soil. INN, Innovator; RB, russet Burbank; S. sisym., S. sisymbriifolium.
Table 3:
Globodera pallida progeny cysts, final population (Pf), and RF over a 3-yr rotation.a
| Rotation sequenceb | End year 1 | End year 2 | End year 3 | ||||||
|---|---|---|---|---|---|---|---|---|---|
| Progeny cystsc | Pf (eggs/g soil)d | RF (Pf/Pi)e | Progeny cysts | Pf (eggs/g soil) | RF (Pf/Pi) | Progeny cysts | Pf (eggs/g soil) | RF (Pf/Pi) | |
| INN-INN-RB | 0.1 ± 0.1 | 1.28 ± 0.07 a | 0.26 ± 0.02 a | 1.0 ± 0.2 a | 0.36 ± 0.08 a | 0.07 ± 0.02 a | 0.5 ± 0.1 a | 0.06 ± 0.01 ab | 0.011 ± 0.002 ab |
| INN-S. sisym.-RB | 0.1 ± 0.1 | 1.28 ± 0.07 a | 0.26 ± 0.02 a | 0.1 ± 0.1 b | 0.17 ± 0.06 b | 0.04 ± 0.01 b | 0.2 ± 0.1 bc | 0.04 ± 0.01 abc | 0.008 ± 0.002 abc |
| INN-Barley-RB | 0.1 ± 0.1 | 1.28 ± 0.07 a | 0.26 ± 0.02 a | 0.3 ± 0.2 b | 0.16 ± 0 b | 0.03 ± 0.01 b | 0.4 ± 0.1 b | 0.07 ± 0.02 a | 0.013 ± 0.004 a |
| S. sisym.-INN-RB | 0 | 0.79 ± 0.05 b | 0.16 ± 0.01 b | 0 b | 0.27 ± 0.07 ab | 0.05 ± 0.01 ab | 0.1 ± 0 bc | 0.06 ± 0.01 ab | 0.010 ± 0.002 ab |
| S. sisym.-S. sisym.-RB | 0 | 0.79 ± 0.05 b | 0.16 ± 0.01 b | 0 b | 0.15 ± 0.04 b | 0.03 ± 0.01 b | 0 c | 0.02 ± 0.01 c | 0.003 ± 0.001 c |
| S. sisym.-Barley-RB | 0 | 0.79 ± 0.05 b | 0.16 ± 0.01 b | 0 b | 0.14 ± 0.04 b | 0.03 ± 0.01 b | 0.2 ± 0.1 b | 0.04 ± 0.01 bc | 0.007 ± 0.003 bc |
a Data presented are means of two trials with five replicates per trial. Numbers following means are standard error. Significant differences are denoted by different letters in the columns based on least squares means at α = 0.05.
b In the rotation sequences, the susceptible potato ‘Russet Burbank’ is abbreviated as ‘RB’, the resistant potato ‘Innovator’ is abbreviated as ‘INN’, and Solanum sisymbriifolium is abbreviated as ‘S. sisym.’. The sequence is given as Year 1-Year 2-Year 3.