
Figure 1:
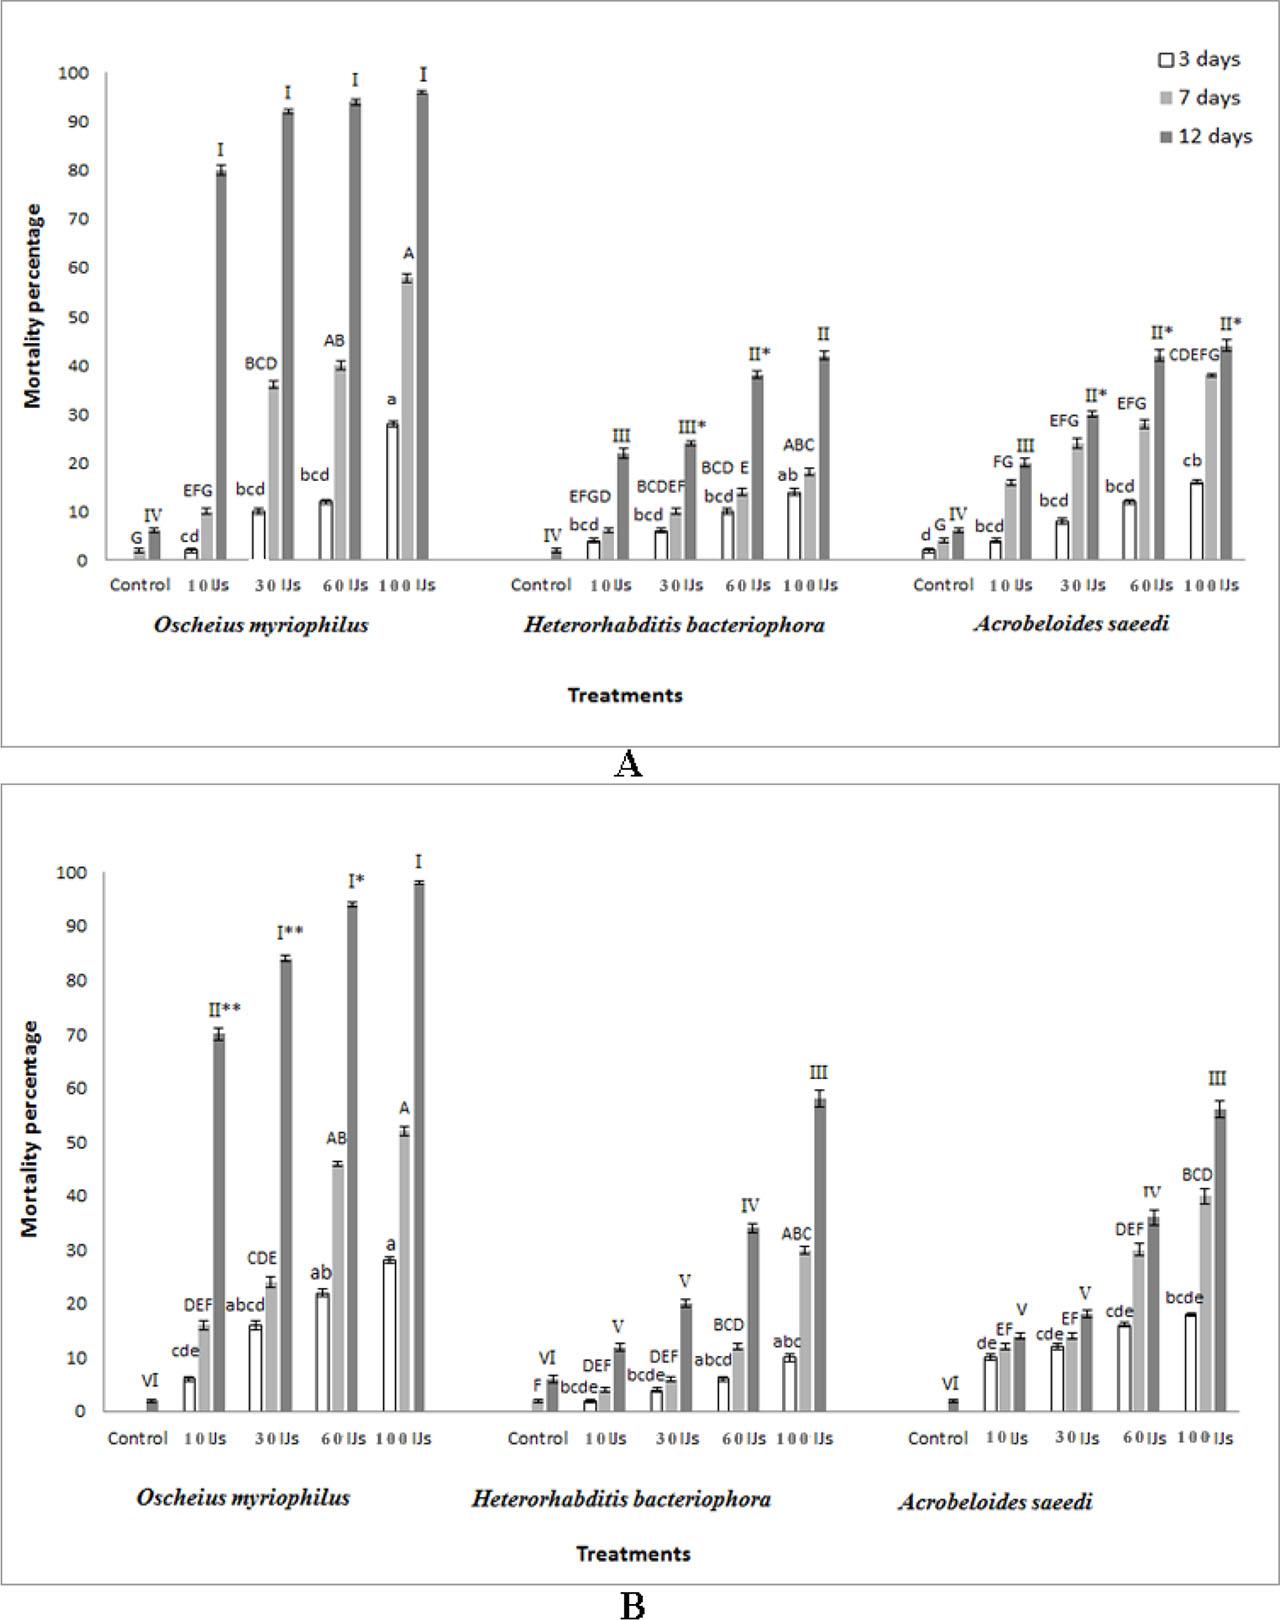
Figure 2:
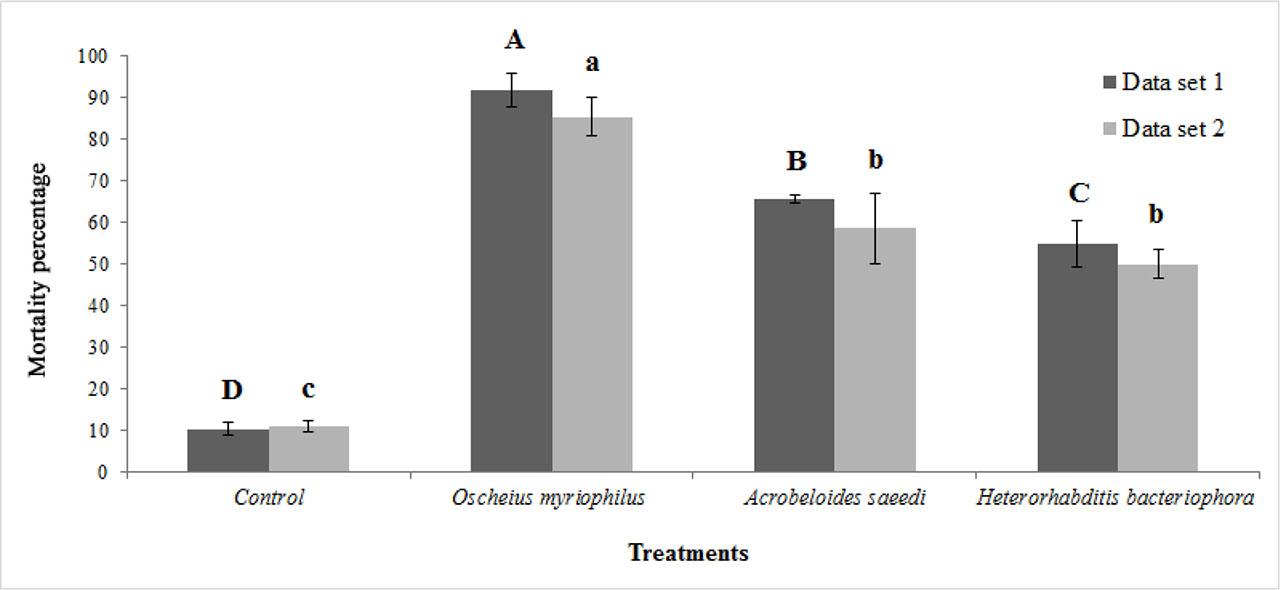
Figure 3:
LC50 and LC90 values of two Iraqi free-living, and one EPN species Oscheius myriophilus, Acrobeloides saeedi and Heterorhabditis bacteriophora on the third instar larvae of Bactrocera zonata at 12 days post treatment in laboratory bioassay
| Nematode species | P-value | Slope±SE | X2 (df=3) | Intercept±SE | LC50 | LC90 | |
|---|---|---|---|---|---|---|---|
| Oscheius myriophilus | Data set 1 | 0.000 | 0.00±0.00 | 154.37 | −0.21±0.09 | 7.08 (−8.20–18.16) | 49.25 (41.05–57.31) |
| Data set 2 | 0.000 | 0.00±0.00 | 136.24 | −0.50±0.09 | 13.50 (−43.01–24.17) | 47.62 (23.15–68.56) | |
| Acrobeloides saeedi | Data set 1 | 0.000 | 0.00±0.00 | 18.24 | −1.14±0.10 | 104.49 (79.93–167.21) | 221.41 (160.42–415.21) |
| Data set 2 | 0.000 | 0.00±0.00 | 1.01 | −0.50±0.09 | 86.04 (76.25–99.44) | 165.16 (143.35–198.35) | |
| Heterorhabditis bacteriophora | Data set 1 | 0.000 | 0.00±0.00 | 13.46 | −1.03±0.09 | 97.74 (87.02–112.50) | 218.52 (185.33–263.13) |
| Data set 2 | 0.000 | 0.00±0.00 | 6.93 | −1.45±0.11 | 86.67 (66.03–134.60) | 162.81 (121.22–289.18) |
Analysis of variance results of two Iraqi free-living and one EPN species – Oscheius myriophilus, Acrobeloides saeedi and Heterorhabditis bacteriophora – on the last-instar larvae of Bactrocera zonata after exposure to a dose of 1,000 IJs/larva, 19 days post-treatment, in a greenhouse trial, in soil substrate_
| Source | df | Sum of squares | Mean square | F value | Pr>F | |
|---|---|---|---|---|---|---|
| Data set 1 | Model | 12 | 19282.74 | 1606.89 | 28.75 | <0.0001 |
| Error | 27 | 1509.15 | 55.89 | - | - | |
| Corrected total | 39 | 20791.89 | - | - | - | |
| Treatments (Nematode species) | 3 | 18361.48 | 6120.49 | 109.50 | <0.0001 | |
| Block | 9 | 921.26 | 102.36 | 1.83 | 0.10 | |
| Data set 2 | Model | 12 | 17330.06 | 1444.17 | 14.86 | <0.0001 |
| Error | 27 | 2624.65 | - | - | - | |
| Corrected total | 39 | 19954.72 | - | - | - | |
| Treatments (Nematode species) | 3 | 16985.17 | 5661.72 | 58.24 | <0.0001 | |
| Block | 9 | 344.89 | 38.32 | 0.39 | 0.92 | |
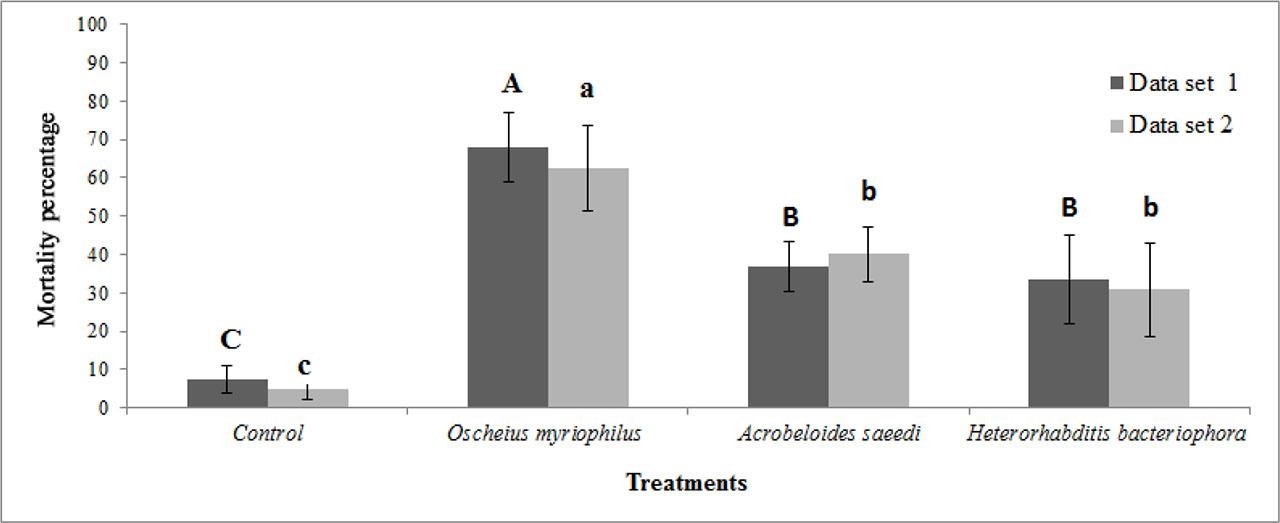
Analysis of variance results for effects of two Iraqi free-living and one EPN species – Oscheius myriophilus, Acrobeloides saeedi and Heterorhabditis bacteriophora – on the last-instar larvae of Bactrocera zonata after exposure to a dose of 250 IJs/larva, 19 days post-treatment, in a greenhouse trial in fruit_
| Source | df | Sum of squares | Mean square | F value | Pr>F | |
|---|---|---|---|---|---|---|
| Data set 1 | Model | 7 | 17319.07 | 2474.15 | 158.26 | <0.0001 |
| Error | 12 | 187.59 | 15.63 | - | - | |
| Corrected total | 19 | 17506.67 | - | - | - | |
| Treatments (Nematode species) | 3 | 17304.72 | 5768.24 | 368.97 | <0.0001 | |
| Block | 4 | 14.34 | 3.58 | 0.23 | 0.91 | |
| Data set 2 | Model | 7 | 14279.14 | 2039.87 | 67.57 | <0.0001 |
| Error | 12 | 362.25 | 30.18 | - | - | |
| Corrected total | 19 | 14641.40 | - | - | - | |
| Treatments (Nematode species) | 3 | 14210.85 | 4736.95 | 156.92 | <0.0001 | |
| Block | 4 | 68.29 | 17.07 | 0.57 | 0.69 | |
Analysis of variance between two Iraqi free-living and one EPN species – Oscheius myriophilus, Acrobeloides saeedi and Heterorhabditis bacteriophora – treatment effects on the third-instar larvae of Bactrocera zonata after exposure to dosages 0, 10, 30, 60 and 100 IJs/larva in three, seven and 12-day post-treatment intervals under laboratory bioassays_
| Source | df | Sum of squares | Mean square | F value | Pr>F | |
|---|---|---|---|---|---|---|
| Data set 1 | Model | 44 | 719.44 | 16.35 | 40.50 | <0.0001 |
| Error | 405 | 163.50 | 0.40 | - | - | |
| Corrected total | 449 | 882.94 | - | - | - | |
| Nematode species | 2 | 115.43 | 57.71 | 142.97 | <0.0001 | |
| Concentration | 4 | 181.71 | 45.42 | 112.53 | <0.0001 | |
| Time | 2 | 223.68 | 111.84 | 277.04 | <0.0001 | |
| Nematode species × Concentration | 8 | 32.43 | 4.05 | 10.04 | <0.0001 | |
| Nematode species × Time | 4 | 91.40 | 22.85 | 56.61 | <0.0001 | |
| Concentration × Time | 8 | 47.51 | 5.93 | 14.71 | <0.0001 | |
| Nematode species × Concentration × Time | 16 | 27.25 | 1.70 | 4.22 | <0.0001 | |
| Data set 2 | Model | 44 | 711.49 | 16.17 | 31.75 | <0.0001 |
| Error | 405 | 206.30 | 0.50 | - | - | |
| Corrected total | 449 | 917.79 | - | - | - | |
| Nematode species | 2 | 115.27 | 57.63 | 113.15 | <0.0001 | |
| Concentration | 4 | 231.18 | 57.79 | 113.46 | <0.0001 | |
| Time | 2 | 180.56 | 90.28 | 177.24 | <0.0001 | |
| Nematode species × Concentration | 8 | 36.37 | 4.54 | 8.93 | <0.0001 | |
| Nematode species × Time | 4 | 70.26 | 17.56 | 34.48 | <0.0001 | |
| Concentration× Time | 8 | 52.14 | 6.51 | 12.80 | <0.0001 | |
| Nematode species × Concentration× Time | 16 | 25.69 | 1.60 | 3.15 | <0.0001 | |