
Table 1:
Sampling information of Mononchid populations used in this study.
| Species | Habitat | Sampling locality |
|---|---|---|
| M. brachyuris | Grass land soil | Linzhi, Tibetan |
| C. parvus | Moss soil | Zhouzhi, Shaanxi |
| Miconchus sp. | Moss soil | Nanjing, Jiangsu |
| Prionchulus sp. | Populus sp. rhizosphere | Qiqihar, Heilongjiang |
| M. brevicaudatus | Moss soil | Zhouzhi, Shaanxi |
| M. hawaiiensis | Moss soil | Nanjing, Jiangsu |
| M. sigmaturellus | Digitaria sp. rhizosphere | Nanyang, Henan |
| M. vulvapapillatus | Moss soil | Hulun Buir, Inner Mongolia |
| Mylonchulus sp. | Populus sp. rhizosphere | Qiqihar, Heilongjiang |
| Anatonchus sp. | Moss soil | Zhouzhi, Shaanxi |
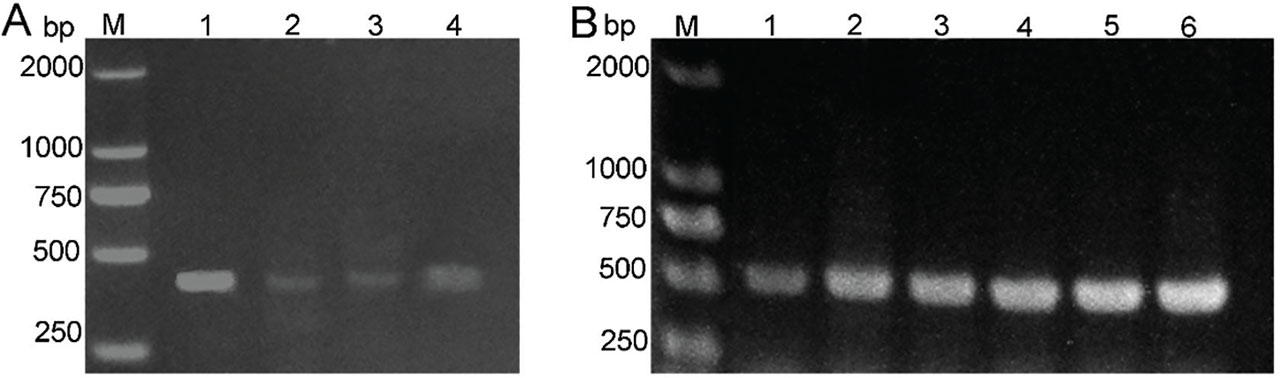
Figure 1:
Detection of amplification fragments of rDNA 18S from 10 Mononchid species. A: Amplification with primer pair TAReuk454FWD1/TAReukREV3, lines 1–4 are M. brachyuris, C. parvus, Miconchus sp., and Prionchulus sp. respectively; B: Amplification with primer pair EUK20f/EUK302r+3, lines 1–6 are M. brevicaudatus, M. hawaiiensis, M. sigmaturellus, M. vulvapapillatus, Mylonchulus sp. and Anatonchus sp. respectively. M: DNA marker DL2000.
Table 2:
Primer pair used, generated reads, and ASVs per mononchid sample.
| Species | Reads | ASVs | Primer used | ||
|---|---|---|---|---|---|
| Kingdom | Phylum | Order | |||
| M. brachyuris | 43 | 43 | 43 | 2 | TAR |
| C. parvus | 42 | 42 | 36 | 3 | TAR |
| Miconchus sp. | 2317 | 2315 | 2315 | 6 | TAR |
| Prionchulus sp. | 214 | 214 | 211 | 3 | TAR |
| M. brevicaudatus | 5983 | 5983 | 3618 | 7 | EUK |
| M. hawaiiensis | 43008 | 42672 | 40617 | 34 | EUK |
| M. sigmaturellus | 31737 | 30422 | 28781 | 89 | EUK |
| M. vulvapapillatus | 3944 | 3944 | 3929 | 13 | EUK |
| Mylonchulus sp. | 34869 | 34863 | 34864 | 15 | EUK |
| Anatonchus sp. | 35140 | 35140 | 34959 | 30 | EUK |
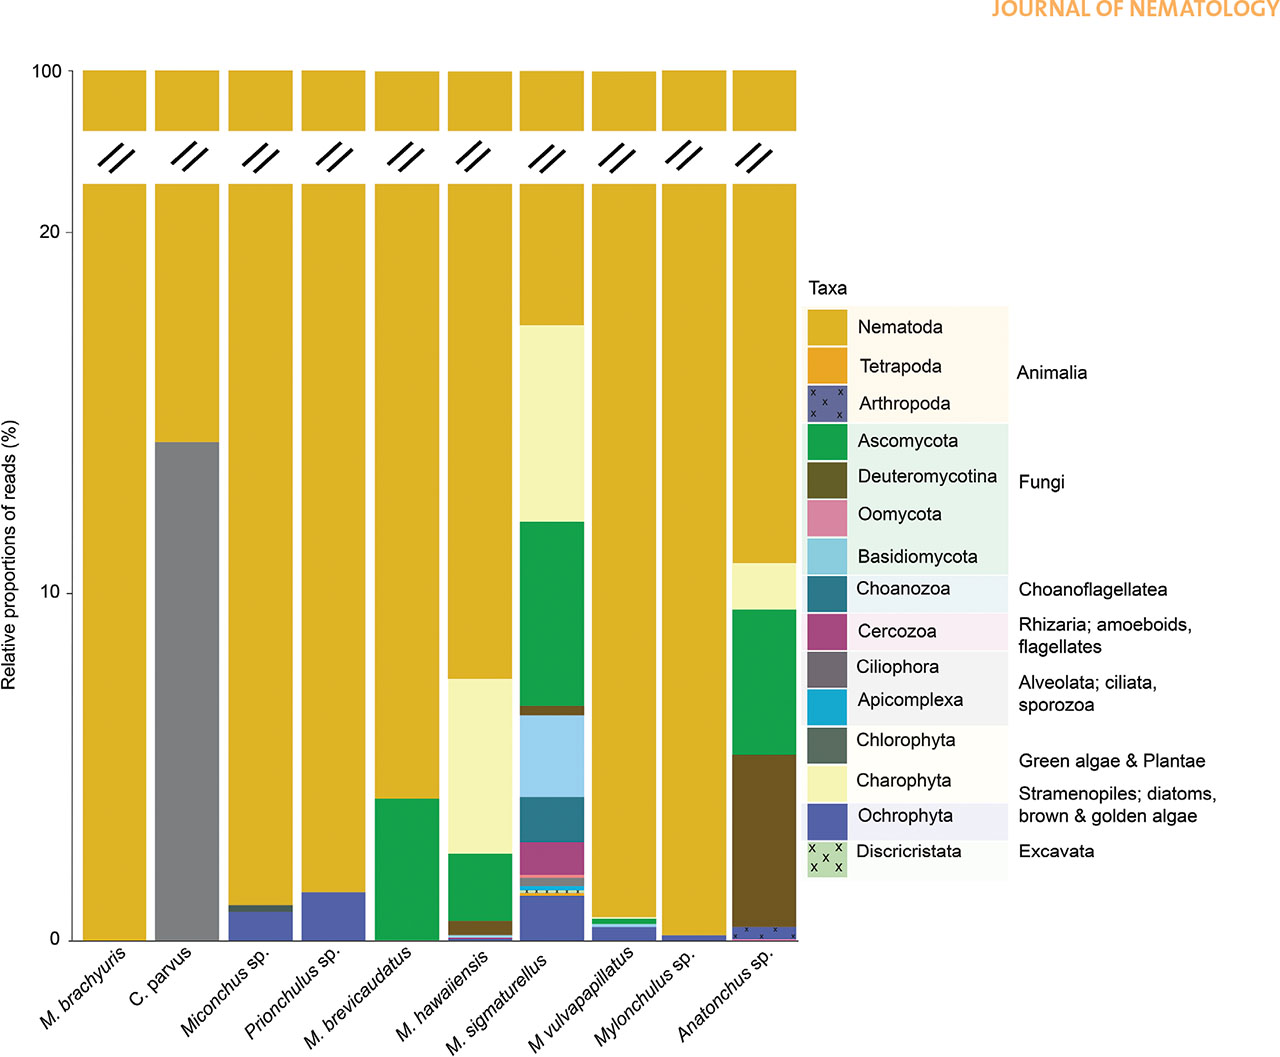
Figure 2:
Diversity of eukaryotic organisms presented in 10 mononchid species at phylum level. The classification system is based on the eukaryote classification system of Adl et al., (2012).
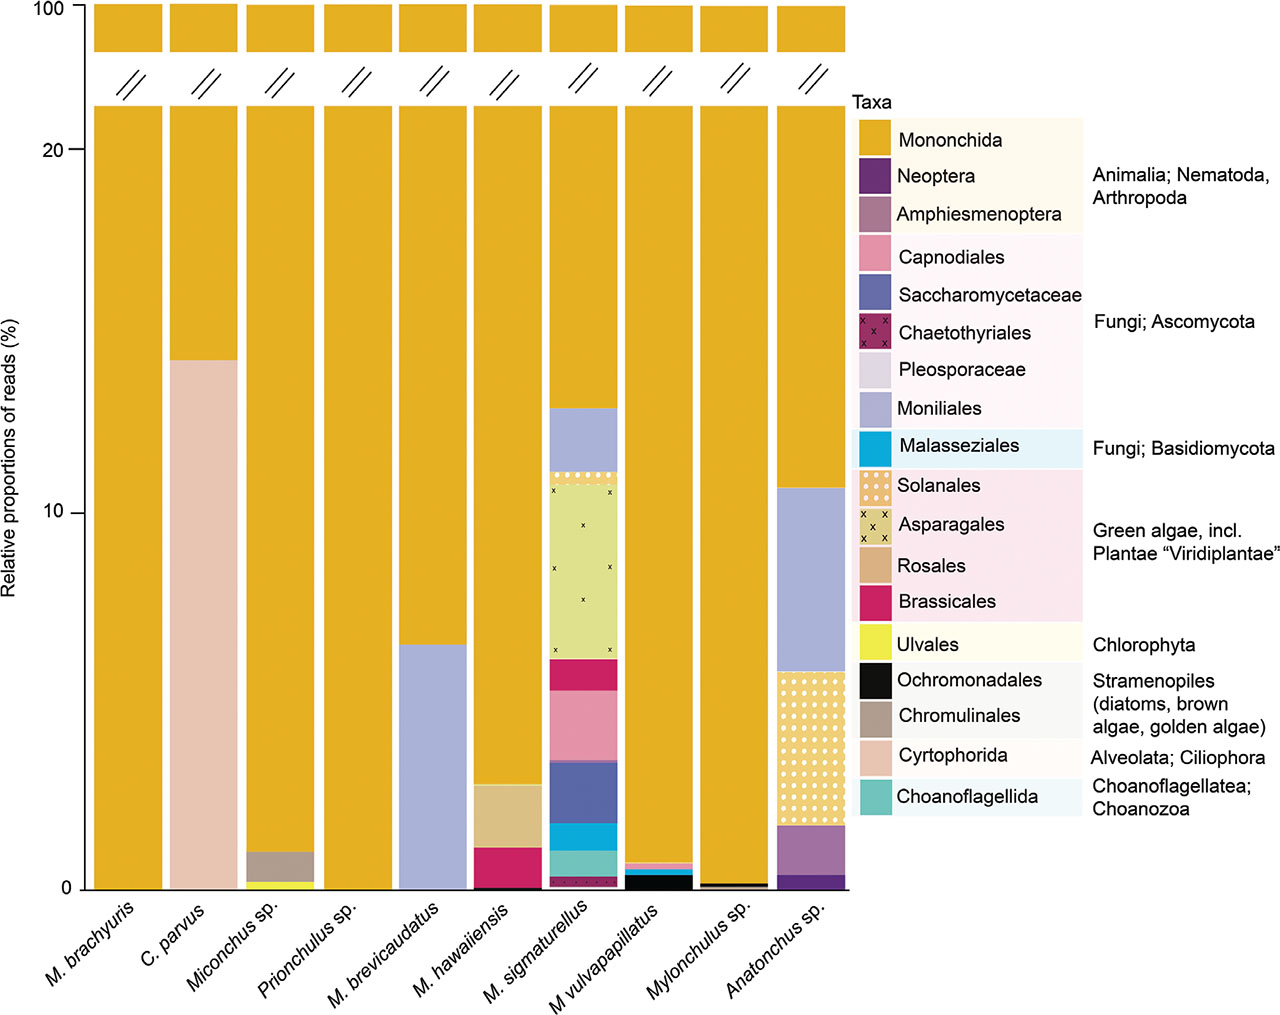
Figure 3:
Diversity of eukaryotic organisms presented in 10 mononchid species at order level. The classification system is based on the eukaryote classification system of Adl et al., (2012).
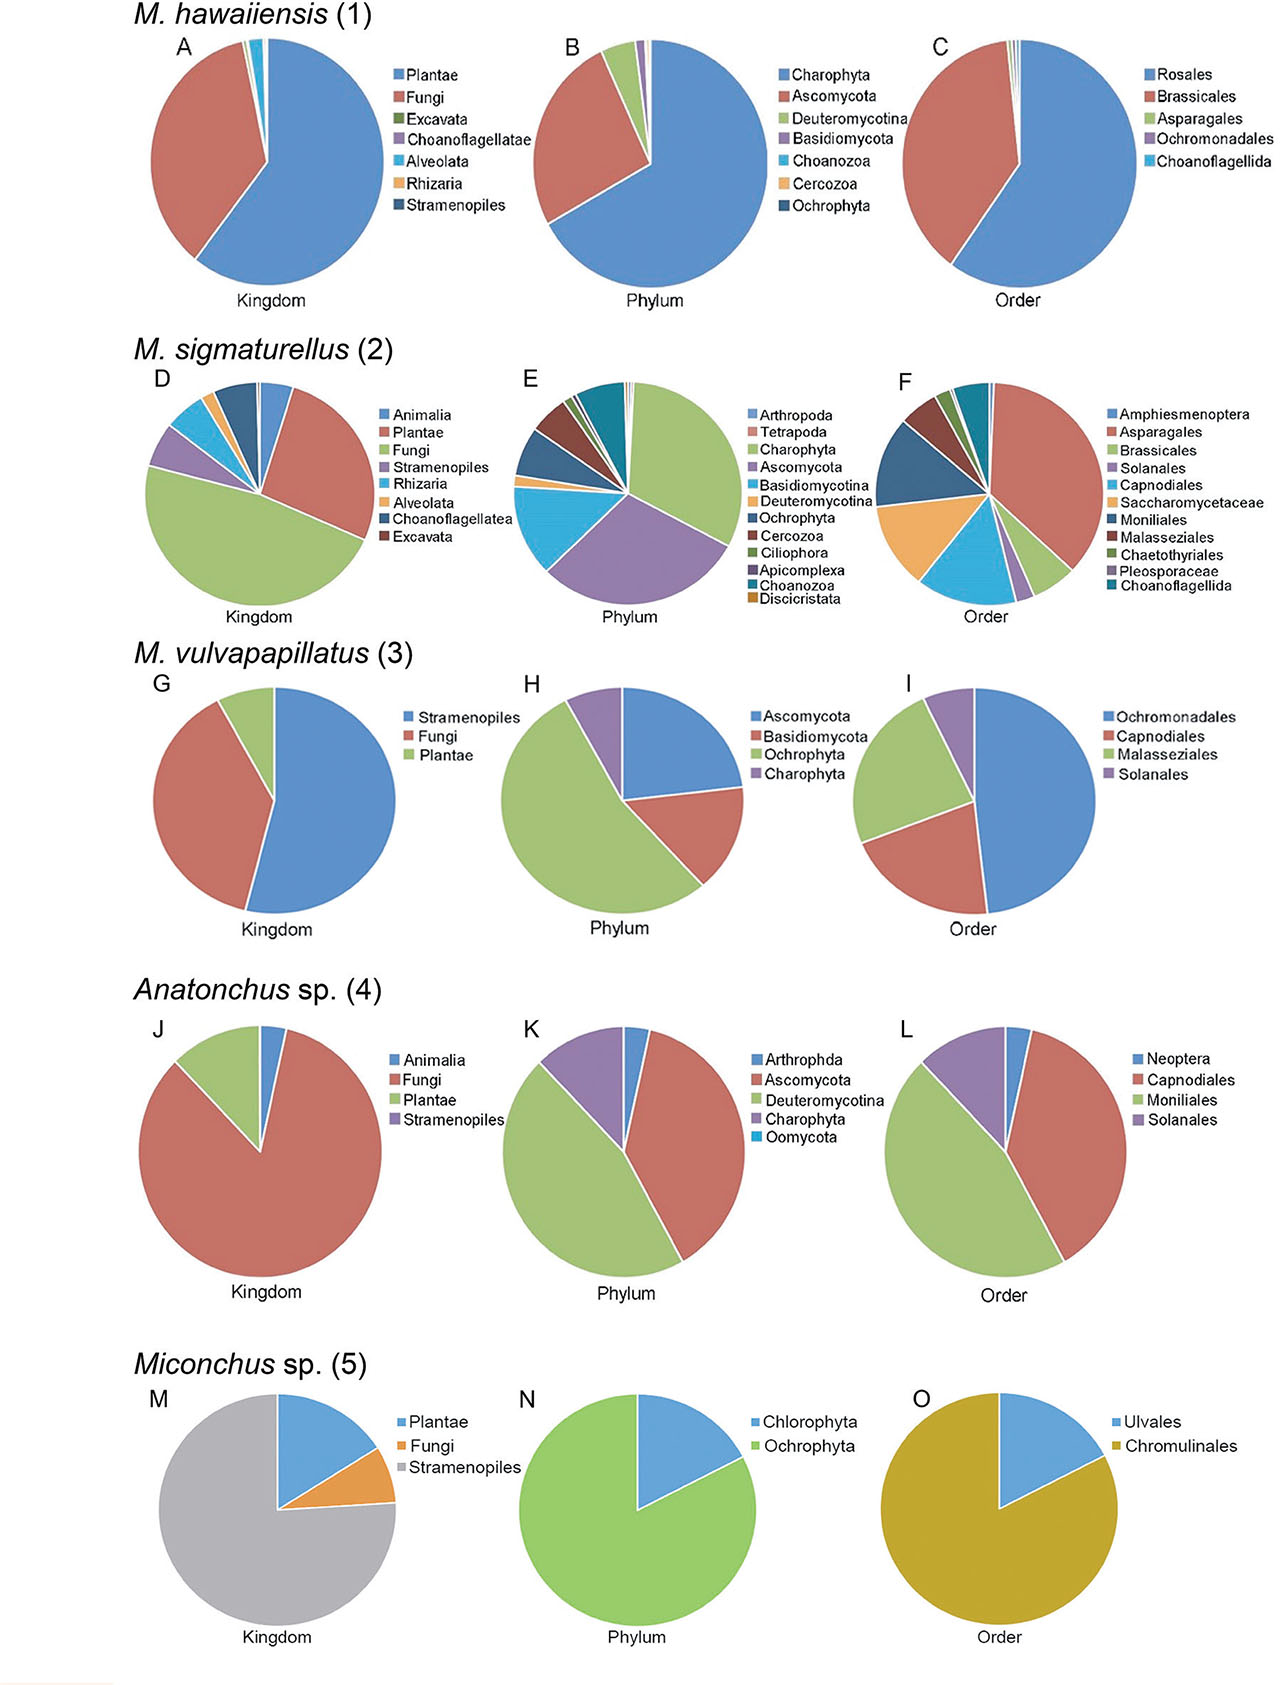
Figure S1:
Relative abundance of eukaryotic organisms presented in 10 mononchid species at different taxon levels. The percentages of each of the phyla or orders are calculated over the total number of reads excluding the nematode reads.