
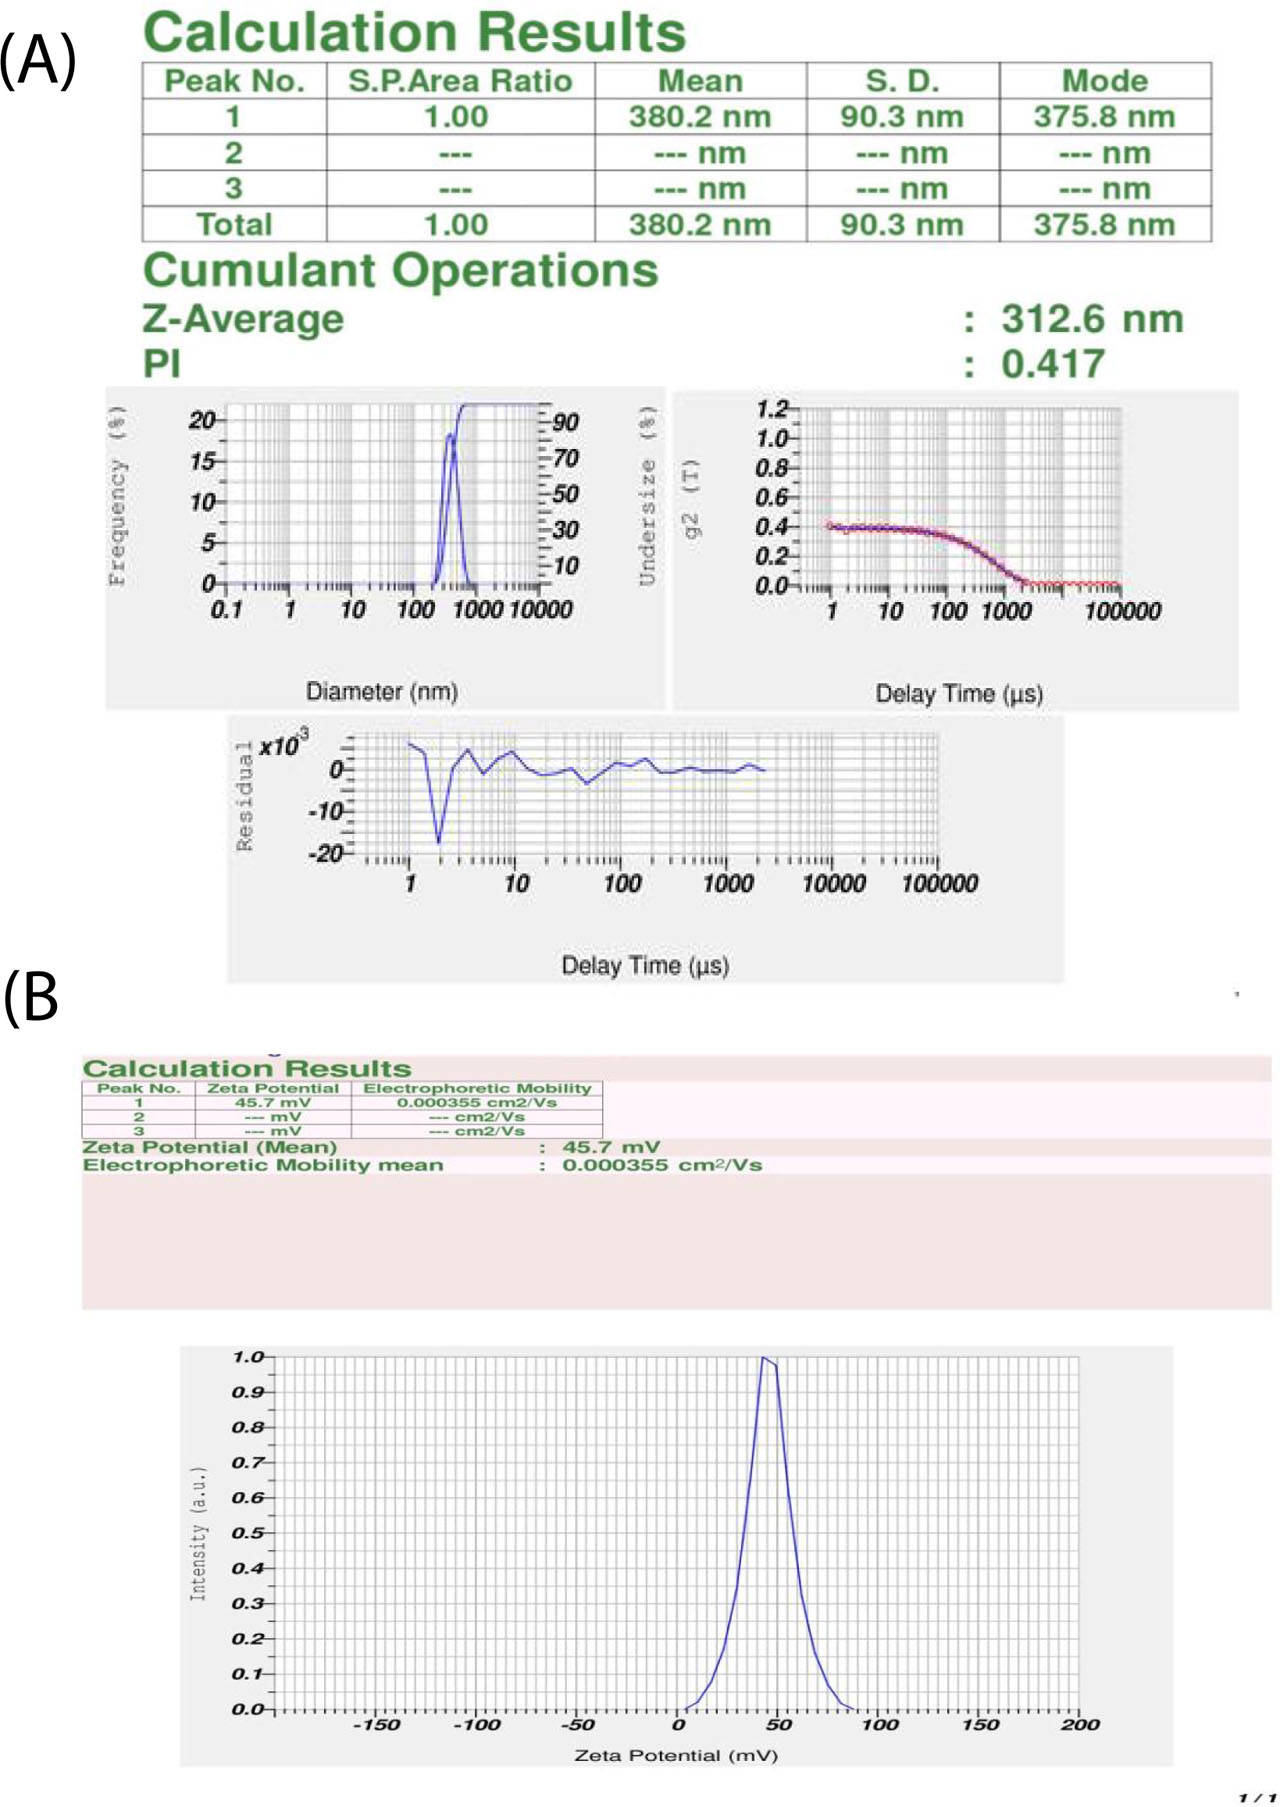
Figure 1:
(A) Particle size of chitosan nanospheres. (B) Zeta potential of chitosan nanospheres.
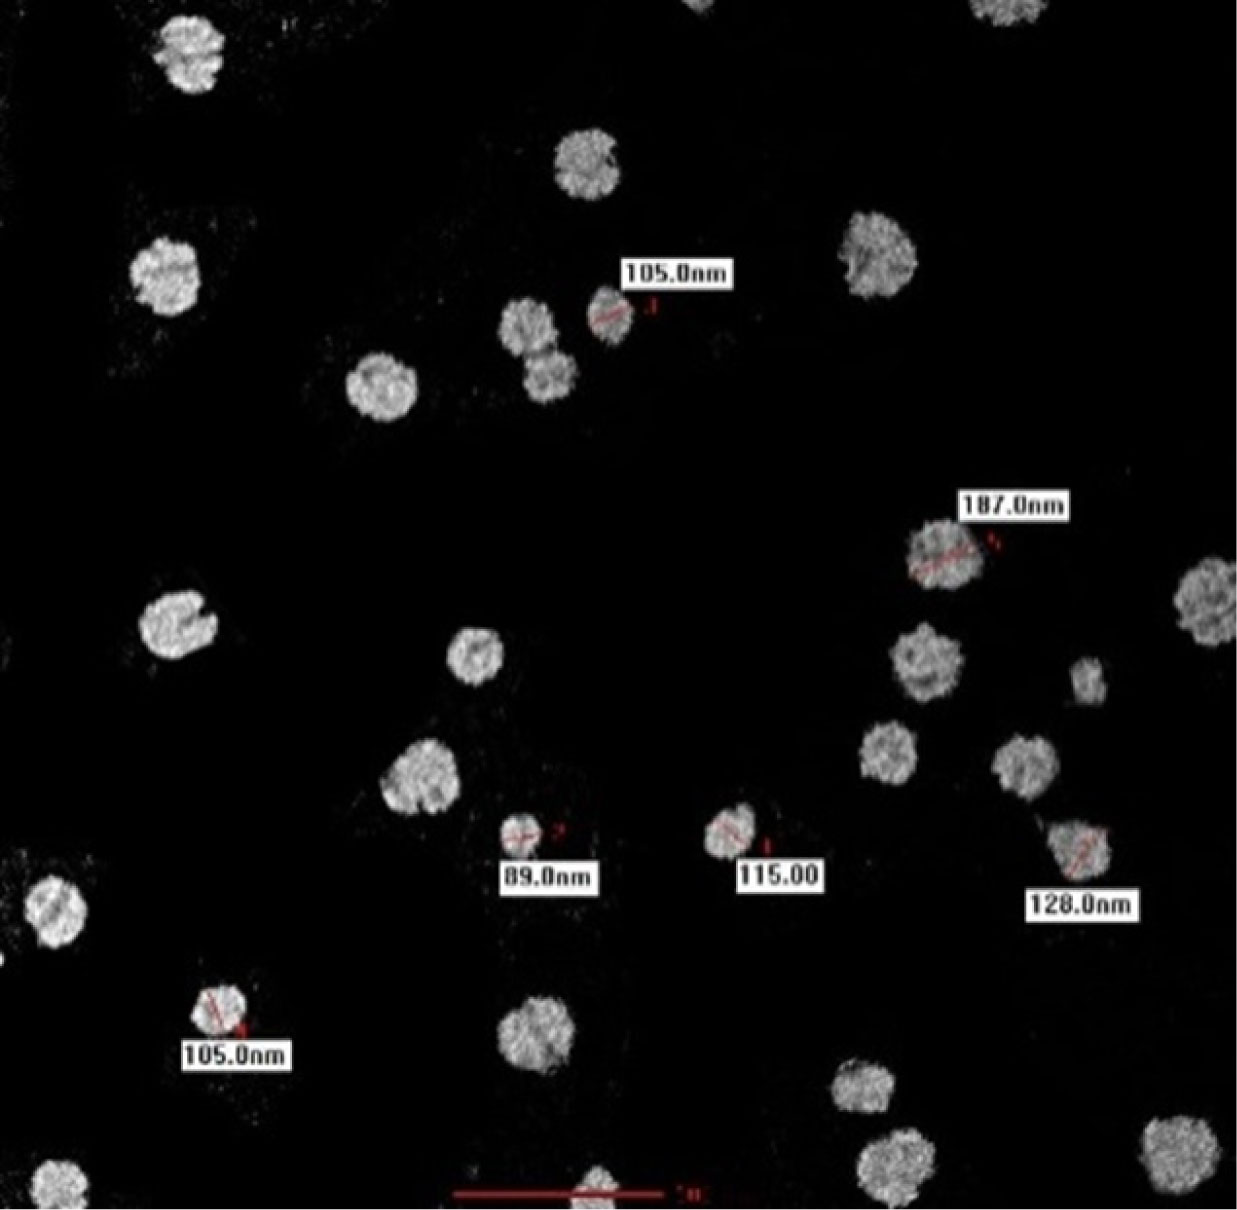
Figure 2:
Transmission Electron Microscope (TEM) micrograph of chitosan nanospheres.
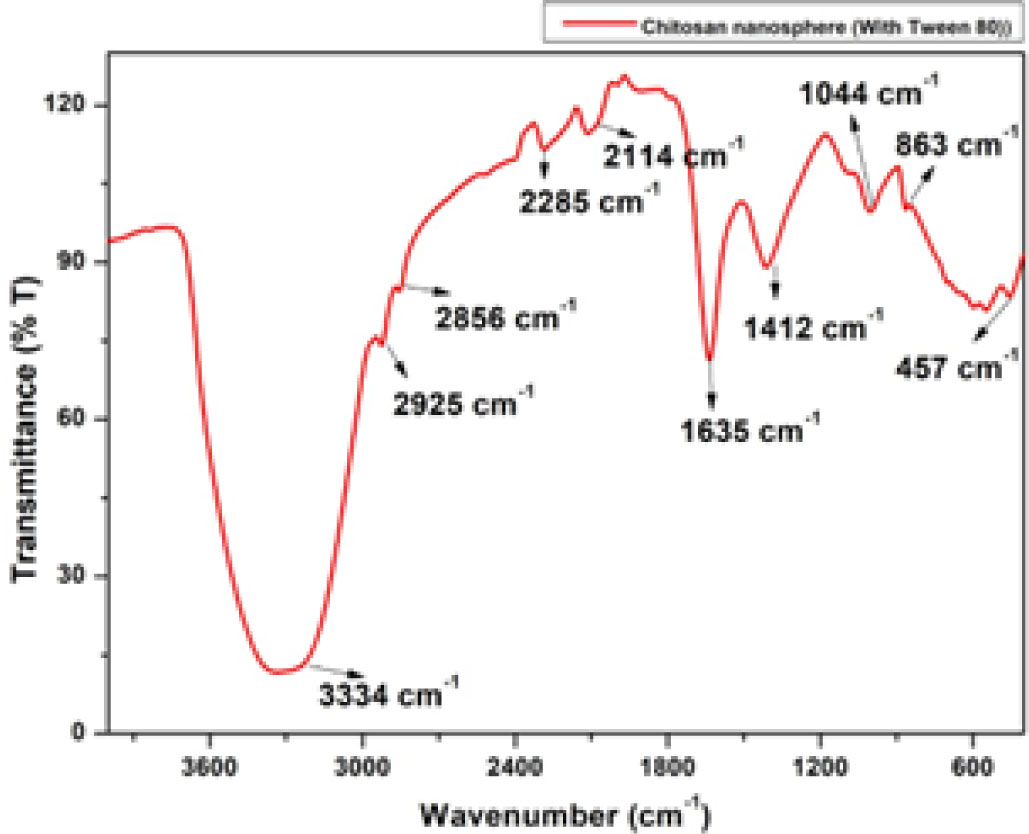
Figure 3:
FT-IR spectroscopy of 1% chitosan nanospheres formulation.
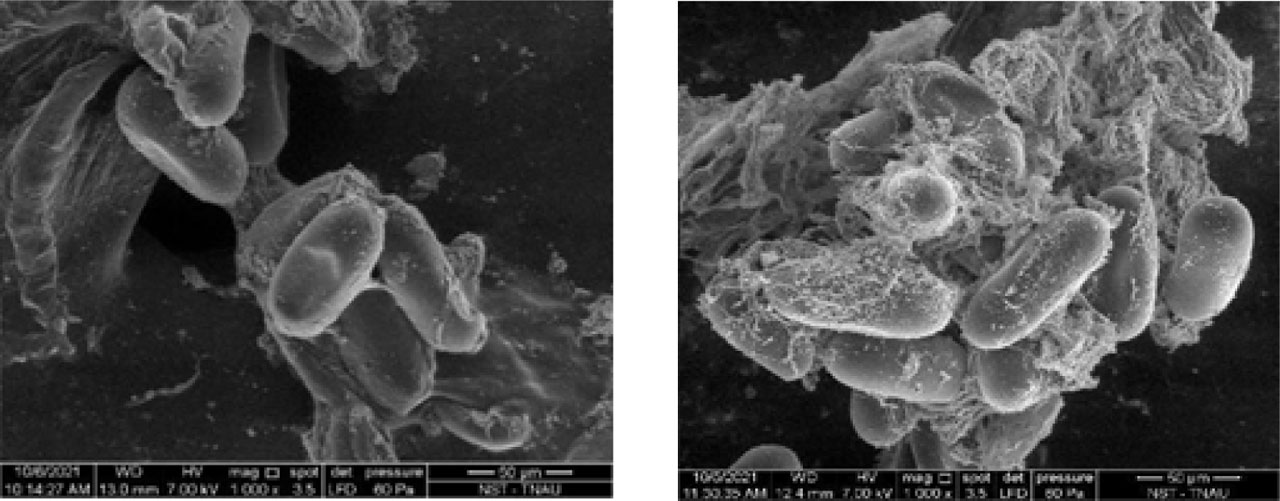
Figure 4:
Scanning Electron Microscope images of chitosan nanospheres treated eggs (left side) and chitosan nanospheres untreated eggs (right side).
Table 1.
Effect of chitosan nanospheres on the egg hatching of M. incognita
| Treatments | Number of hatched juveniles (Mean of four replications) | ||
|---|---|---|---|
| 24 h | 48 h | 72 h | |
| Mean and transformed value | Mean and transformed value | Mean and transformed value | |
| Chitosan nanospheres at 100 ppm | 12.50b (3.31) | 16.50b (4.84) | 41.50b (6.29) |
| Chitosan nanospheres at 500 ppm | 10.50b (3.09) | 14.16b (3.61) | 26.50b (4.79) |
| Chitosan nanospheres at 1000 ppm | 0.00a (0.70) | 0.00a (0.70) | 0.00a (0.70) |
| Chitosan nanospheres at 5000 ppm | 0.00a (0.70) | 0.00a (0.70) | 0.00a (0.70) |
| Control- tap water | 38.83c (6.21) | 61.66c (7.85) | 84.80c (17.27) |
| SEd | 0.72 | 0.46 | 1.12 |
| CD (p=0.01%) | 2.29 | 1.48 | 3.88 |
Table 2.
Effect of chitosan nanospheres on M. incognita juvenile mortality
| Treatments | Juvenile mortality in percentage (Mean of four replications) | ||
|---|---|---|---|
| 24 h | 48 h | 72 h | |
| Chitosan nanospheres at 100 ppm | 13.00b (5.40) | 21.5c (3.47) | 26.5c (5.10) |
| Chitosan nanospheres at 500 ppm | 27.25 b (5.14) | 31.25b (5.67) | 28.25c (5.26) |
| Chitosan nanospheres at 1000 ppm | 29.00 b (5.85) | 36.00b (5.96) | 46.25b (6.70) |
| Chitosan nanospheres at 5000 ppm | 100.00a (10.02) | 10.00a (10.02) | 100.00a (10.02) |
| Control | 0.00c (0.707) | 0.00d (0.70) | 0.00d (0.70) |
| SEd | 1.52 | 0.72 | 0.55 |
| CD (p=0.01%) | 4.48 | 2.14 | 1.64 |
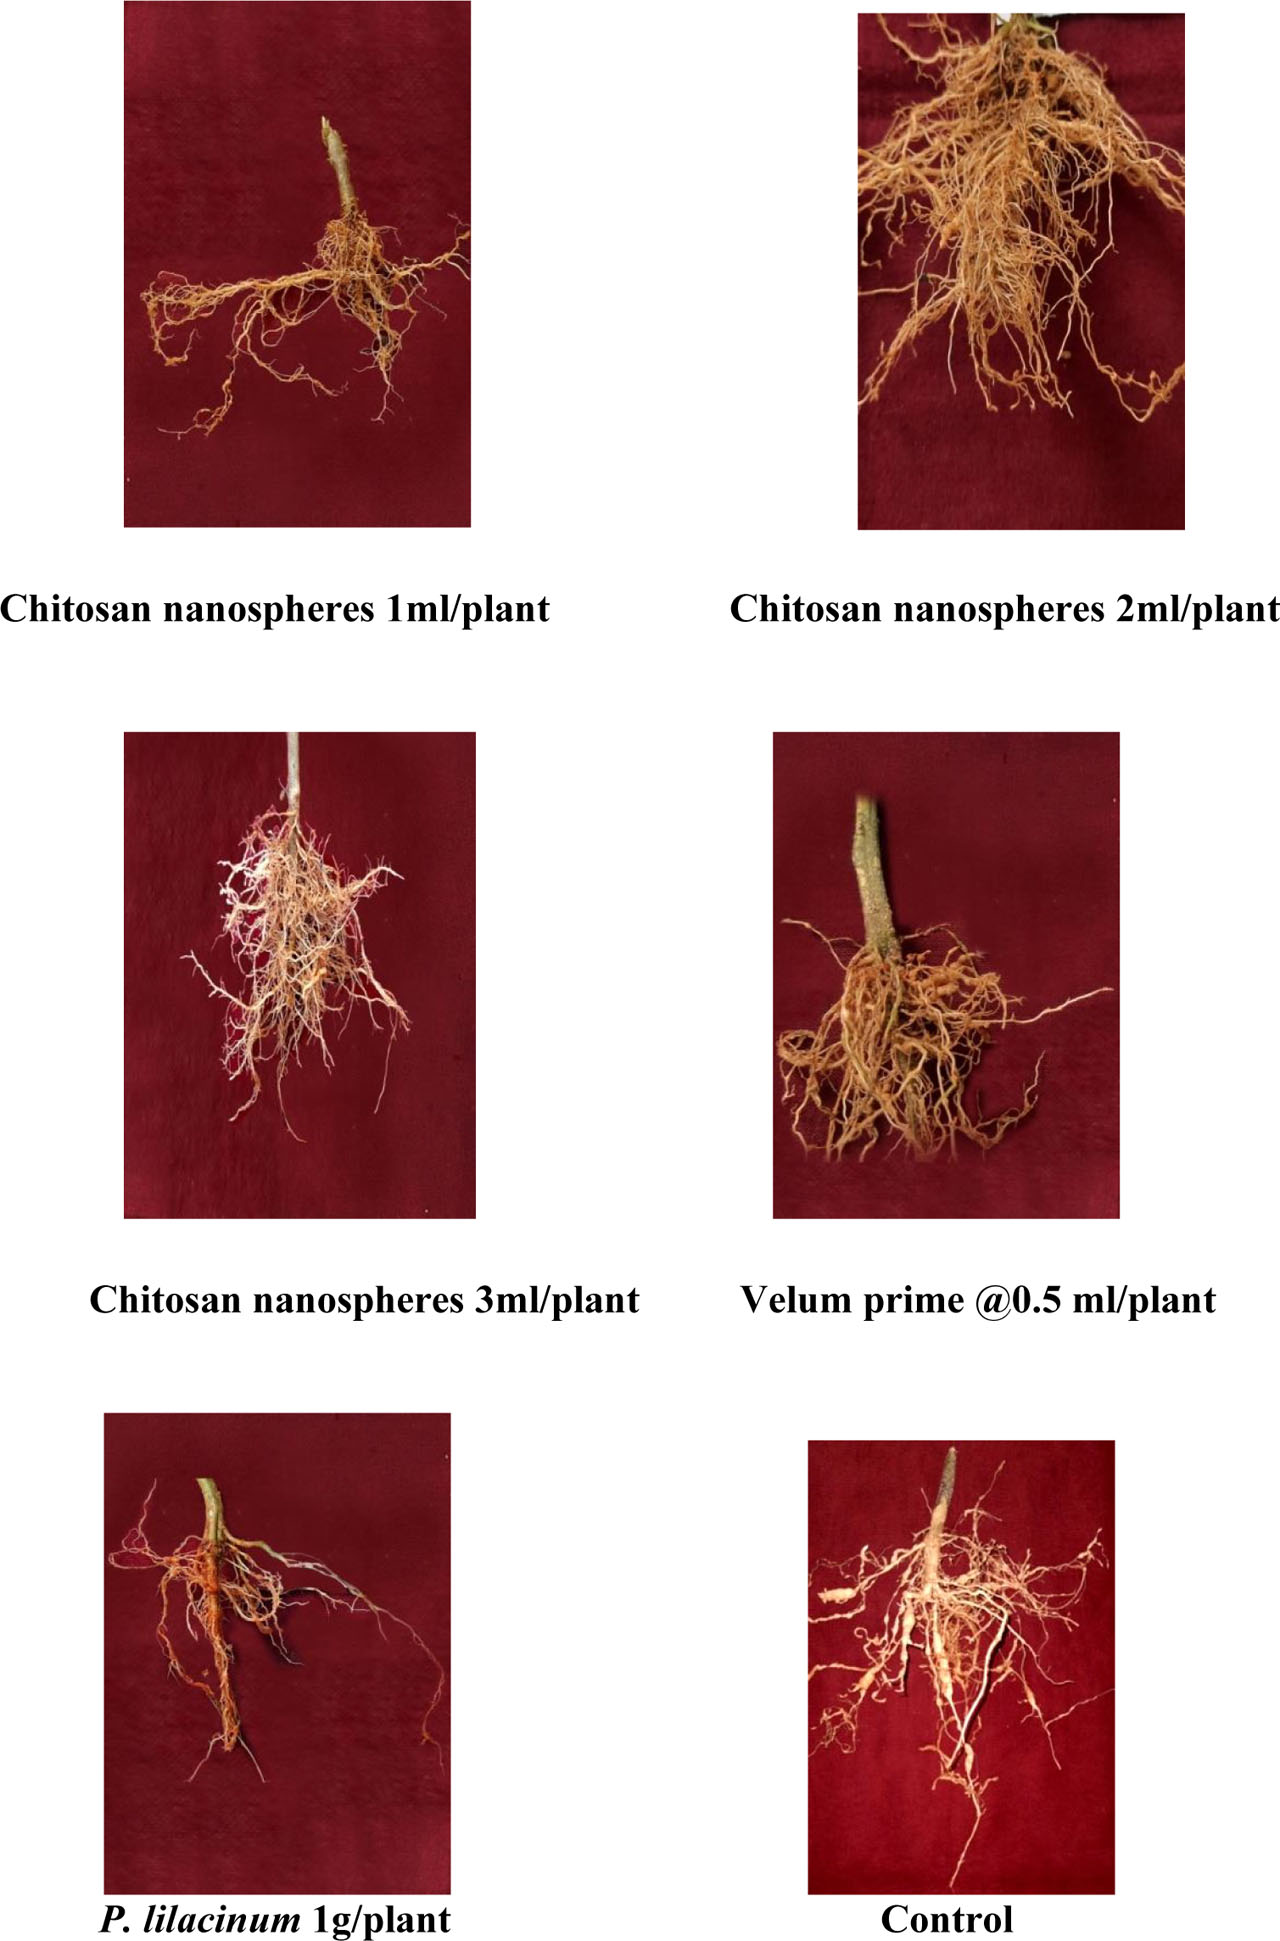
Figure 5:
Efficacy of different doses of chitosan nanospheres (1%) on M. incognita under pot culture conditions.
Table 3.
Effect chitosan nanospheres against root knot nematode, M. incognita under pot culture conditions
| Treatments | Mean of three replications | |||
|---|---|---|---|---|
| Number of galls/5g of roots | Number of egg masses/5g of roots | Number of females/5g of roots | Number of J2/100 cc of soil | |
| Mean and transformed value | Mean and transformed value | Mean and transformed value | Mean and transformed value | |
| Chitosan nanospheres 1ml/plant+ M. incognita | 13.30a (3.51) | 11.67bcd (3.32) | 17.67cd (4.25) | 48.60bc (12.06) |
| Chitosan nanospheres 2ml/plant+ M. incognita | 10.00a (3.12) | 6.00b (2.53) | 14.60b (3.87) | 28.30ab (5.36) |
| Chitosan nanospheres 3ml/plant+ M. incognita | 15.00a (3.87) | 7.33bc (2.73) | 17.60cd (4.25) | 40.30bc (6.38) |
| Chitosan 1ml/plant+ M. incognita | 18.00a (4.28) | 19.00c (4.41) | 22.30f (4.76) | 62.00bcd (7.90) |
| Chitosan 2ml/plant + M. incognita | 17.00a (4.25) | 10.00bcd (3.22) | 16.67c (4.13) | 46.70bc (6.86) |
| Chitosan 3ml/plant + M. incognita | 17.60a (3.34) | 10.66bcd (3.30) | 17.90d (4.19) | 44.70bc (6.66) |
| Velum prime 0.5ml/plant + M. incognita | 25.67a (4.87) | 15.67de (3.95) | 19.30e (4.44) | 32.67bc (5.75) |
| P. lilacinum 1g/plant+M. incognita | 17.67a (4.25) | 13.39cde (1.37) | 18.67e (4.44) | 50.60bc (7.14) |
| Chitosan nanospheres without nematode Inoculums | 0.00a (0.70) | 0.00a (0.70) | 0.00a (0.70) | 0.00a (0.70) |
| Untreated control | 61.30c (7.83) | 37.16f (6.04) | 43.67g (6.63) | 105.60cd (10.21) |
| SEd | 0.96 | 0.47 | 0.06 | 2.26 |
| CD (p=0.01%) | 2.73 | 1.36 | 0.18 | 6.44 |
Table 4.
Effect of chitosan nanospheres against root knot nematode, M. incognita under field conditions
| Treatments | Mean of three replications | |||||
|---|---|---|---|---|---|---|
| Number of galls/5g of roots1 | Number of egg masses/5g of roots1 | Number of females/5g of roots1 | Number of J2/100 cc of soil1 | Fruit weight (kg)/plot2 | Fruit weight (tonne)/ha2 | |
| Mean and transformed value | Mean and transformed value | Mean and transformed value | Mean and transformed value | Mean and transformed value | ||
| Chitosan nanospheres (1%)-5ml/plant | 5.61ab (2.29) | 3.34b (1.82) | 18.31b (4.26) | 50.63c (7.11) | 95a (18.75) | 14.25 |
| Chitosan nanospheres (2%)-5ml/plant | 3.31a (1.81) | 0.99ab (1.14) | 17.38b (4.16) | 35.00b (5.90) | 89.5b (11.87) | 13.42 |
| Chitosan (1%) - 5ml/plant | 11.25b (3.10) | 3.62b (1.93) | 20.90b (4.54) | 58.54e (7.61) | 86bc (7.5) | 12.90 |
| Chitosan (2%)-5ml/plant | 4.91ab (2.30) | 1.88ab (1.52) | 17.79b (4.19) | 48.75b (6.92) | 83cd (3.75) | 12.45 |
| Velum prime 500ml/acre | 2.83a (1.60) | 0.09a (0.75) | 11.42a (3.35) | 30.45a (5.47) | 99a (23.75) | 14.85 |
| Carbofuran 3G- 1kg ai/ha | 7.32b (2.95) | 1.43ab (1.35) | 23.20b (4.78) | 54.23d (7.34) | 89b (11.25) | 13.35 |
| Untreated control | 44.00c (0.62) | 22.3c (4.77) | 57.25c (7.57) | 165.80f (12.73) | 80d | 12.00 |
| SEd | 0.46 | 0.37 | 0.37 | 0.10 | 2.28 | |
| CD (p=0.05%) | 1.00 | 0.80 | 0.80 | 0.22 | 4.90 | |