
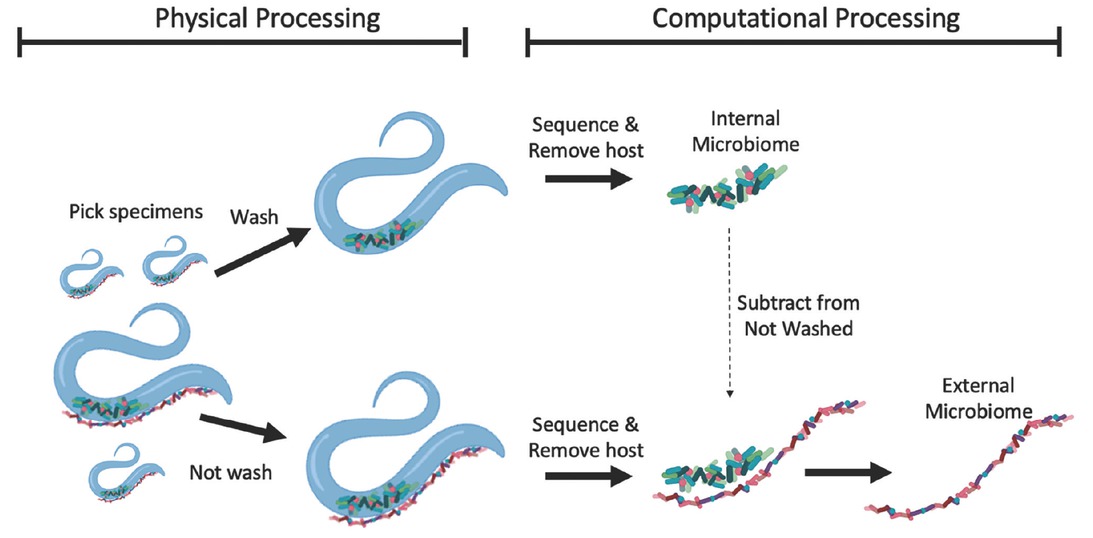
Figure 1
Graphical abstract of methods used to construct external and internal microbiomes of nematodes and tardigrades. For internal microbiomes, microinvertebrates were washed, sequenced, and host sequences subtracted before being averaged for each of the 24 mat replicates and 3 host types. For external microbiomes, unwashed microinvertebrates were sequenced, host sequences subtracted, and averaged for each of the 24 mat replicates and host types. The internal ASV abundances were then subtracted from the corresponding ASVs of unwashed community of the same mat replicate and microinvertebrate type to create the final external microbiome.
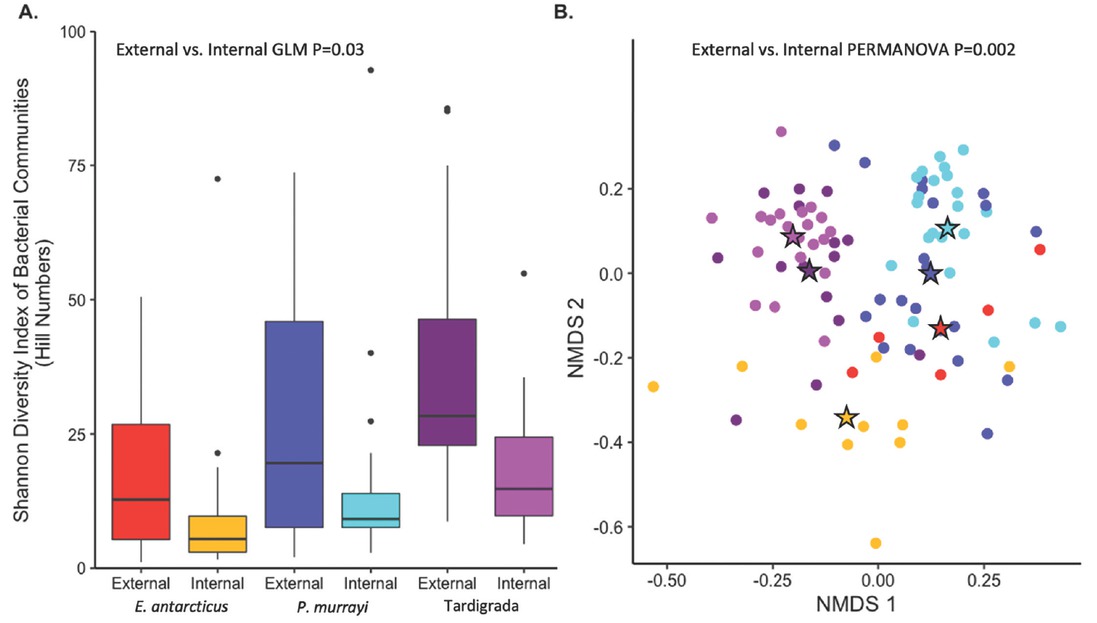
Figure 2
Diversity of microinvertebrate bacterial external and bacterial internal microbiomes. (A) Shannon’s diversity (box plot using Hill Numbers) with a significant difference between microbiomes (P=0.03, GLM) but not microinvertebrates (P=0.14), streams (P=0.22), or mat types (P=0.52). (B) Compositional difference based on Bray Curtis distance matrix visualized with a NMDS ordination, in which microinvertebrate host explained the most variation (R2 =0.14, PERMANOVA). Stars show centroid location of microbiome type, and solid circles show individual microbiomes.
Table 1
Differences in bacterial community composition of A. all microbiomes, B. external microbiomes, and C. internal microbiomes using a PERMANOVA.
| P | R2 | P | R2 | P | R2 | |
|---|---|---|---|---|---|---|
| Host | < 0.00 | 0.14 | < 0.00 | 0.08 | < 0.00 | 0.23 |
| Microbiome | < 0.00 | 0.02 | n.a. | n.a. | n.a. | n.a. |
| Mat | < 0.00 | 0.01 | 0.02 | 0.03 | 0.23 | 0.01 |
| Stream | < 0.00 | 0.06 | < 0.00 | 0.10 | < 0.00 | 0.07 |
| Host:Microbiome | < 0.00 | 0.03 | n.a. | n.a. | n.a. | n.a. |
| Host:Mat | 0.09 | 0.02 | 0.11 | 0.05 | 0.48 | 0.02 |
| Microbiome:Mat | 0.79 | < 0.00 | n.a. | n.a. | n.a. | n.a. |
| Host:Microbiome:Mat | 0.47 | 0.01 | n.a. | n.a. | n.a. | n.a. |
[i] Comparisons included microinvertebrate host (E. antarcticus or P. murrayi or tardigrades), microbiome type (external or internal), mat type (black or orange), stream (Canada or Bowles Creek or Delta or Von Guerard), and their interactions. The abbreviation “n.a.” is used to depict when a term was not included in the model. Factors explaining the largest variation (R2) of each model are underlined and statistically significant differences are highlighted in bold.
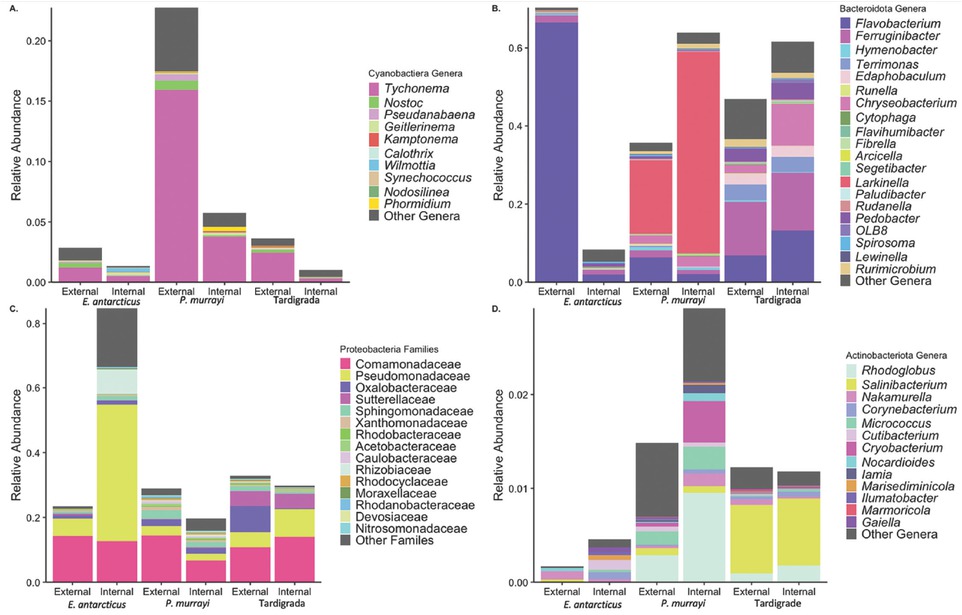
Figure 3
Relative abundance of bacterial communities of microinvertebrate external and internal microbiomes: (A) genera of Cyanobacteria, (B) genera of Bacteroidota, (C) families of Proteobacteria, (D) genera of Actinobacteriota.
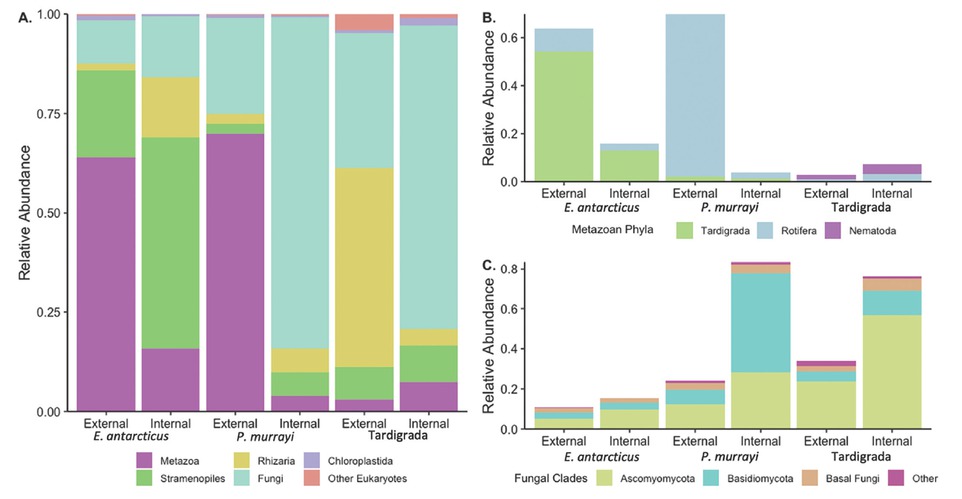
Figure 4
Relative abundance of eukaryotic communities of microinvertebrate external and internal microbiomes: (A) total non-host community (B) metazoan phyla, (C) fungal clades.
SI Table 1
A. Means and standard error of the mean (SE) of alpha diversity metrics (Shannon’s, Simpsons, Richness, Faith’s PD) for bacterial and eukaryotic mat communities. Alpha diversity metrics were calculated with Hill Numbers. B. Differences in alpha diversity comparing mats to host microinvertebrate microbiomes using a linear mixed model to test bacterial communities and then eukaryotic communities in a second linear mixed model.
| A. Mat Community | Shannon’s Index | Simpsons Index | Richness | Faith’s PD | ||||
|---|---|---|---|---|---|---|---|---|
| Mean | SE | Mean | SE | Mean | SE | Mean | SE | |
| Bacteria | 88.20 | 13.69 | 23.54 | 5.39 | 463.86 | 34.75 | 28.48 | 1.68 |
| Eukaryota | 8.72 | 1.80 | 4.29 | 0.73 | 73.67 | 8.73 | 13.51 | 0.86 |
| B. Mat vs. Hosts | Shannon’s Index | Simpsons Index | Richness | Faith’s PD | ||||
| F | P | F | P | F | P | F | P | |
| Bacteria | 44.02 | <0.01 | 9.16 | <0.01 | 25.81 | <0.01 | 56.38 | <0.01 |
| Eukaryota | 2.86 | 0.09 | 8.67 | <0.01 | 78.04 | <0.01 | 205.88 | <0.01 |
SI Table 2
Differences in A. bacterial and B. eukaryotic host microbiome alpha diversity (Shannon’s, Simpsons, Richness, Faith’s PD) using a linear mixed model. Comparisons included microinvertebrate host (E. antarcticus or P. murrayi or Tardigrada), microbiome type (external or internal), mat type (black or orange), stream (Canada or Bowles Creek or Delta or Von Guerard), and their interactions. Alpha diversity metrics were based on ASVs and calculated with Hill Numbers.
| A. Bacterial Diversity | Shannon’s Index | Simpsons Index | Richness | Faith’s PD | ||||
|---|---|---|---|---|---|---|---|---|
| F | P | F | P | F | P | F | P | |
| Host | 2.04 | 0.15 | 0.54 | 0.59 | 16.78 | <0.00 | 18.01 | <0.00 |
| Microbiome | 4.64 | 0.04 | 3.28 | 0.08 | 2.07 | 0.16 | 3.01 | 0.09 |
| Mat | 0.42 | 0.52 | 0.31 | 0.58 | 0.97 | 0.33 | 0.46 | 0.50 |
| Stream | 1.60 | 0.22 | 2.23 | 0.12 | 1.13 | 0.37 | 1.09 | 0.38 |
| Host:Microbiome | 0.34 | 0.71 | 0.2 | 0.82 | 0.45 | 0.64 | 0.28 | 0.75 |
| Host:Mat | 0.26 | 0.78 | 0.27 | 0.76 | 2.11 | 0.14 | 2.11 | 0.14 |
| Microbiome:Mat | 0.22 | 0.64 | 0.86 | 0.36 | 0.25 | 0.62 | 0.06 | 0.81 |
| Host:Microbiome:Mat | 1.02 | 0.37 | 0.27 | 0.77 | 0.41 | 0.66 | 0.4 | 0.67 |
| B. Eukaryotic Diversity | Shannon’s Index | Simpsons Index | Richness | Faith’s PD | ||||
| F | P | F | P | F | P | F | P | |
| Host | 2.52 | 0.10 | 3.52 | 0.04 | 2.70 | 0.08 | 3.88 | 0.03 |
| Microbiome | 1.18 | 0.28 | 1.09 | 0.30 | 0.33 | 0.57 | 0.59 | 0.45 |
| Mat | 0.21 | 0.65 | 0.35 | 0.56 | 0.11 | 0.75 | 0.27 | 0.61 |
| Stream | 3.34 | 0.04 | 2.77 | 0.07 | 1.73 | 0.20 | 1.23 | 0.33 |
| Host:Microbiome | 0.26 | 0.77 | 0.27 | 0.77 | 0.44 | 0.64 | 0.85 | 0.44 |
| Host:Mat | 0.03 | 0.97 | 0.07 | 0.93 | 0.22 | 0.80 | 0.61 | 0.55 |
| Microbiome:Mat | 1.26 | 0.27 | 0.75 | 0.39 | 0.84 | 0.37 | 0.69 | 0.41 |
| Host:Microbiome:Mat | 0.00 | 1.00 | 0.33 | 0.72 | 0.65 | 0.53 | 0.53 | 0.60 |
SI Table 3
Means and standard error of the mean (SE) of alpha diversity metrics (Shannon’s, Simpsons, Richness, Faith’s PD) for A. bacterial and B. eukaryotic external and internal microbiomes of three hosts (E. antarcticus or P. murrayi or Tardigrada). Alpha diversity metrics were calculated with Hill Numbers.
| A. Bacterial Diversity | Shannon’s Index | Simpsons Index | Richness | Faith’s PD | |||||
|---|---|---|---|---|---|---|---|---|---|
| Mean | SE | Mean | SE | Mean | SE | Mean | SE | ||
| E. antarcticus | External | 18.60 | 7.69 | 10.36 | 4.38 | 43.5 | 16.08 | 5.20 | 1.37 |
| Internal | 12.46 | 5.76 | 8.35 | 3.83 | 24.92 | 9.51 | 3.47 | 0.99 | |
| P. murrayi | External | 35.86 | 7.63 | 16.23 | 4.32 | 161.14 | 26.84 | 12.24 | 1.40 |
| Internal | 22.25 | 7.38 | 9.21 | 2.71 | 114.09 | 25.58 | 9.75 | 1.39 | |
| Tardigrada | External | 43.64 | 8.14 | 16.21 | 3.21 | 446.20 | 85.27 | 21.52 | 2.96 |
| Internal | 22.64 | 4.96 | 8.99 | 1.70 | 297.30 | 56.03 | 15.84 | 2.12 | |
| B. Eukaryotic Diversity | Shannon’s Index | Simpsons Index | Richness | Faith’s PD | |||||
| Mean | SE | Mean | SE | Mean | SE | Mean | SE | ||
| E. antarcticus | External | 6.07 | 1.25 | 3.34 | 0.77 | 26.75 | 6.70 | 5.06 | 0.84 |
| Internal | 6.92 | 1.22 | 3.97 | 0.73 | 21.29 | 4.47 | 3.67 | 0.60 | |
| P. murrayi | External | 11.18 | 1.57 | 8.82 | 1.40 | 16.80 | 2.91 | 3.17 | 0.46 |
| Internal | 13.34 | 1.65 | 10.76 | 1.36 | 18.77 | 2.33 | 3.53 | 0.31 | |
| Tardigrada | External | 17.51 | 4.62 | 13.08 | 3.81 | 34.33 | 7.12 | 5.41 | 0.83 |
| Internal | 18.82 | 3.81 | 14.67 | 2.75 | 26.29 | 5.80 | 4.67 | 0.78 | |
SI Table 4
Differences in eukaryotic community composition of A. all microbiomes, B. external microbiomes, and C. internal microbiomes using a PERMANOVA. Comparisons included microinvertebrate host (E. antarcticus or P. murrayi or Tardigrada), microbiome type (external or internal), mat type (black or orange), stream (Canada or Bowles Creek or Delta or Von Guerard), and their interactions. The abbreviation “n.a.” is used to depict when a term was not included in the model.
| A. External and Internal Microbiomes | B. External Microbiomes | C. Internal Microbiomes | ||||
|---|---|---|---|---|---|---|
| P | R2 | P | R2 | P | R2 | |
| Host | <0.00 | 0.05 | <0.00 | 0.09 | <0.00 | 0.09 |
| Microbiome | <0.00 | 0.02 | n.a. | n.a. | n.a. | n.a. |
| Mat | 0.53 | <0.00 | 0.04 | 0.03 | 0.34 | 0.02 |
| Stream | 0.09 | 0.03 | <0.00 | 0.09 | 0.11 | 0.06 |
| Host:Microbiome | <0.00 | 0.03 | n.a. | n.a. | n.a. | n.a. |
| Host:Mat | 0.67 | 0.02 | 0.01 | 0.06 | 0.13 | 0.04 |
| Microbiome Type:Mat | 0.04 | 0.01 | n.a. | n.a. | n.a. | n.a. |
| Host:Microbiome Type:Mat | <0.00 | 0.02 | n.a. | n.a. | n.a. | n.a. |
SI Table 5
Differences in relative abundance of selected taxa (Cyanobacteria, Bacteroidota, Proteobacteria, Actinobacteriota, Flavobacterium, Larkinella, Fungi, and Metazoa) using a linear mixed model. Comparisons included microinvertebrate host (E. antarcticus or P. murrayi or Tardigrada), microbiome type (external or internal), mat type (black or orange), stream (Canada or Bowles Creek or Delta or Von Guerard), and their interactions.
| Cyanobacteria | Bacteroidota | Proteobacteria | Actinobacteriota | |||||
|---|---|---|---|---|---|---|---|---|
| F | P | F | P | F | P | F | P | |
| Host | 3.85 | 0.03 | 9.06 | <0.00 | 13.71 | <0.00 | 5.17 | 0.01 |
| Microbiome | 6.84 | 0.01 | 0.76 | 0.39 | 2.38 | 0.13 | 0.36 | 0.55 |
| Mat | 0.02 | 0.88 | 1.13 | 0.30 | 1.21 | 0.28 | 0.62 | 0.44 |
| Stream | 4.92 | 0.01 | 2.74 | 0.07 | 0.28 | 0.84 | 3.24 | 0.05 |
| Host: Microbiome | 1.85 | 0.17 | 4.87 | 0.01 | 3.98 | 0.03 | 0.23 | 0.80 |
| Host:Mat | 3.09 | 0.06 | 1.88 | 0.17 | 3.26 | 0.05 | 0.15 | 0.86 |
| Microbiome:Mat | 0.75 | 0.39 | 0.00 | 0.97 | <0.00 | 0.99 | 0.26 | 0.61 |
| Host:Microbiome:Mat | 1.93 | 0.16 | 0.32 | 0.73 | 0.31 | 0.73 | 0.10 | 0.90 |
| Flavobacterium | Larkinella | Fungi | Metazoa | |||||
| F | P | F | P | F | P | F | P | |
| Host | 6.83 | <0.00 | 27.80 | <0.00 | 13.10 | <0.00 | 7.56 | <0.00 |
| Microbiome | 3.44 | 0.07 | 4.73 | 0.03 | 2.23 | 0.14 | 1.15 | 0.28 |
| Mat | 0.16 | 0.69 | 0.00 | 0.95 | 0.24 | 0.63 | 0.15 | 0.70 |
| Stream | 0.40 | 0.76 | 1.59 | 0.23 | 4.01 | 0.02 | 0.69 | 0.57 |
| Host: Microbiome | 3.98 | 0.03 | 6.57 | 0.00 | 0.41 | 0.67 | 4.07 | 0.02 |
| Host:Mat | 0.94 | 0.40 | 0.17 | 0.84 | 0.27 | 0.77 | 0.30 | 0.74 |
| Microbiome:Mat | 0.02 | 0.88 | 0.08 | 0.78 | 0.10 | 0.75 | 1.97 | 0.16 |
| Host:Microbiome:Mat | 3.01 | 0.06 | 0.50 | 0.61 | 2.04 | 0.14 | 4.64 | 0.01 |
SI Table 6
Means and standard error of the mean (SE) for relative abundance of selected taxa (Cyanobacteria, Bacteroidota, Proteobacteria, Actinobacteriota, Flavobacterium, Larkinella, Fungi, Metazoa), within external and internal microbiomes. Abundances are reported as a proportion of the entire community (i.e., 0-1).
| Cyanobacteria | Bacteroidota | Proteobacteria | Actinobacteriota | ||||||
|---|---|---|---|---|---|---|---|---|---|
| Proportion | SE | Proportion | SE | Proportion | SE | Proportion | SE | ||
| E. antarcticus | External | 0.03 | 0.01 | 0.75 | 0.06 | 0.19 | 0.08 | 0.00 | 0.01 |
| Internal | 0.02 | 0.01 | 0.09 | 0.08 | 0.81 | 0.10 | 0.01 | 0.00 | |
| P. murrayi | External | 0.22 | 0.06 | 0.37 | 0.05 | 0.29 | 0.03 | 0.02 | 0.01 |
| Internal | 0.06 | 0.02 | 0.64 | 0.06 | 0.20 | 0.04 | 0.03 | 0.01 | |
| Tardigrada | External | 0.04 | 0.03 | 0.47 | 0.07 | 0.33 | 0.05 | 0.01 | 0.00 |
| Internal | 0.01 | 0.02 | 0.62 | 0.05 | 0.29 | 0.03 | 0.01 | 0.00 | |
| Flavobacterium | Larkinella | Fungi | Metazoans | ||||||
| Proportion | SE | Proportion | SE | Proportion | SE | Proportion | SE | ||
| E. antarcticus | External | 0.72 | 0.05 | 0.00 | 0.00 | 0.10 | 0.03 | 0.64 | 0.13 |
| Internal | 0.02 | 0.01 | 0.00 | 0.00 | 0.16 | 0.07 | 0.17 | 0.08 | |
| P. murrayi | External | 0.06 | 0.01 | 0.21 | 0.05 | 0.53 | 0.07 | 0.37 | 0.06 |
| Internal | 0.02 | 0.00 | 0.51 | 0.06 | 0.86 | 0.04 | 0.04 | 0.01 | |
| Tardigrada | External | 0.07 | 0.03 | 0.00 | 0.00 | 0.37 | 0.09 | 0.01 | 0.00 |
| Internal | 0.13 | 0.04 | 0.00 | 0.00 | 0.74 | 0.04 | 0.04 | 0.02 | |
SI Figure 1
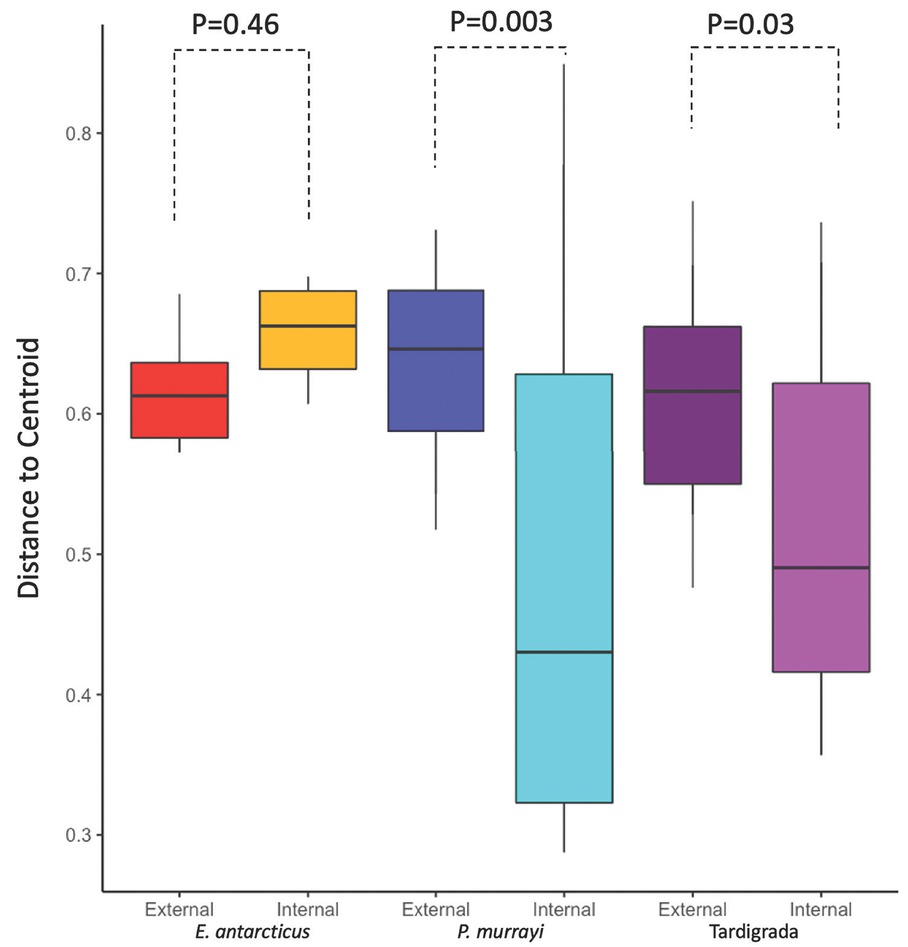
Dispersion values (a boxplot using distance to centroids based on Bray Curtis distance matrix) of external and internal bacterial microbiome composition for different hosts. In a mixed linear model, microinvertebrates did not significantly impact dispersion (P=0.44), but microbiome type did (P=0.03). Pairwise contrasts show that while external microbiomes of P. murrayi and Tardigrada are more variable than their internal microbiomes, E. antarcticus external and internal microbiomes are equally variable.
SI Figure 2
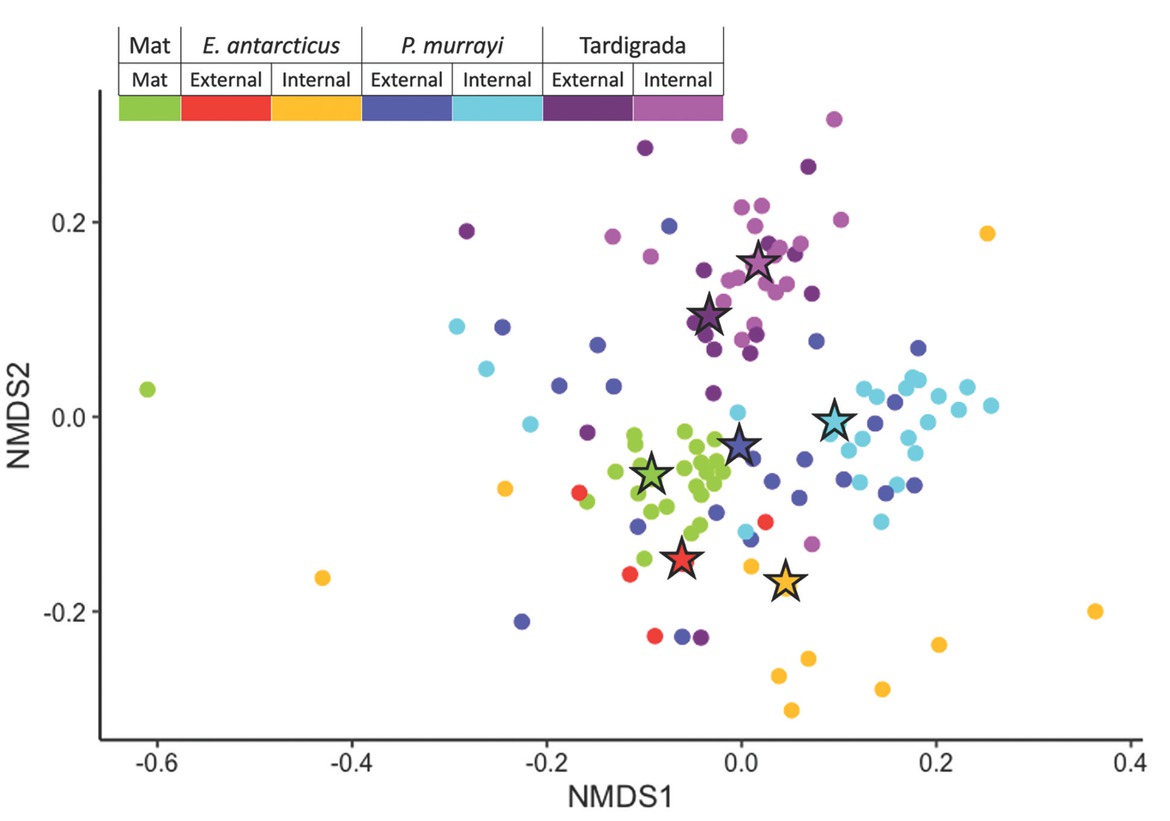
Compositional differences among bacterial microinvertebrate external and internal microbiomes as well as mats they were isolated from using Bray Curtis distance matrix visualized with a NMDS ordination. Circles indicate each community and stars show centroids of microbiome types for each animal host. All host microbiomes (internal and external) are distinct from mat communities (P<0.05), but external microbiomes are more similar to mats than internal microbiomes are to mats.
SI Figure 3
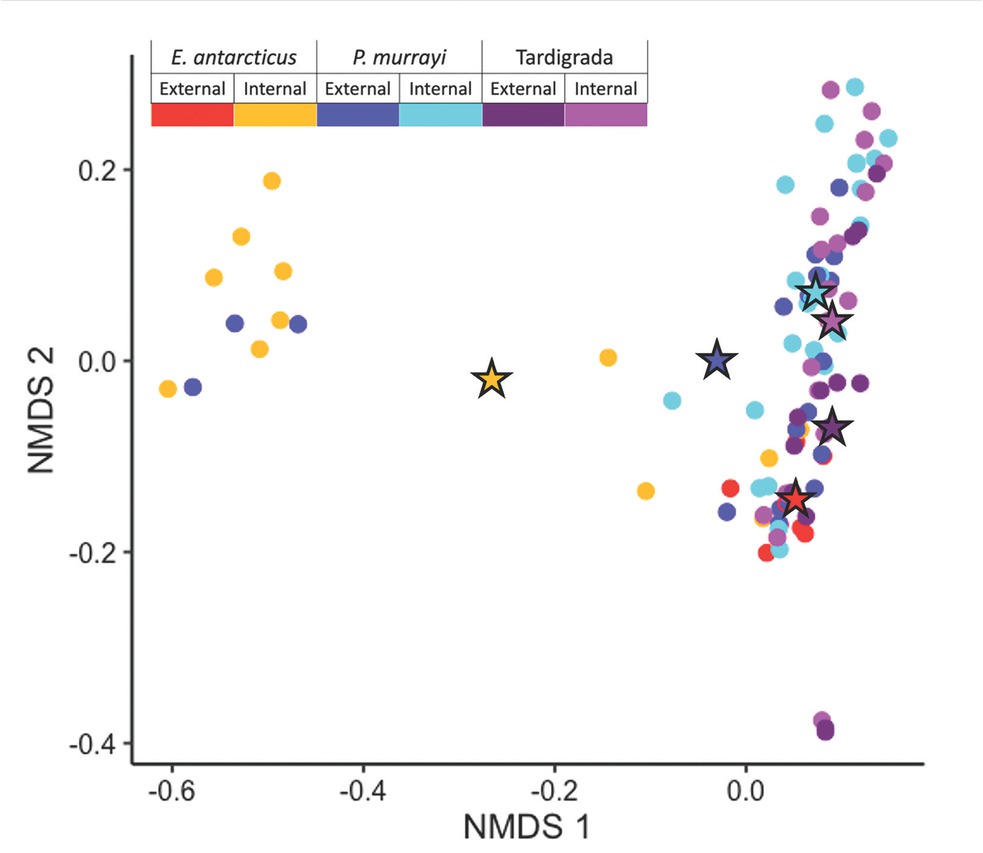
Compositional difference among eukaryotic microinvertebrate external and internal microbiomes, using Bray Curtis distance matrix visualized with a NMDS ordination. Circles indicate each community and stars centroid location of each microbiome type. Communities do not cluster by animal, microbiome type, mat type, or stream.
SI Figure 4
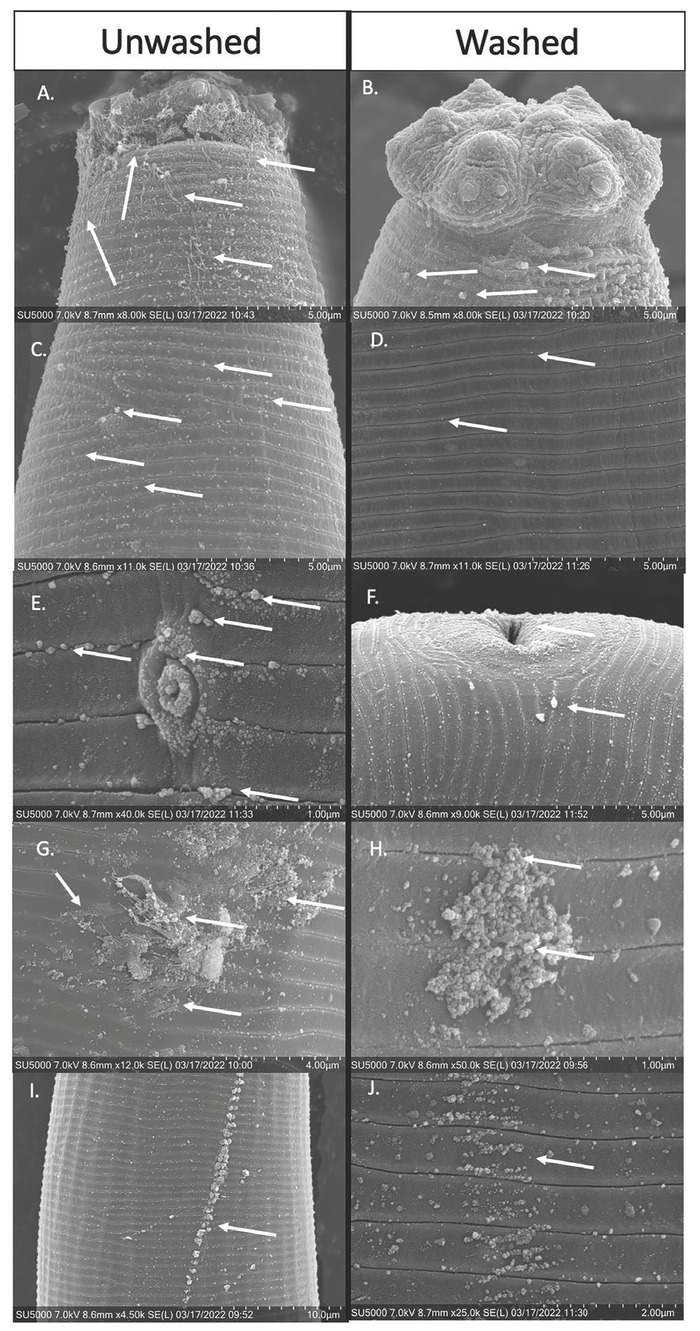
SEM images of either unwashed (left) or washed (right) E. antarcticus nematodes. A. Unwashed head region with arrows pointing to attached material and possible fungal hyphae. B. Washed head region with arrows pointing to the remaining attached material. C. Unwashed annules with arrows pointing to commonly attached foreign material. D. Washed annules with arrows pointing to remaining attached material. E. Unwashed somatic pore with arrows pointing to the common organic material. F. Washed vulva with an arrow pointing to remaining attached organic material. G. Unwashed cuticle with arrows showing a possible biofilm. H. Washed cuticle showing single attached cells indicated with arrows. I. Unwashed cuticle showing an off-axis line of attached material. J. Washed cuticle showing a similar off-axis line of material (as indicated with arrow) but reduced in quantity compared to the unwashed.