
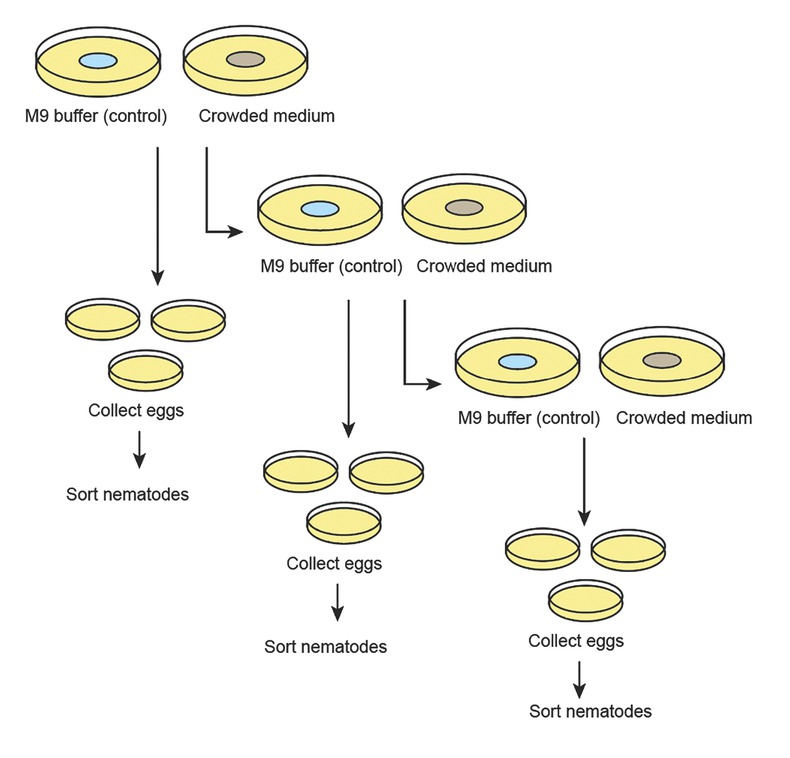
Figure S1
Diagram of the experimental design to test if the crowding cues experienced by hermaphrodite mothers change the sex ratios of the F1 generation. Dauer larvae were isolated onto five 6 cm plates under each condition (control and crowded) and left to mature into a hermaphrodite. F1 eggs were then collected and placed individually onto non-treated 3.5 cm plates. Egg collection occurred >3 d and hermaphrodite mothers were moved to new plates (of their original condition) each day. Eggs were allowed to develop until adulthood and sexed.
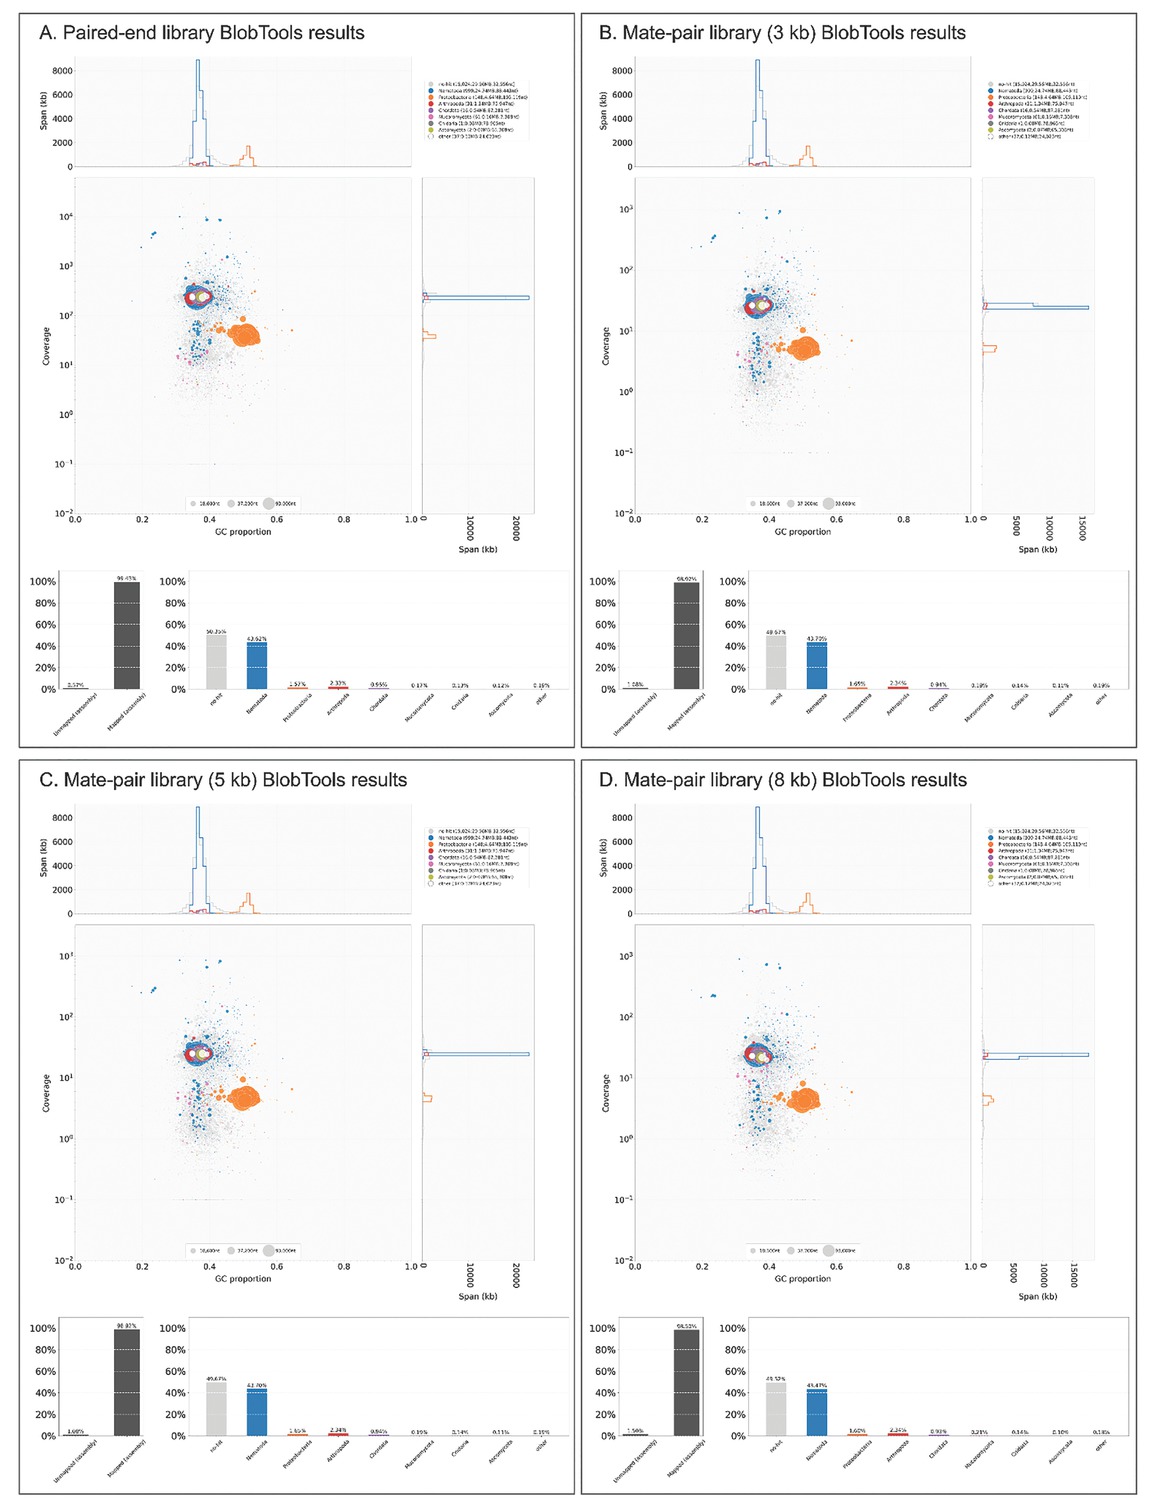
Figure S2
Visualization of the contamination present in the four genomic libraries using BlobTools. The libraries were generally free from contaminants except for a few (<2%) proteobacteria most likely corresponding to the nematode food source (E. coli strain OP50-1).
Table S1
Genomic and transcriptomic raw data used in this study.
| Library (insert size) | Number of raw pairs | GC content (%) | Run accession number (experiment acc) |
|---|---|---|---|
| Pair-end DNA library (200 bp) | 68,587,064 | 37 | ERR9709439 (ERX9258761) |
| Mate-pair DNA library (3 kb) | 16,195,093 | 37 | ERR9709942 (ERX9259264) |
| Mate-pair DNA library (5 kb) | 11,655,487 | 37 | ERR9710904 (ERX9260226) |
| Mate-pair DNA library (8 kb) | 10,769,133 | 37 | ERR9709954 (ERX9259276) |
| RNA-seq library of mixed stages | 22,509,195 | 44 | ERR9712246 (ERX9261548) |
Table S2
Preprocessing of the genomic libraries.
| Library (insert size) | Number of raw pairs | Number of pairs after trimming (quality and size)* | Number of pairs after contamination removal |
|---|---|---|---|
| Pair-end DNA library (200 bp) | 68,587,064 | 68,109,105 (99.30%) | 67,271,297 |
| Mate-pair DNA library (3 kb) | 16,195,093 | 9,920,448 (61.26%) | 9,766,526 |
| Mate-pair DNA library (5 kb) | 11,655,487 | 7,484,279 (64.21%) | 7,372,147 |
| Mate-pair DNA library (8 kb) | 10,769,133 | 7,125,674 (66.17%) | 7,017,505 |
[i] *Reads were trimmed for quality (> 20) and length (> 51 bases).
Table S3
BUSCO scores of the genomes used to construct the phylogeny.
| Complete | Complete and single copy | Complete and duplicated | Fragmented | Missing | |
|---|---|---|---|---|---|
| A. melissensis (this study, GCA_943334845.1) | 2,784 (88.9%) | 2,771 (88.5%) | 13 (0.4%) | 45 (1.4%) | 302 (9.7%) |
| A. freiburgensis (Talal Al Yazeedi, pers. comm.) | 2,789 (89.1%) | 2,756 (88.0%) | 33 (1.1%) | 48 (1.5%) | 294 (9.4%) |
| A. rhodensis (GCA_947366455) | 2,812 (89.8%) | 2,796 (89.3%) | 16 (0.5%) | 39 (1.2%) | 280 (9.0%) |
| O. tipulae (GCA_013425905.1) | 2,843 (90.8%) | 2,786 (89.0%) | 57 (1.8%) | 47 (1.5%) | 241 (7.7%) |
| C. elegans (GCF_000002985.6) | 3,113 (99.4%) | 3,096 (98.9%) | 17 (0.5%) | 3 (0.1%) | 15 (0.5%) |
| P. pacificus (GCA_000180635.4) | 2,587 (82.6%) | 2,537 (81.0%) | 50 (1.6%) | 38 (1.2%) | 506 (16.2%) |
[i] The “nematoda_odb10” (containing 3,131 BUSCOs) database was used.
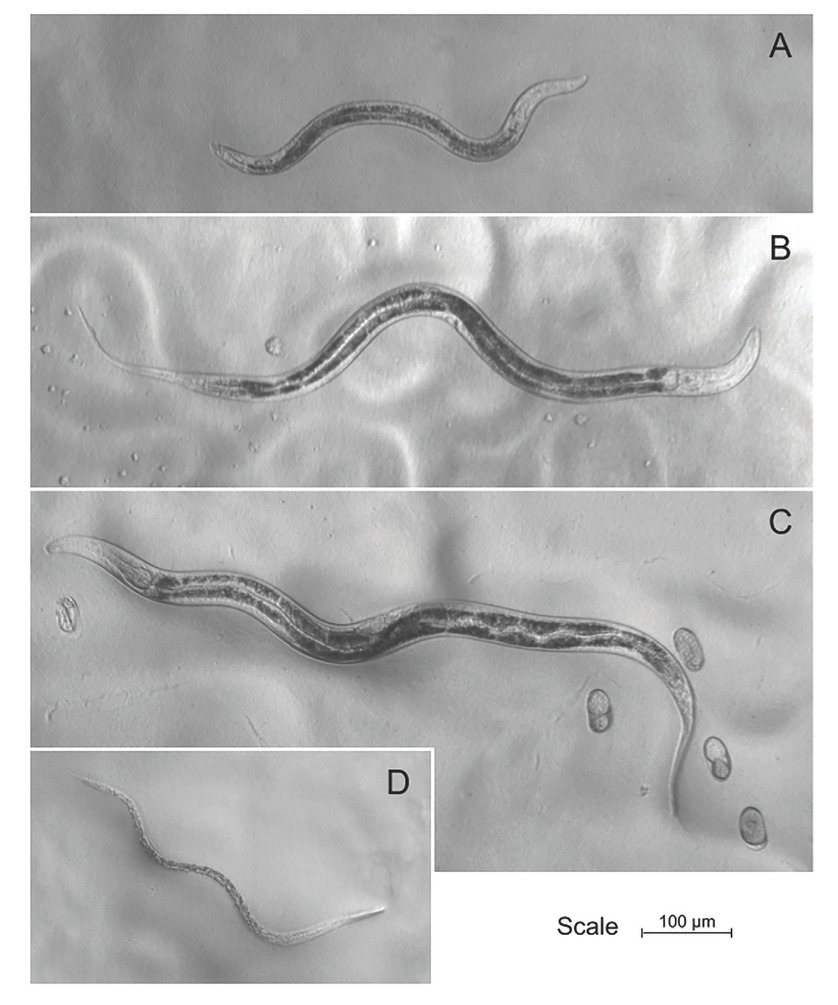
Figure 1
Pictures of a (A) male, (B) female, and (C) hermaphrodite of Auanema melissensis on day 1 of adulthood (100× magnification). A dauer larva (D), fated to develop as a hermaphrodite, is depicted at a magnification of 112×.
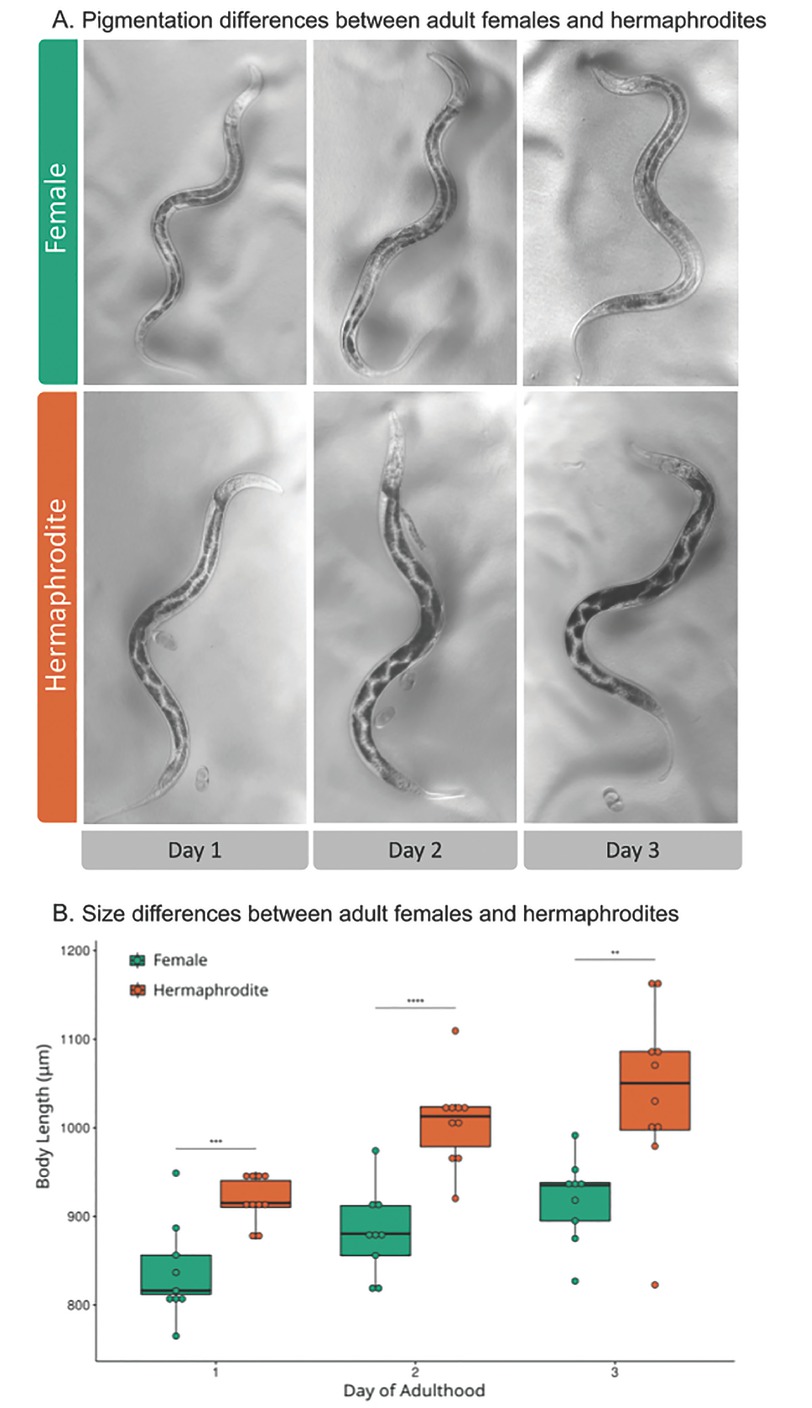
Figure 2
Differences between females and hermaphrodites during the first three days of adulthood. (A) Representative example of the size and pigmentation differences between A. melissensis females and hermaphrodites over the first 3 d of adulthood (100× magnification). The scale bar is the same for all images. (B) Hermaphrodites’ body length is longer than that of females during the first three days of adulthood (repeated measures ANOVA F(1, 8) = 26.580, P < 0.05). As the worms aged, they also became longer (repeated measures ANOVA F(2, 16) = 19.151, P < 0.05).
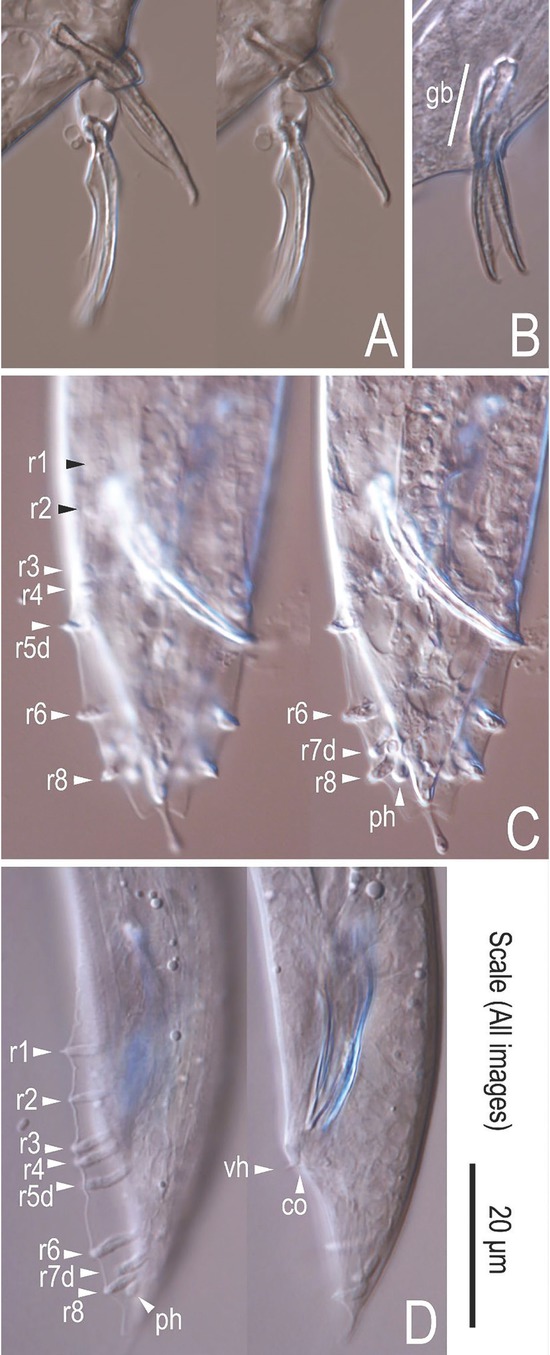
Figure 3
Male tail characters of A. melissensis. Micrographs (A) and (B) show the spicules. Male tail in ventral (C) and lateral (D) orientation. “ph” = Phasmid, “CO” = cloaca, “gb” = gubernaculum, “vh” = ventral hook. Genital papillae/rays are designated by arrowheads and named r1-r8.
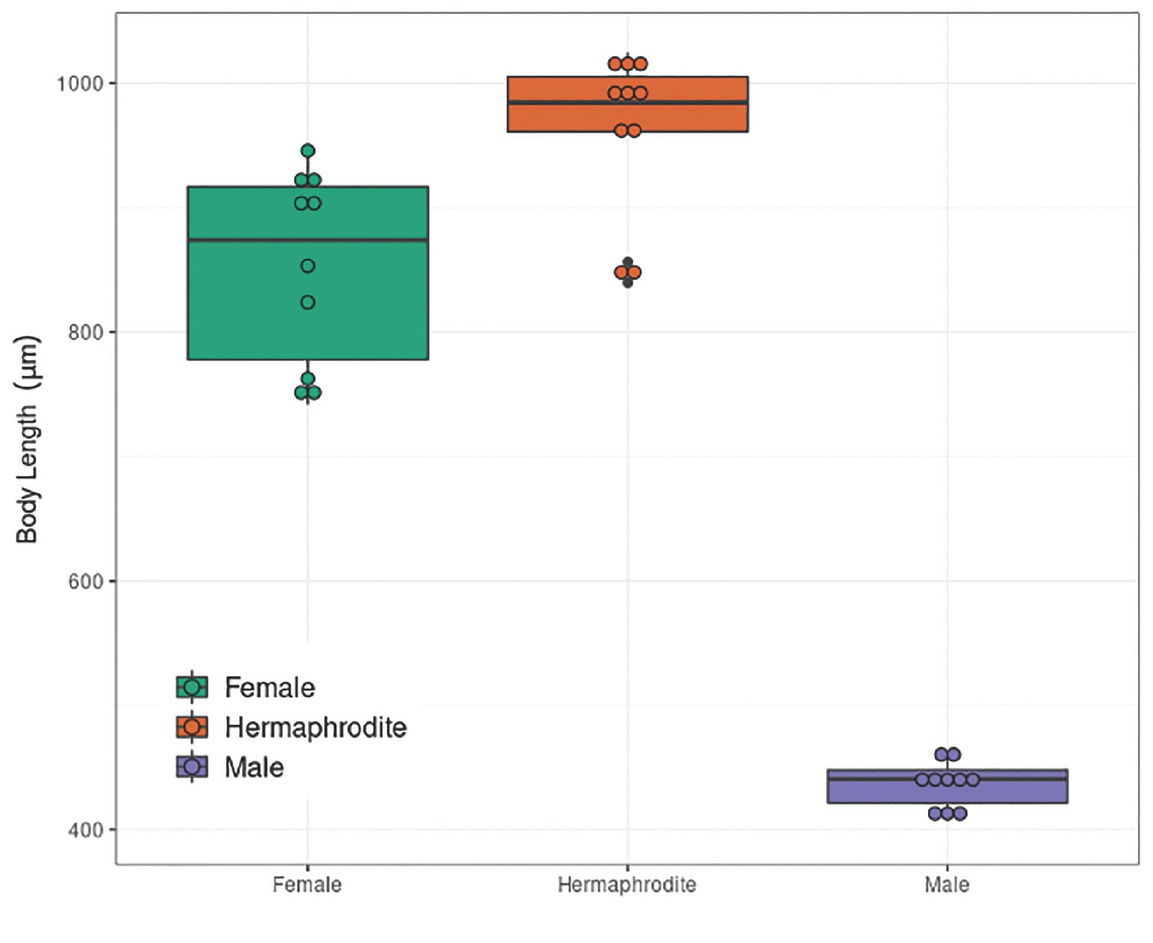
Figure S3
Whole body length of males (n = 10), females (n = 10) and hermaphrodites (n = 10).
Table S4
Whole body measurements of ten males, females and hermaphrodites.
| ID | Sexual morph | Length (μm) |
|---|---|---|
| MM1 | Male | 408.007 |
| MM2 | Male | 417.763 |
| MM3 | Male | 459.784 |
| MM4 | Male | 416.338 |
| MM5 | Male | 448.795 |
| MM6 | Male | 440.899 |
| MM7 | Male | 461.569 |
| MM8 | Male | 446.739 |
| MM9 | Male | 431.713 |
| MM10 | Male | 440.548 |
| FM1 | Female | 823.88 |
| FM2 | Female | 762.546 |
| FM3 | Female | 761.116 |
| FM4 | Female | 853.252 |
| FM5 | Female | 945.703 |
| FM6 | Female | 918.242 |
| FM7 | Female | 894.754 |
| FM8 | Female | 912.291 |
| FM9 | Female | 741.757 |
| FM11 | Female | 926.158 |
| HM1 | Hermaphrodite | 1,006.355 |
| HM2 | Hermaphrodite | 960.354 |
| HM3 | Hermaphrodite | 1,001.369 |
| HM4 | Hermaphrodite | 1,024.498 |
| HM5 | Hermaphrodite | 856.356 |
| HM6 | Hermaphrodite | 1,010.322 |
| HM7 | Hermaphrodite | 839.704 |
| HM8 | Hermaphrodite | 986.148 |
| HM10 | Hermaphrodite | 982.561 |
| HM11 | Hermaphrodite | 963.425 |
[i] Measurements were taken from the tip of the head to the tip of the tail.
Table 1
Crosses were performed between A. melissensis and A. rhodensis or A. freiburgensis. The number of crosses performed is denoted by “n.”
| Males | ||||
|---|---|---|---|---|
| A. melissensis | A. rhodensis | A. freiburgensis | ||
| Females | A. melissensis | No offspring (n = 5) | No offspring (n = 11) | |
| A. rhodensis | No offspring (n = 5) | |||
| A. freiburgensis | No offspring (n = 8) |
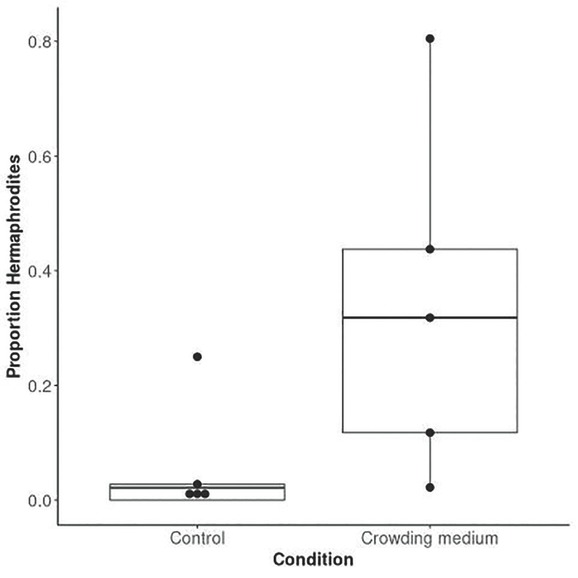
Figure 4
Hermaphrodite production is promoted when A. melissensis hermaphrodite mothers are cultured in the presence of a crowding cue. The boxplots were drawn from the proportion of hermaphrodites (number of hermaphrodites/number of hermaphrodites and females) under each condition for each replicate.
Table S5
Number of F1 males, females and hermaphrodites produced by selfing mothers in the absence (control) and presence (crowding) of a crowding cue.
| Replicate | Male (%) | Female (%) | Hermaphrodite (%) | Total |
|---|---|---|---|---|
| Control 1 | 9 (11.7) | 68 (88.3) | 0 (0) | 77 |
| Control 2 | 3 (7.7) | 35 (89.7) | 1 (2.6) | 39 |
| Control 3 | 1 (7.7) | 9 (69.2) | 3 (23.1) | 13 |
| Control 4 | 4 (23.5) | 13 (76.5) | 0 (0.0) | 17 |
| Control 5 | 0 (0.0) | 45 (97.8) | 1 (2.2) | 46 |
| Total Control | 17 (8.9) | 170 (88.5) | 5 (2.6) | 192 |
| Crowding 1 | 0 (0.0) | 15 (88.2) | 2 (11.8) | 17 |
| Crowding 2 | 0 (0.0) | 15 (68.2) | 7 (31.8) | 22 |
| Crowding 3 | 1 (2.2) | 44 (95.7) | 1 (2.2) | 46 |
| Crowding 4 | 0 (0.0) | 27 (56.3) | 21 (43.8) | 48 |
| Crowding 5 | 0 (0.0) | 8 (19.5) | 33 (80.5) | 41 |
| Total Crowding | 1 (0.6) | 109 (62.6) | 64 (36.8) | 174 |
[i] For each replicate, we calculated the percentage of each sexual morph produced.
Table 2
Basic statistics on the genome of A. melissensis compared to that of C. elegans. The nematoda_odb10 database was used for the BUSCO analysis.
| A. melissensis PRJEB51845/ GCA_ 943334845.1 | C. elegans PRJNA13758/ GCF_ 000002985.6 | |
|---|---|---|
| Number of scaffolds | 7,511 | 6 + MT |
| Span (Mb) | 59.7 | 100.3 |
| GC content (%) | 37.1 | 35.4 |
| N50 (bp) | 404,820 (n = 39) | 17,493,829 |
| Longest scaffold/ chromosome | 2,171,611 | 20,924,180 |
| N counts | 5,769,006 | 0.00 |
| Gaps | 3,945 | NA |
| Repeats | 4,816,819 bp (8.07%) | (21.95%) |
| BUSCO (v5.2.2) score (on genome) | C: 88.9% [S: 88.5%, D: 0.4%], F: 1.4%, M: 9.7%, n: 3,131 | C: 99.4% [S: 98.9%, D: 0.5%], F: 0.1%, M: 0.5% |
| No. of protein-coding genes | 11,040 | 20,184 |
| BUSCO (v5.2.2) score (on the proteome, using nematoda_ odb10, n = 3,131) | C: 89.7% [S: 77.2%, D: 12.5%], F: 1.1%, M: 9.2% | C: 100.0% [S: 74.8%, D: 25.2%], F: 0.0%, M: 0.0% |
Table S6
Classification of the repeats by Repeat Masker.
| Category | Number of elements* | Length occupied (bp) | Percentage of sequence |
|---|---|---|---|
| SINEs (all) | 30 | 7,757 | 0.01 |
| SINEs (ALUs) | 0 | 0 | 0.00 |
| SINEs (MIRs) | 0 | 0 | 0.00 |
| LINEs (all) | 78 | 22,828 | 0.04 |
| LINEs (LINE1) | 0 | 0 | 0.00 |
| LINEs (LINE2) | 10 | 4,088 | 0.01 |
| LINEs (L3/CR1) | 14 | 5,507 | 0.01 |
| LTR elements (all) | 1,799 | 727,003 | 1.22 |
| LTR elements (ERVL) | 0 | 0 | 0.00 |
| LTR elements (ERVL-MaLRs) | 0 | 0 | 0.00 |
| LTR elements (ERV_classI) | 0 | 0 | 0.00 |
| LTR elements (ERV_classII) | 0 | 0 | 0.00 |
| DNA elements | 430 | 161,038 | 0.27 |
| DNA elements (hAT-Charlie) | 0 | 0 | 0.00 |
| DNA elements (TcMar-Tigger) | 1 | 807 | 0.00 |
| Unclassified | 6,850 | 2,109,448 | 3.53 |
| Total interspersed repeats | NA | 3,028,074 | 5.07 |
| Small RNA | 792 | 186,973 | 0.31 |
| Satellites | 167 | 46,755 | 0.08 |
| Simple repeats | 24,687 | 1,082,694 | 1.81 |
| Low complexity | 8,083 | 464,828 | 0.78 |
[i] *Most repeats fragmented by insertions or deletions have been counted as one element.
Masked sequences represented 4,816,819 bp (8.07%) of the genome of A. melissensis (59,698,091 bp of total length).
Table 3
Putative X scaffolds. Scaffolds containing at least 3 Nigon X BUSCO genes were considered putative X scaffolds.
| Scaffolds | Number of Nigon X BUSCO genes | Number of BUSCO genes of other Nigons |
|---|---|---|
| scaffold120 (CALQYR010007222.1) | 10 | 0 |
| scaffold167 (CALQYR010007273.1) | 18 | 0 |
| scaffold125 (CALQYR010007227.1) | 5 | 0 |
| scaffold146 (CALQYR010007250.1) | 5 | 0 |
| scaffold91 (CALQYR010007503.1) | 12 | 0 |
| scaffold79 (CALQYR010007489.1) | 7 | 0 |
| scaffold72 (CALQYR010007482.1) | 6 | 0 |
| scaffold42 (CALQYR010007449.1) | 3 | 0 |
| scaffold41 (CALQYR010007448.1) | 3 | 0 |
| scaffold190 (CALQYR010007299.1) | 3 | 0 |
| scaffold168 (CALQYR010007274.1) | 3 | 0 |
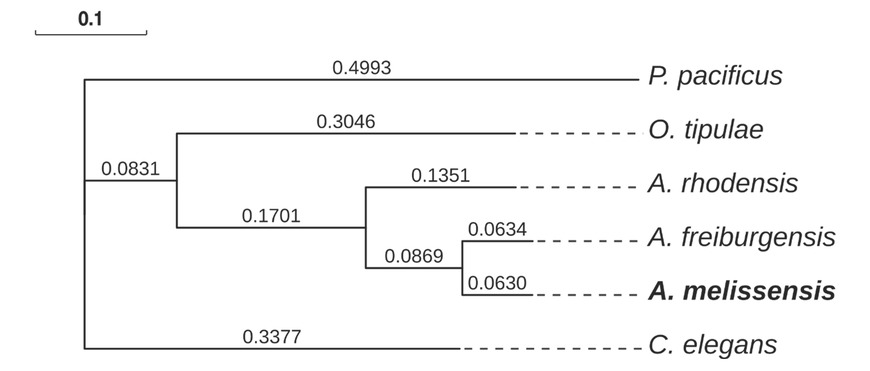
Figure 5
Phylogenetic position of A. melissensis. Single-copy BUSCO orthologs (2071) were used to build a concatenated alignment, which was subsequently used to construct the phylogenetic tree. The supermatrix alignment was 1,018,758 amino acids in length.