
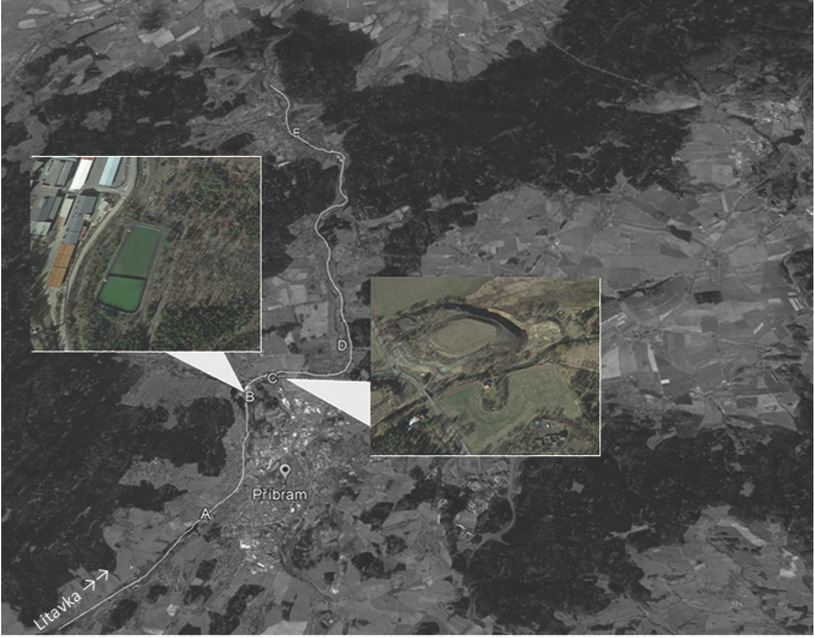
Figure 1
Map of selected localities: (A) control meadows situated 3.6 km before pollution source; (B) meadow near waste sedimentation pond; (C) meadow near the heap of mine waste situated 680 m from (B); and (D) meadows near old bakery mill situated 3.7 km from (B) and (E) meadow close to village Jince situated 13.3 km from the pollution source.
Table 1
Soil physico- chemical properties (mean ± SD) associated with alluvial meadows in the vicinity of the Příbram mine along the Litavka River.
| A | B | C | D | E | |
|---|---|---|---|---|---|
| pH/KCl | 6.89 ± 0.25a | 5.42 ± 0.21a | 5.20 ± −0.11b | 5.56 ± 0.16b | 6.75 ± 0.18a |
| Soil moisture (%) | 35.2 ± 5.6a | 31.5 ± 2.9a | 29.5 ± 3.1a | 30.5 ± 3.3a | 31.5 ± 2.8a |
| Ntot (%) | 0.87 ± 0.15a | 0.61 ± 0.10b | 0.74 ± 0.32b | 0.66 ± 0.15b | 0.83 ± 0.22a |
| Cox (%) | 14.25 ± 1.69a | 8.25 ± 2.19b | 10.67 ± 3.61b | 12.29 ± 2.69a | 12.87 ± 3.16a |
Table 2
Total concentrations of heavy metals (mg/kg) (mean ± SD) associated with alluvial meadows in the vicinity of the Příbram mine along the Litavka River.
| A | B | C | D | E | ||
|---|---|---|---|---|---|---|
| As | 38.2 ± 3.3a | 688.8 ± 91.8c | 677.4 ± 181.1c | 176.2 ± 47.7b | 31.8 ± 17.8a | 20 |
| Cd | 1.9 ± 0.2a | 19.5 ± 1.9b | 51.5 ± 23.1c | 28.4 ± 12.9bc | 2.1 ± 1.0a | 0.5 |
| Cr | 37.9 ± 5.1a | 58.2 ± 1.3b | 68.8 ± 59.9a | 40.4 ± 5.7a | 28.7 ± 1.7a | 90 |
| Cu | 35.7 ± 5.3a | 97.6 ± 8.7b | 139.6 ± 24.6c | 61.9 ± 30.7ab | 23.1 ± 11.9a | 60 |
| Ni | 19.1 ± 1.3a | 38.1 ± 2.4b | 33.2 ± 8.2ab | 22.9 ± 8.3a | 15.4 ± 1.8a | 50 |
| Pb | 553.3 ± 237.6a | 3734.1 ± 1915.6b | 4030.9 ± 165.1bc | 2682.2 ± 460.3b | 689.8 ± 474.3a | 60 |
| Zn | 346.2 ± 34.6a | 2949.5 ± 435.9b | 6867.8 ± 1374.9c | 3866.4 ± 1146.2b | 566.4 ± 490.1a | 120 |
[i] Means followed by the same letters on the same rows are not statistically different by Tukey's honestly significant difference (HSD) at p < 0.05, n = 4.
Max – limits posted by The Decree of the Ministry of Land Management of the Czech Republic No. 437/2016 on the admissible values of harmful substances in uncontaminated soil.
Table 3
Total nematode abundance, number of genera, nematode community indices associated with alluvial meadows in the vicinity of the Příbram mine along the Litavka River (mean ± SD).
| Indices | A | B | C | D | E |
|---|---|---|---|---|---|
| Nematode abundance | 2193.2 ± 358.9a | 595.8 ± 130.9b | 513.8 ± 122.3b | 974.9 ± 340.4b | 1674.1 ± 263.5a |
| Genera number | 31.8 ± 1.7a | 25.8 ± 1.5b | 27.5 ± 5.1a | 21.5 ± 3.1b | 30.5 ± 4.2a |
| Maturity Index | 2.68 ± 0.12a | 2.12 ± 0.09b | 2.20 ± 0.10b | 2.22 ± 0.21b | 2.63 ± 0.15a |
| Maturity Index (2-5) | 2.89 ± 0.07a | 2.33 ± 0.16b | 2.37 ± 0.15b | 2.33 ± 0.19b | 2.85 ± 0.22a |
| Plant Parasitic Index | 2.69 ± 0.11a | 2.80 ± 0.18a | 2.88 ± 0.04a | 2.77 ± 0.14a | 2.73 ± 0.16a |
| Diversity Index (H´gen) | 3.49 ± 0.15a | 2.13 ± 0.25b | 2.47 ± 0.26b | 2.22 ± 0.18b | 3.09 ± 0.10a |
| Channel Index | 8.8 ± 4.0a | 23.0 ± 11.8b | 36.4 ± 12.9b | 30.9 ± 6.6b | 22.9 ± 19.6ab |
| Basal Index | 16.6 ± 2.3a | 32.9 ± 8.3b | 33.9 ± 10.7b | 33.7 ± 4.6b | 19.9 ± 9.3a |
| Enrichment Index | 71.5 ± 4.4a | 53.2 ± 10.9b | 50.3 ± 11.5b | 37.9 ± 16.2b | 66.7 ± 10.1b |
| Structure Index | 72.0 ± 3.2a | 44.5 ± 18.7b | 49.8 ± 13.1b | 47.9 ± 16.2b | 73.8 ± 12.3a |
| Total biomass, mg | 7.5 ± 1.2a | 2.1 ± 1.2b | 1.9 ± 1.3b | 4.9 ± 2.9b | 8.6 ± 2.5a |
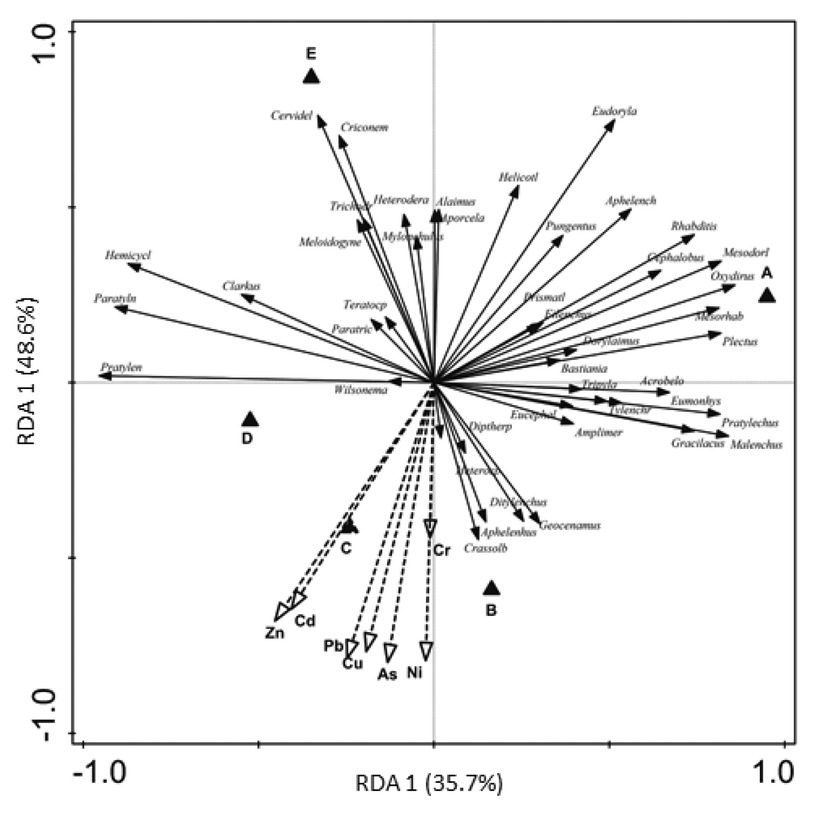
Figure 2
RDA biplot of prevailing nematode genera and heavy metals contents in the five alluvial meadows along the Litavka River in the vicinity of the Příbram mine pollution sources. (A) a control meadow 3.6 km upstream of the source of pollution; (B) meadow near waste sedimentation pond; (C) meadow near the heap of mine waste situated 680 m from (B); and (D) meadows near old bakery mill situated 3.7 km from (B) and (E) meadow close to village Jince situated 13.3 km from the pollution source. Amplimer = Amplimerlinius; Acrobelo = Acrobeloides; Aphelench = Aphelenchoides; Aporcela = Aporcelaimellus; Crassolb = Crassolabium; Criconem = Criconemoides; Dipttherp = Diptherophora; Eucephal = Eucephalobus; Eudoryla = Eudorylaimus; Eumonhys = Eumonhystera; Helicotl = Helicotylenchus; Hemicycl = Hemicycliophora; Heterocp = Heterocephalobus; Mesodorl = Mesodorylaimus; Mesorhab = Mesorhabditis; Paratyln = Paratylenchus; Pratylech = Pratylenchoides; Prismatl = Primatolaimus; Teratocep = Teratocepahlobus; Trichodr = Trichodorus; Tylenchr = Tylenchorhynchus. RDA, redundancy analysis.
Table 4
A abundance of nematode genera (mean ± SD) associated with alluvial meadows in the vicinity of the Příbram mine along the Litavka River.
| Genus/trophic group | c-p | A | B | C | D | E |
|---|---|---|---|---|---|---|
| Bacterivores | ||||||
| Mesorhabditis | 1 | 251.6 ± 103.4 | 24.3 ± 13.0 | 22.6 ± 14.2 | 5.3 ± 8.3 | 24.8 ± 14.5 |
| Plectus | 2 | 241.3 ± 44.1 | 23.9 ± 20.7 | 10.5 ± 2.9 | 0.9 ± 0.5 | 15.4 ± 2.8 |
| Rhabditis | 1 | 187.0 ± 63.9 | 21.8 ± 17.7 | 5.9 ± 1.2 | 9.5 ± 11.6 | 26.3 ± 10.8 |
| Acrobeloides | 2 | 143.3 ± 75.1 | 72.1 ± 8.4 | 15.4 ± 7.9 | 51.1 ± 26.6 | 40.5 ± 35.6 |
| Cephalobus | 2 | 123.5 ± 61.0 | 12.1 ± 8.9 | 5.9 ± 3.9 | 9.6 ± 10.2 | 23.2 ± 18.7 |
| Eucephalobus | 2 | 53.3 ± 27.8 | 12.2 ± 9.3 | 20.5 ± 10.8 | 22.5 ± 15.9 | 11.6 ± 10.1 |
| Prismatolaimus | 3 | 51.1 ± 60.8 | 12.1 ± 7.9 | 7.0 ± 3.3 | 11.9 ± 17.5 | 17.6 ± 5.3 |
| Bunonema | 1 | 27.4 ± 14.9 | - | - | - | 2.2 ± 4.4 |
| Eumonhystera | 2 | 26.2 ± 24.1 | 4.6 ± 5.9 | 5.0 ± 2.4 | - | 4.4 ± 8.7 |
| Heterocephalobus | 2 | 18.3 ± 5.6 | 4.5 ± 3.4 | - | 8.6 ± 3.9 | - |
| Alaimus | 4 | 9.1 ± 18.1 | 0.6 ± 1.1 | 4.3 ± 7.3 | - | 12.2 ± 9.8 |
| Bastiania | 3 | 8.7 ± 5.9 | 2.1 ± 4.2 | 2.6 ± 1.9 | 1.9 ± 3.8 | 4.6 ± 9.3 |
| Anaplectus | 2 | 8.0 ± 5.4 | 1.9 ± 1.4 | - | - | - |
| Cervidellus | 2 | 7.9 ± 15.8 | - | - | 8.1 ± 6.6 | 47.0 ± 12.8 |
| Teratocephalus | 3 | 2.3 ± 4.6 | 1.4 ± 2.9 | 9.5 ± 2.6 | 1.9 ± 3.8 | 10.3 ± 5.9 |
| Eudiplogaster | 2 | 1.5 ± 3.0 | 0.5 ± 1.0 | - | 1.9 ± 3.8 | 2.3 ± 4.6 |
| Acrobeles | 2 | - | - | - | 1.9 ± 3.8 | 16.8 ± 11.5 |
| Amphidelus | 4 | - | - | 1.9 ± 3.8 | - | - |
| Ceratoplectus | 2 | - | 1.1 ± 2.3 | 2.2 ± 2.5 | - | - |
| Diploscapter | 1 | - | 1.4 ± 1.7 | - | - | 2.2 ± 4.4 |
| Euteratocephalus | 2 | - | 4.0 ± 3.8 | 3.0 ± 2.0 | - | - |
| Chiloplacus | 2 | - | - | - | 2.9 ± 3.7 | 8.6 ± 10.6 |
| Panagrolaimus | 1 | - | 1.0 ± 2.1 | - | - | 2.2 ± 4.4 |
| Prodesmodora | 3 | - | 1.5 ± 2.0 | - | - | - |
| Wilsonema | 2 | - | 15.4 ± 14.8 | - | 1.9 ± 2.1 | 12.4 ± 8.3 |
| Fungivores | ||||||
| Dorylaimoides | 4 | 104.9 ± 59.4 | - | - | - | - |
| Aphelenchoides | 2 | 113.6 ± 54.2 | 7.9 ± 5.9 | 8.2 ± 6.6 | 9.5 ± 11.5 | 39.6 ± 7.8 |
| Aphelenchus | 2 | 24.4 ± 37.3 | 20.9 ± 12.3 | 2.1 ± 3.0 | 11.9 ± 6.2 | 2.2 ± 4.4 |
| Ditylenchus | 2 | 12.5 ± 15.4 | 9.3 ± 7.6 | 6.5 ± 3.0 | 2.9 ± 5.9 | 3.2 ± 6.5 |
| Diptheropthora | 3 | 10.9 ± 14.9 | 5.0 ± 5.0 | 8.5 ± 4.5 | 6.2 ± 2.8 | 6.0 ± 4.2 |
| Tylencholaimus | 4 | 5.4 ± 6.3 | 4.2 ± 8.3 | - | - | 7.6 ± 10.2 |
| Tylencholaimellus | 4 | 4.5 ± 9.1 | 0.5 ± 1.0 | - | - | - |
| Paraphelenchus | 2 | - | 1.2 ± 2.5 | - | - | 1.6 ± 3.2 |
| Omnivores | ||||||
| Eudorylaimus | 4 | 91.1 ± 61.5 | 3.0 ± 3.9 | 0.9 ± 0.9 | 2.9 ± 3.7 | 53.1 ± 38.5 |
| Mesodorylaimus | 4 | 76.2 ± 26.6 | - | - | - | 4.4 ± 8.7 |
| Oxydirus | 5 | 60.5 ± 40.2 | 0.8 ± 1.6 | - | - | 1.6 ± 3.2 |
| Dorylaimus | 4 | 24.3 ± 40.7 | 0.5 ± 1.0 | 2.4 ± 1.8 | - | 1.6 ± 3.2 |
| Aporcelaimellus | 5 | 13.9 ± 16.4 | 1.0 ± 2.1 | 2.0 ± 1.4 | 3.8 ± 4.1 | 21.1 ± 6.9 |
| Pungentus | 4 | 10.7 ± 12.6 | 0.4 ± 0.8 | 0.5 ± 1.0 | - | 4.9 ± 5.7 |
| Achromadora | 3 | 3.1 ± 6.1 | - | - | - | - |
| Crassolabium | 4 | 1.5 ± 3.0 | 6.7 ± 6.3 | 1.5 ± 1.9 | 1.9 ± 1.2 | - |
| Axonchium | 5 | - | 2.8 ± 5.7 | - | - | - |
| Discolaimium | 4 | - | 2.1 ± 4.2 | - | - | - |
| Microdorylaimus | 4 | - | - | 0.5 ± 1.1 | 9.5 ± 11.4 | - |
| Paractinolaimus | 5 | - | 0.4 ± 0.8 | - | - | - |
| Predators | ||||||
| Tripyla | 3 | 7.7 ± 9.1 | 2.9 ± 5.9 | - | 1.9 ± 3.8 | - |
| Mononchus | 4 | 7.3 ± 9.0 | 0.5 ± 1.0 | 3.4 ± 2.1 | - | - |
| Prionchulus | 4 | 6.2 ± 8.7 | - | - | - | 1.6 ± 2.1 |
| Clarkus | 4 | 3.1 ± 6.1 | 0.9 ± 1.0 | 8.0 ± 4.6 | 8.1 ± 5.0 | 14.4 ± 9.8 |
| Mylonchulus | 4 | 3.1 ± 6.2 | 3.7 ± 5.9 | 1.1 ± 2.1 | - | 17.3 ± 14.6 |
| Nygolaimus | 5 | - | - | - | - | 2.2 ± 4.4 |
| Plant parasites | ||||||
| Helicotylenchus | 3 | 163.8 ± 82.9 | 38.7 ± 31.1 | 60.9 ± 21.6 | 85.7 ± 64.8 | 118.0 ± 57.6 |
| Heterodera | 3 | 57.9 ± 47.4 | 31.8 ± 2.4 | 27.8 ± 17.3 | 78.6 ± 21.8 | 52.3 ± 134.8 |
| Pratylenchoides | 3 | 36.9 ± 30.1 | 5.0 ± 1.2 | - | - | - |
| Malenchus | 2 | 50.9 ± 52.7 | 9.2 ± 2.5 | 5.8 ± 2.4 | 95.5 ± 21.9 | 2.2 ± 4.4 |
| Rotylenchus | 3 | 29.3 ± 31.7 | - | 0.5 ± 1.1 | 0.9 ± 1.9 | - |
| Geocenamus | 3 | 27.0 ± 20.3 | 67.7 ± 47.0 | 62.5 ± 16.3 | 53.8 ± 4.4 | 22.4 ± 16.6 |
| Gracilacus | 2 | 26.6 ± 12.9 | 39.8 ± 33.0 | - | - | 7.0 ± 13.9 |
| Filenchus | 2 | 15.3 ± 12.0 | 5.1 ± 4.7 | 0.9 ± 1.9 | 4.3 ± 3.3 | 9.2 ± 10.6 |
| Tylenchorhynchus | 3 | 14.7 ± 12.0 | 23.9 ± 27.1 | 3.9 ± 5.1 | - | 4.9 ± 5.7 |
| Meloidogyne | 3 | 7.5 ± 8.2 | 10.7 ± 26.2 | - | 20.5 ± 14.5 | 99.6 ± 33.9 |
| Tylenchus | 2 | 6.8 ± 9.9 | 0.8 ± 1.6 | 0.5 ± 1.1 | 1.9 ± 3.8 | - |
| Coslenchus | 2 | 6.1 ± 12.2 | 2.8 ± 3.7 | - | - | 2.3 ± 4.6 |
| Amplimerlinius | 3 | 3.0 ± 6.1 | 1.3 ± 2.0 | - | - | - |
| Lelenchus | 2 | 2.6 ± 5.3 | - | - | 3.8 ± 7.6 | - |
| Criconemoides | 3 | - | - | - | - | 9.7 ± 7.0 |
| Hemicycliophora | 3 | - | - | 105.7 ± 49.2 | 303.1 ± 63.3 | 195.3 ± 110.3 |
| Longidorus | 5 | - | 3.4 ± 4.3 | - | - | 23.8 ± 8.2 |
| Mesocriconema | 3 | - | - | 1.6 ± 2.1 | - | 15.6 ± 12.1 |
| Paratrichodorus | 4 | - | 4.1 ± 1.5 | - | - | 24.9 ± 30.2 |
| Paratylenchus | 2 | - | 27.0 ± 16.2 | 33.3 ± 10.8 | 23.4 ± 9.7 | 177.1 ± 159.5 |
| Pratylenchus | 3 | - | 31.6 ± 8.4 | 45.1 ± 14.1 | 107.1 ± 28.9 | 122.8 ± 40.2 |
| Trichodorus | 4 | - | 4.3 ± 5.9 | - | - | 20.5 ± 18.4 |
| Xenocriconemella | 3 | - | 4.3 ± 7.2 | - | - | - |
| Aglenchus | 2 | - | - | - | 3.9 ± 2.5 | - |
| Boleodorus | 2 | - | - | 2.8 ± 3.5 | - | - |
| Psilenchus | 2 | - | - | 1.1 ± 1.2 | - | - |
| Insect parasites | ||||||
| Steinernema | 1 | - | - | 2.8 ± 5.7 | 3.8 ± 4.4 |
Table 5
Mean (±SD) abundance of nematode trophic groups and functional guilds associated with alluvial meadows in the vicinity of the Příbram mine along the Litavka River.
| A | B | C | D | E | |
|---|---|---|---|---|---|
| Bacterivores | 1160.6 ± 604.5a | 218.6 ± 56.3b | 115.6 ± 44.9b | 139.9 ± 56.8b | 284.3 ± 119.9b |
| Ba1 | 466.1 ± 142.5a | 48.5 ± 31.2b | 28.4 ± 18.3b | 14.8 ± 10.2b | 57.6 ± 30.0b |
| Ba2 | 623.3 ± 149.5a | 152.3 ± 41.3b | 61.9 ± 8.3b | 109.3 ± 54.1b | 182.3 ± 78.9b |
| Ba3 | 62.1 ± 60.6a | 17.1 ± 13.8b | 19.1 ± 15.3b | 15.7 ± 25.1b | 32.3 ± 27.2ab |
| Ba4 | 9.1 ± 18.1a | 0.6 ± 1.1b | 0.6 ± 1.1b | - | 10.0 ± 11.7a |
| Predators | 87.6 ± 79.3 | 8.8 ± 6.8 | 12.4 ± 9.8 | 10.1 ± 6.1 | 37.1 ± 14.8 |
| P3 | 7.7 ± 9.2a | 2.9 ± 5.8a | 2.9 ± 5.8a | 1.9 ± 3.8a | - |
| P4 | 19.5 ± 12.1a | 5.1 ± 5.0b | 12.4 ± 9.8a | 8.1 ± 5.0a | 33.3 ± 10.8a |
| P5 | 60.4 ± 40.2a | 0.8 ± 1.6b | - | - | 3.8 ± 4.5b |
| Fungivores | 276.1 ± 196.9a | 49.0 ± 26.7b | 25.3 ± 7.6b | 30.6 ± 10.9b | 60.6 ± 24.8b |
| Fu2 | 150.3 ± 39.8a | 39.4 ± 15.1b | 16.8 ± 7.9b | 24.3 ± 7.1b | 46.6 ± 31.4b |
| Fu3 | 10.9 ± 14.9a | 5.0 ± 5.0a | 8.5 ± 7.9a | 6.2 ± 6.5a | 6.0 ± 8.2a |
| Fu4 | 114.8 ± 46.3a | 4.6 ± 8.0b | 4.6 ± 8.0b | - | 7.6 ± 10.2b |
| Omnivores | 220.7 ± 167.4a | 17.2 ± 6.6b | 7.9 ± 3.0b | 18.1 ± 19.0b | 85.0 ± 44.3ab |
| Om3 | 3.0 ± 6.1 | - | - | - | - |
| Om4 | 203.6 ± 90.0a | 12.7 ± 10.1b | 5.9 ± 3.7b | 14.3 ± 14.7b | 63.9 ± 40.6b |
| Om5 | 14.0 ± 6.4a | 4.3 ± 5.0b | 2.0 ± 2.4b | 3.8 ± 4.4b | 21.1 ± 5.6a |
| Plant parasites | 451.8 ± 117.5a | 299.7 ± 66.9a | 351.4 ± 98.0a | 782.5 ± 260.8a | 893.8 ± 249.3a |
| Pp2 | 108.3 ± 52.5a | 84.6 ± 40.5a | 44.4 ± 25.7b | 187.3 ± 121.4a | 397.7 ± 262.4a |
| Pp3 | 340.1 ± 15.7a | 206.1 ± 67.4a | 308.0 ± 84.9a | 589.2 ± 206.3a | 540.5 ± 111.2a |
| Pp4 | - | 8.4 ± 6.7 | - | - | 45.5 ± 35.8 |
| Pp5 | - | 3.4 ± 4.3 | - | - | 23.8 ± 28.9 |
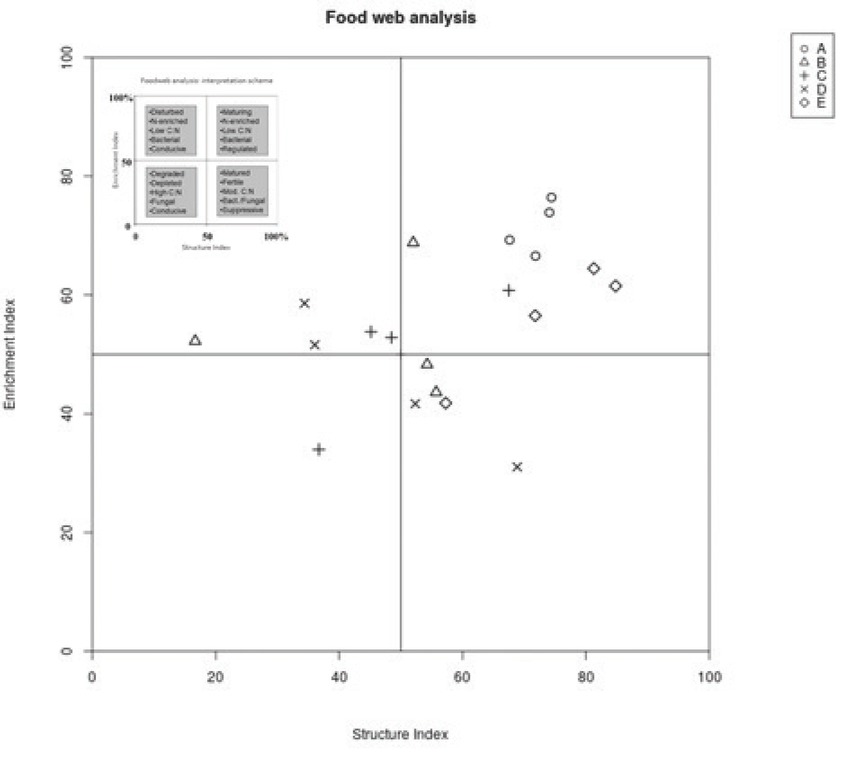
Figure 3
Plots of enrichment vs. structure indices associated with investigated alluvial meadows along the Litavka River contaminated by heavy metals in the vicinity of the Příbram mine pollution sources. A – control; (B) meadow near waste sedimentation pond; (C) meadow near the heap of mine waste situated 680 m from (B); and (D) meadows near old bakery mill situated 3.7 km from (B) and (E) meadow close to village Jince situated 13.3 km from the pollution source.
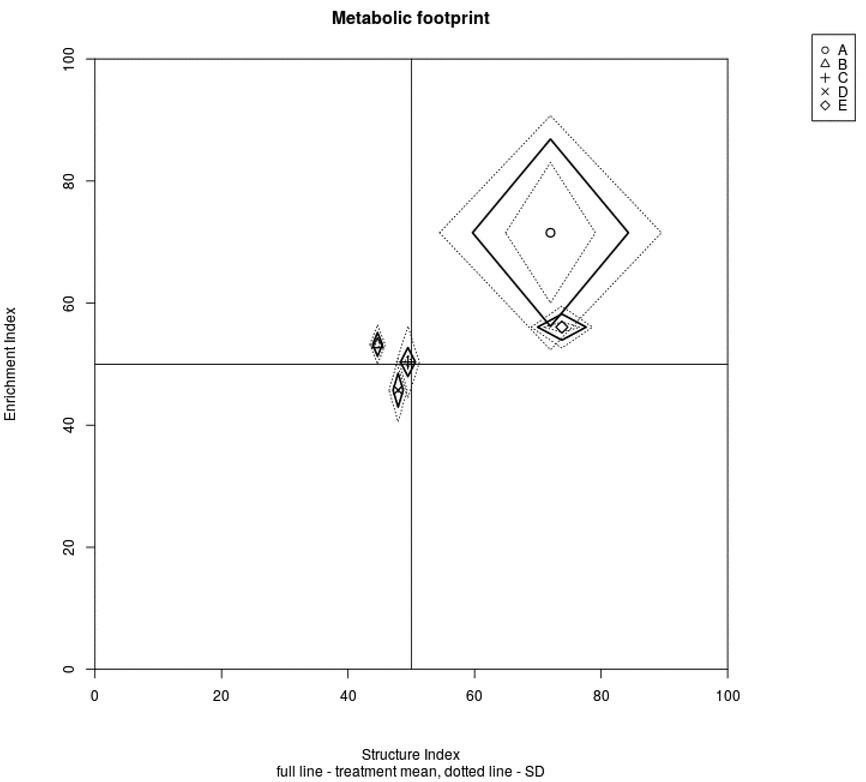
Figure 4
Functional metabolic footprints of nematode associated with investigated alluvial meadows along the Litavka River contaminated by heavy metals in the vicinity of the Příbram mine pollution sources. The vertical axis of each footprint represents the enrichment footprint and the horizontal axis represents the structural footprint. The x-axis coordinates of the metabolic footprint are calculated as SI – 0.5Fs/k and SI + 0.5Fs/k, where Fs is the sum of standardized C utilization by structure indicator taxa. The y-axis coordinates are calculated as EI – 0.5Fe/k and EI + 0.5 Fe/k, where Fe is the sum of standardized C utilization by enrichment indicator taxa. The functional metabolic footprint is depicted by sequentially joining points: SI – 0.5 Fs/k, EI; SI, EI + 0.5 Fe/k; SI + 0.5 Fs/k, EI; SI, EI – 0.5 Fe/k; and SI – 0.5 Fs/k, EI. A – control; (B) meadow near waste sedimentation pond; (C) meadow near the heap of mine waste situated 680 m from (B); and (D) meadows near old bakery mill situated 3.7 km from (B) and (E) meadow close to village Jince situated 13.3 km from the pollution source.
Table 6
Spearman’s rank correlation coefficients between soil physico-chemical properties, heavy metals, and nematode parameters in the alluvial meadows in the vicinity of the Příbram mine along the Litavka River.
| As | Cd | Cr | Cu | Ni | Pb | Zn | pH/KCl | Ntot | Cox | SM | |
|---|---|---|---|---|---|---|---|---|---|---|---|
| Abundance | Ns | ns | ns | ns | ns | −0.862** | −0.748** | −0.659** | ns | ns | ns |
| No. genera | ns | ns | ns | ns | ns | ns | −0.451* | ns | ns | ns | ns |
| Ba1 | −0.524* | ns | ns | ns | ns | −0.599* | −0.482* | ns | ns | ns | ns |
| Ba2 | −0.633** | ns | ns | ns | ns | −0.826** | −0.859** | 0.467* | 0.561* | ns | ns |
| Ba3 | −0.489* | ns | ns | ns | 0.442* | −0.631** | −0.745** | ns | ns | ns | 0.412* |
| Ba4 | ns | ns | ns | ns | ns | −0.455* | ns | ns | ns | ns | ns |
| P3 | −0.583* | ns | −0.409* | −0.460* | ns | −0.741** | −0.692** | ns | ns | ns | ns |
| P4 | ns | ns | ns | ns | ns | ns | −0.423* | ns | ns | ns | ns |
| P5 | ns | ns | ns | −0.559* | ns | −0.699** | −0.711** | ns | ns | ns | 0.431* |
| Fu2 | −0.507* | ns | ns | ns | ns | −0.853** | −0.626** | −0.492* | ns | ns | ns |
| Fu3 | ns | ns | ns | ns | 0.455* | ns | ns | −0.522* | ns | ns | ns |
| Fu4 | −0.625** | ns | ns | −0.474* | ns | −0.769** | −0.834** | −0.439* | ns | ns | ns |
| Om3 | ns | ns | ns | ns | ns | ns | ns | ns | ns | ns | ns |
| Om4 | −0.569* | ns | ns | ns | ns | −0.845** | −0.869** | ns | −0.422* | ns | ns |
| Om5 | −0.725** | ns | ns | ns | ns | −0.766** | −0.683** | −0.426* | −0.445* | ns | ns |
| Pp2 | ns | ns | ns | ns | ns | −0.432* | −0.457* | ns | ns | ns | ns |
| Pp3 | ns | ns | ns | 0.466* | 0.529* | ns | 0.513* | ns | ns | ns | 0.436* |
| Pp4 | ns | ns | ns | ns | ns | ns | ns | ns | ns | ns | ns |
| Pp5 | ns | ns | ns | ns | ns | ns | ns | ns | ns | ns | ns |
| H´spp | ns | ns | ns | −0.425* | ns | −0.722** | −0.634** | ns | ns | ns | ns |
| MI | ns | ns | ns | ns | ns | −0.584** | −0.605** | 0.433* | ns | ns | ns |
| MI (2–5) | ns | ns | ns | ns | ns | ns | −0.552* | ns | ns | ns | ns |
| PPI | ns | ns | ns | ns | ns | ns | ns | ns | ns | ns | ns |
| CI | ns | ns | ns | ns | ns | ns | ns | ns | ns | ns | ns |
| EI | ns | ns | ns | ns | ns | −0.439* | ns | ns | ns | ns | ns |
| SI | −0.548* | ns | ns | ns | ns | −0.658** | −0.742** | ns | ns | ns | ns |