
Table 1
Nematode ecological indices, c-p groups, and interpretation.
| Index name | Abbreviation | c-p nematodesa | Indication (high value)b |
|---|---|---|---|
| Maturity | MI | 1–5 | Stable/enriched environment |
| Enrichment | EI | 1–2 | Enriched environment |
| Structure | SI | 3–5 | High food web complexity |
| Channel | CI | 1–2 | Fungal-dominated decomposition |
| Basal | BI | 2 | Stressed/degraded environment |
[i] aBased on weighted proportions of colonizer-persister series included in calculation of index (Bongers and Bongers, 1998).
bHigh value as an indication of environmental status (Ferris et al., 2001).
BI, Basal Index; CI, Channel Index; EI, Enrichment Index; MI, Maturity Index; SI, Structure Index.
Table 2
Effects of irrigation, crop phase, and nematicide application on fungivore population density in 2017 and 2018.
| Pix | Pm | Pf | Pi | Pm | Pf | |
|---|---|---|---|---|---|---|
| Irrigation | ||||||
| Irrigated | 189a | 150 | 131 | 236 | 172 | 256 |
| Rainfed | 103b | 140 | 142 | 254 | 176 | 240 |
| Crop phasey | ||||||
| CS | 224A | 178 | 79B | 286 | 153 | 220 |
| C1 | 104B | 129 | 81B | 221 | 182 | 244 |
| C2 | 110B | 129 | 249A | 228 | 186 | 281 |
| Nematicide | ||||||
| Without fluopyram | 147 | 141 | 132 | 259 | 140 | 270 |
| With fluopyram | 144 | 149 | 141 | 231 | 208 | 226 |
| ANOVA (P-values) | ||||||
| Irrigation (I) | 0.04* | 0.85 | 0.20 | 0.42 | 0.91 | 0.51 |
| Crop (C) | 0.02* | 0.33 | <0.01** | 0.50 | 0.75 | 0.84 |
| I × C | 0.48 | 0.26 | 0.45 | 0.32 | 0.63 | 0.96 |
| Nematicide (N) | 0.94 | 0.66 | 0.75 | 0.38 | 0.08 | 0.11 |
| I × N | 0.77 | 0.14 | 0.71 | 0.43 | 0.40 | 0.13 |
| C × N | 0.93 | <0.01** | 0.86 | 0.79 | 0.64 | 0.37 |
| I × C × N | 0.95 | 0.06 | 0.44 | 0.68 | 0.86 | 0.85 |
[i] Different letters in columns denote means separation for significant (P ≤ 0.05) main effects of irrigation, crop phase, or nematicide using Fisher’s LSD test (P ≤ 0.05).
xPi, Pm, and Pf are mean nematode population densities (per 100 cm3 soil) prior to planting, at midseason (52 d and 56 d after planting in 2017 and 2018), and at harvest (150 d and 151 d after planting in 2017 and 2018), respectively.
yC1 and C2 are first- and second-year conventional cotton, respectively, with previous 1 yr peanut; CS is sod-based cotton with previous 1 yr peanut with previous 2 yr bahiagrass.
* and ** represent significant effects at P ≤ 0.05 and P ≤ 0.01, respectively.
LSD, least significant difference.
Table 3
Effects of irrigation, crop phase, and nematicide application on bacterivore population density in 2017 and 2018.
| Pix | Pm | Pf | Pi | Pm | Pf | |
|---|---|---|---|---|---|---|
| Irrigation | ||||||
| Irrigated | 730 | 387 | 151 | 726 | 525 | 314 |
| Rainfed | 602 | 430 | 196 | 898 | 608 | 516 |
| Crop phasey | ||||||
| CS | 798 | 431 | 84B | 824 | 518 | 355 |
| C1 | 692 | 333 | 70B | 808 | 505 | 432 |
| C2 | 507 | 461 | 367A | 804 | 675 | 458 |
| Nematicide | ||||||
| Without fluopyram | 718 | 433 | 176 | 828 | 538 | 414 |
| With fluopyram | 614 | 383 | 172 | 797 | 595 | 416 |
| ANOVA (P-values) | ||||||
| Irrigation (I) | 0.35 | 0.41 | 0.23 | 0.37 | 0.23 | 0.13 |
| Crop (C) | 0.39 | 0.34 | <0.01** | 0.99 | 0.55 | 0.72 |
| I × C | 0.78 | 0.15 | 0.23 | 0.36 | 0.27 | 0.31 |
| Nematicide (N) | 0.14 | 0.27 | 0.93 | 0.80 | 0.55 | 0.98 |
| I × N | 0.21 | 0.67 | 0.79 | 0.29 | 0.86 | 0.13 |
| C × N | 0.31 | 0.02* | 0.62 | 0.94 | 0.36 | 0.03 |
| I × C × N | 0.07 | 0.90 | 0.38 | 0.71 | 0.24 | 0.51 |
[i] Different letters in columns denote means separation for significant (P ≤ 0.05) main effects of irrigation, crop phase, or nematicide using Fisher’s LSD test (P ≤ 0.05).
xPi, Pm, and Pf are mean nematode population densities (per 100 cm3 soil) prior to planting, at midseason (52 d and 56 d after planting in 2017 and 2018), and at harvest (150 d and 151 d after planting in 2017 and 2018), respectively.
yC1 and C2 are first- and second-year conventional cotton, respectively, with previous 1 yr peanut; CS is sod-based cotton with previous 1 yr peanut with previous 2 yr bahiagrass.
* and ** represent significant effects at P ≤ 0.05 and P ≤ 0.01, respectively.
LSD, least significant difference.
Table 4
Effects of irrigation, crop phase, and nematicide application on omnivore population density in 2017 and 2018.
| Pix | Pm | Pf | Pi | Pm | Pf | |
|---|---|---|---|---|---|---|
| Irrigation | ||||||
| Irrigated | 19 | 76a | 18 | 55 | 58 | 58 |
| Rainfed | 14 | 60b | 12 | 64 | 50 | 45 |
| Crop phasey | ||||||
| CS | 22 | 58 | 23 | 44 | 63 | 25 |
| C1 | 22 | 84 | 9 | 73 | 38 | 59 |
| C2 | 5 | 62 | 13 | 62 | 61 | 69 |
| Nematicide | ||||||
| Without fluopyram | 17 | 87 | 17 | 80a | 71a | 84a |
| With fluopyram | 15 | 48 | 13 | 39b | 37b | 19b |
| ANOVA (P-values) | ||||||
| Irrigation (I) | 0.59 | 0.04* | 0.30 | 0.86 | 0.45 | 0.11 |
| Crop (C) | 0.18 | 0.67 | 0.17 | 0.63 | 0.59 | 0.53 |
| I × C | 0.40 | 0.97 | 0.63 | 0.35 | 0.73 | 0.91 |
| Nematicide (N) | 0.72 | 0.07 | 0.40 | 0.04* | <0.01** | <0.01** |
| I × N | 0.12 | 0.74 | 0.06 | 0.66 | 0.25 | 0.74 |
| C × N | 0.66 | 0.38 | 0.27 | 0.18 | 0.43 | <0.01** |
| I × C × N | 0.02 | 0.48 | 0.70 | 0.61 | 0.97 | 0.43 |
[i] Different letters in columns denote means separation for significant (P ≤ 0.05) main effects of irrigation, crop phase, or nematicide using Fisher’s LSD test (P ≤ 0.05).
xPi, Pm, and Pf are mean values of nematode ecological indices prior to planting, at midseason (52 d and 56 d after planting in 2017 and 2018), and at harvest (150 d and 151 d after planting in 2017 and 2018), respectively.
yC1 and C2 are first- and second-year conventional cotton, respectively, with previous 1 yr peanut; CS is sod-based cotton with previous 1 yr peanut with previous 2 yr bahiagrass.
* and ** represent significant effects at P ≤ 0.05 and P ≤ 0.01, respectively.
MI, Maturity Index; LSD, least significant difference.
Table 5
Effects of irrigation, crop phase, and nematicide application on BI in 2017 and 2018.
| Pix | Pm | Pf | Pi | Pm | Pf | |
|---|---|---|---|---|---|---|
| Irrigation | ||||||
| Irrigated | 30 | 28b | 38 | 35 | 37 | 36 |
| Rainfed | 26 | 33a | 43 | 42 | 42 | 43 |
| Crop phasey | ||||||
| CS | 22B | 25 | 32 | 37 | 35 | 41 |
| C1 | 21B | 28 | 40 | 35 | 38 | 40 |
| C2 | 41A | 38 | 50 | 44 | 46 | 37 |
| Nematicide | ||||||
| Without fluopyram | 25 | 30 | 38 | 36 | 39 | 37 |
| With fluopyram | 31 | 30 | 44 | 41 | 40 | 42 |
| ANOVA (P-values) | ||||||
| Irrigation (I) | 0.32 | 0.05* | 0.62 | 0.28 | 0.31 | 0.44 |
| Crop (C) | 0.03* | 0.11 | 0.16 | 0.40 | 0.30 | 0.85 |
| I × C | 0.66 | 0.85 | 0.66 | 0.22 | 0.90 | 0.98 |
| Nematicide (N) | 0.15 | 0.98 | 0.29 | 0.25 | 0.84 | 0.34 |
| I × N | 0.69 | 0.87 | 0.15 | 0.66 | 0.70 | 0.30 |
| C × N | 0.24 | 0.29 | 0.06 | 0.92 | 0.01** | 0.24 |
| I × C × N | 0.35 | 0.55 | 0.46 | 0.37 | 0.65 | 0.84 |
[i] Different letters in columns denote means separation for significant (P ≤ 0.05) main effects of irrigation, crop phase, or nematicide using Fisher’s LSD test (P ≤ 0.05).
xPi, Pm, and Pf are mean values of nematode ecological indices prior to planting, at midseason (52 d and 56 d after planting in 2017 and 2018), and at harvest (150 d and 151 d after planting in 2017 and 2018), respectively.
yC1 and C2 are first- and second-year conventional cotton, respectively, with previous 1 yr peanut; CS is sod-based cotton with previous 1 yr peanut with previous 2 yr bahiagrass.
* and ** represent significant effects at P ≤ 0.05 and P ≤ 0.01, respectively.
LSD, least significant difference; BI, Basal Index.
Table 6
Effects of irrigation, crop phase, and nematicide application on EI in 2017 and 2018.
| Pix | Pm | Pf | Pi | Pm | Pf | |
|---|---|---|---|---|---|---|
| Irrigation | ||||||
| Irrigated | 66 | 56 | 46 | 53 | 46 | 48 |
| Rainfed | 71 | 53 | 43 | 40 | 38 | 47 |
| Crop phasey | ||||||
| CS | 76A | 65A | 45 | 52 | 47 | 48 |
| C1 | 75A | 58AB | 43 | 47 | 44 | 44 |
| C2 | 54B | 40B | 45 | 40 | 34 | 51 |
| Nematicide | ||||||
| Without fluopyram | 70 | 54 | 46 | 49 | 38 | 47 |
| With fluopyram | 67 | 54 | 43 | 44 | 45 | 48 |
| ANOVA (P-values) | ||||||
| Irrigation (I) | 0.30 | 0.71 | 0.75 | 0.16 | 0.25 | 0.98 |
| Crop (C) | 0.02* | 0.01** | 0.99 | 0.34 | 0.13 | 0.55 |
| I × C | 0.74 | 0.99 | 0.64 | 0.12 | 0.24 | 0.72 |
| Nematicide (N) | 0.40 | 0.98 | 0.61 | 0.32 | 0.07 | 0.72 |
| I × N | 0.77 | 0.88 | 0.88 | 0.51 | 0.92 | 0.51 |
| C × N | 0.43 | 0.91 | 0.38 | 0.63 | 0.02* | 0.58 |
| I × C × N | 0.23 | 0.91 | 0.68 | 0.17 | 0.92 | 0.19 |
[i] Different letters in columns denote means separation for significant (P ≤ 0.05) main effects of irrigation, crop phase, or nematicide using Fisher’s LSD test (P ≤ 0.05).
xPi, Pm, and Pf are mean values of nematode ecological indices prior to planting, at midseason (52 d and 56 d after planting in 2017 and 2018), and at harvest (150 d and 151 d after planting in 2017 and 2018), respectively.
yC1 and C2 are first- and second-year conventional cotton, respectively, with previous 1 yr peanut; CS is sod-based cotton with previous 1 yr peanut with previous 2 yr bahiagrass.
* and ** represent significant effects at P ≤ 0.05 and P ≤ 0.01, respectively.
EI, Enrichment Index; LSD, least significant difference.
Table 7
Effects of irrigation, crop phase, and nematicide application on MI in 2017 and 2018.
| Pix | Pm | Pf | Pi | Pm | Pf | |
|---|---|---|---|---|---|---|
| Irrigation | ||||||
| Irrigated | 1.84 | 2.23 | 2.33 | 2.09 | 2.19 | 2.25 |
| Rainfed | 1.71 | 2.17 | 2.24 | 2.13 | 2.21 | 2.08 |
| Crop phasey | ||||||
| CS | 1.71 | 2.09 | 2.46 | 2.02 | 2.21 | 2.09 |
| C1 | 1.73 | 2.27 | 2.45 | 2.17 | 2.19 | 2.24 |
| C2 | 1.88 | 2.23 | 1.97 | 2.13 | 2.20 | 2.16 |
| Nematicide | ||||||
| Without fluopyram | 1.77 | 2.25 | 2.31 | 2.12 | 2.26a | 2.27a |
| With fluopyram | 1.78 | 2.15 | 2.25 | 2.09 | 2.14b | 2.06b |
| ANOVA (P-values) | ||||||
| Irrigation (I) | 0.17 | 0.07 | 0.06 | 0.75 | 0.44 | 0.16 |
| Crop (C) I × C | 0.23 0.84 | 0.07 0.91 | 0.16 0.90 | 0.25 0.73 | 0.95 0.59 | 0.58 0.81 |
| Nematicide (N) | 0.84 | 0.31 | 0.93 | 0.41 | 0.02* | <0.01** |
| I × N | 0.67 | 0.83 | 0.08 | 0.27 | 0.77 | 0.35 |
| C × N | 0.45 | 0.28 | 0.61 | 0.08 | 0.30 | 0.01** |
| I × C × N | 0.14 | 0.80 | 0.64 | 0.17 | 0.61 | 0.22 |
[i] Different letters in columns denote means separation for significant (P ≤ 0.05) main effects of irrigation, crop phase, or nematicide using Fisher’s LSD test (P ≤ 0.05).
xPi, Pm, and Pf are mean nematode population densities (per 100 cm3 soil) prior to planting, at midseason (52 d and 56 d after planting in 2017 and 2018), and at harvest (150 d and 151 d after planting in 2017 and 2018), respectively.
yC1 and C2 are first- and second-year conventional cotton, respectively, with previous 1 yr peanut; CS is sod-based cotton with previous 1 yr peanut with previous 2 yr bahiagrass.
* and ** represent significant effects at P ≤ 0.05 and P ≤ 0.01, respectively.
LSD, least significant difference.
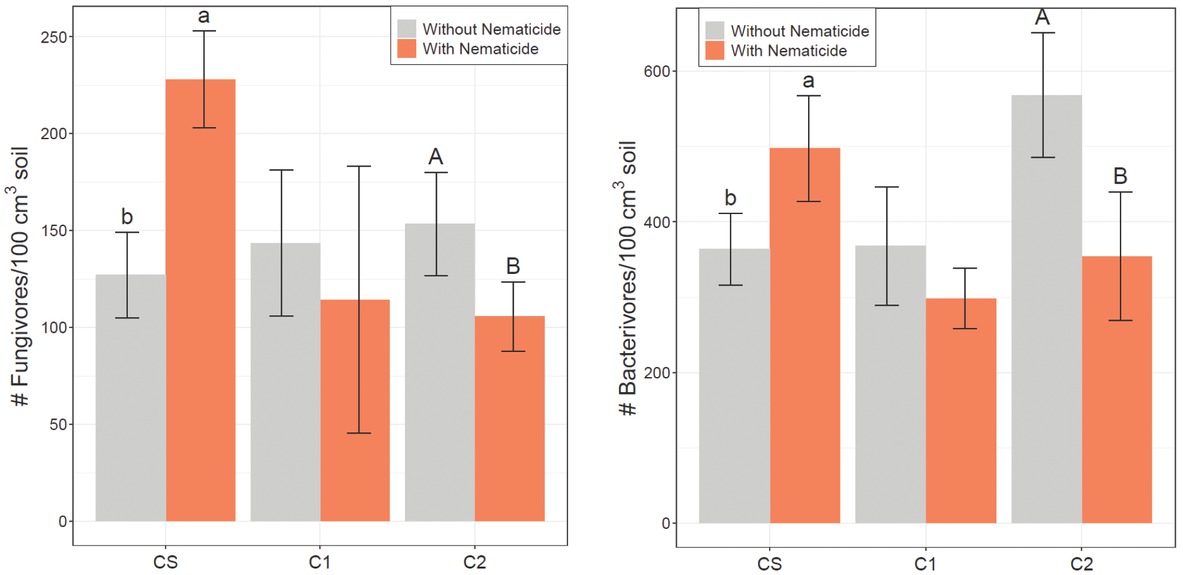
Figure 1
Fungivore (left) and bacterivore (right) population density (nematodes/100 cm3 soil) in midseason 2017 soil samples. CS is the cotton phase of the sod-based rotation, C1 is first-year conventional cotton, and C2 is second-year conventional cotton. Without Nematicide and With Nematicide refer to absence or presence of fluopyram, respectively. Different letters denote significant differences between nematicide treatments within crop phase (Fisher’s LSD, P ≤ 0.05). LSD, least significant difference.
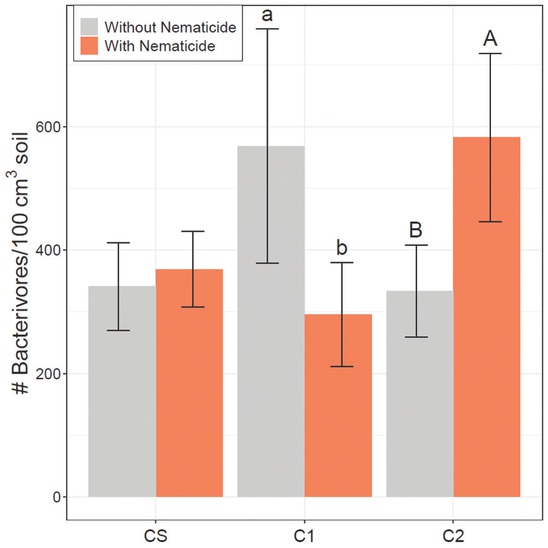
Figure 2
Bacterivore population density (nematodes/100 cm3 soil) in harvest 2018 (right) soil samples. CS is the cotton phase of the sod-based rotation, C1 is first-year conventional cotton, and C2 is second-year conventional cotton. Without Nematicide and With Nematicide refer to absence or presence of fluopyram, respectively. Different letters denote significant differences between nematicide treatments within crop phase (Fisher’s LSD, P ≤ 0.05). LSD, least significant difference.
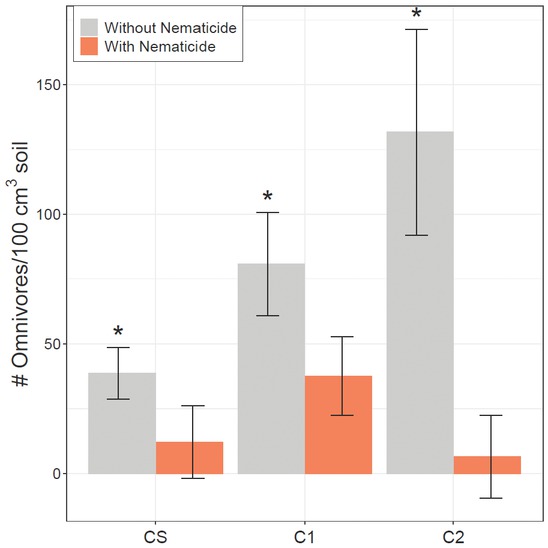
Figure 3
Omnivore population density (nematodes/100 cm3 soil) in harvest 2018 soil samples. CS is the cotton phase of the sod-based rotation, C1 is first-year conventional cotton, and C2 is second-year conventional cotton. Without Nematicide and With Nematicide refer to absence or presence of fluopyram, respectively. * indicates significant nematicide effect within the given crop (Fisher’s LSD, P ≤ 0.05). LSD, least significant difference.
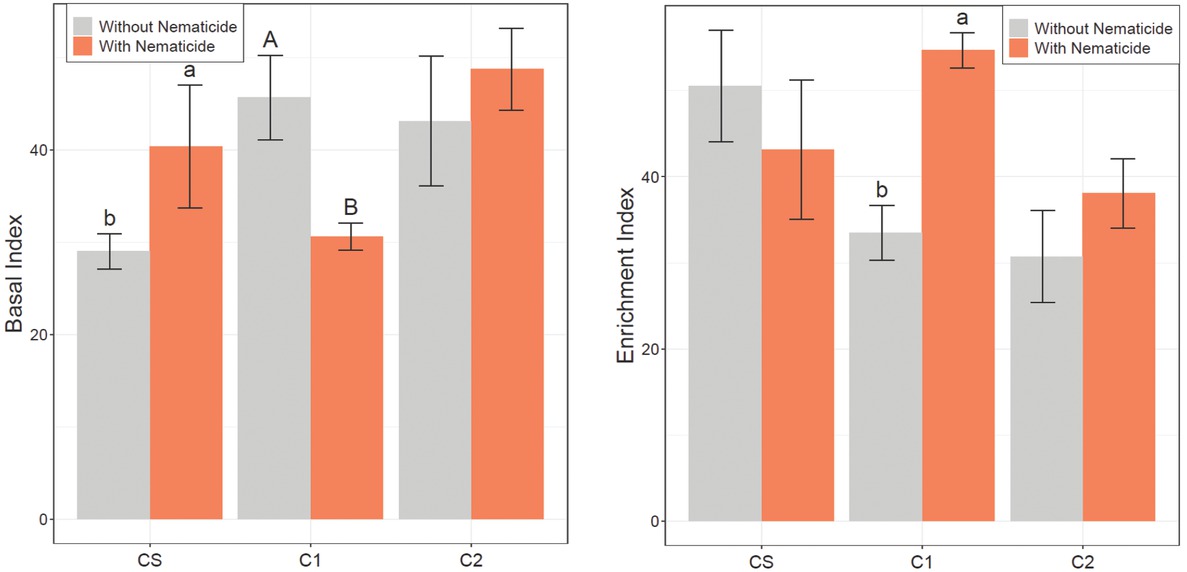
Figure 4
Basal Index (left) and EI (right) based on midseason 2018 soil samples. CS is the cotton phase of the sod-based rotation, C1 is first-year conventional cotton, and C2 is second-year conventional cotton. Without Nematicide and With Nematicide refer to absence or presence of fluopyram, respectively. Different letters denote significant differences between nematicide treatments within crop phase (Fisher’s LSD, P ≤ 0.05). EI, Enrichment Index; LSD, least significant difference.
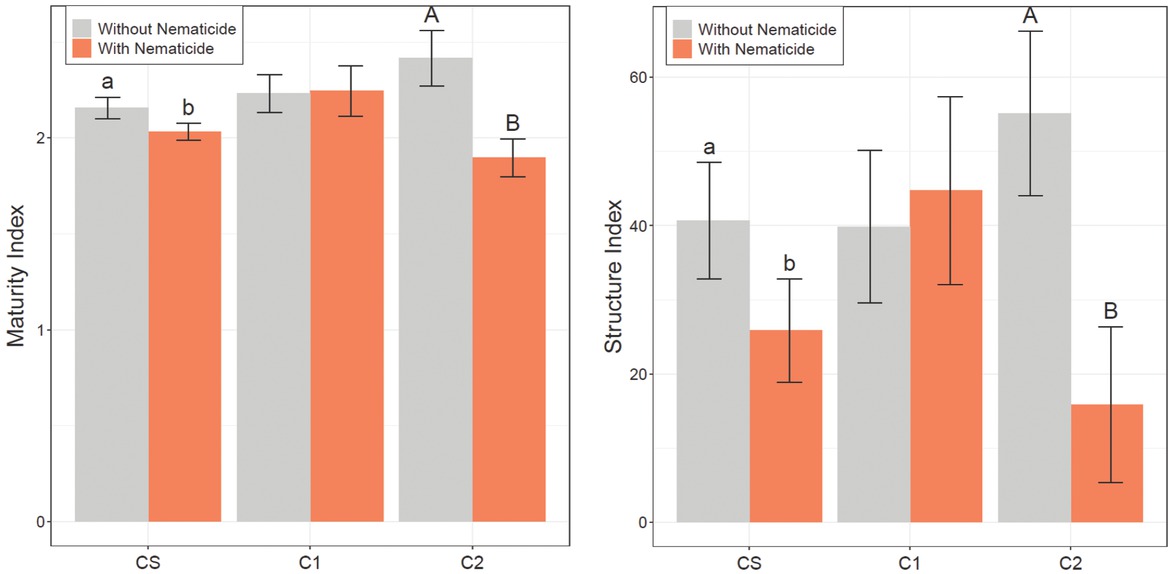
Figure 5
Maturity Index (left) and SI (right) based on harvest 2018 soil samples. CS is the cotton phase of the sod-based rotation, C1 is first-year conventional cotton, and C2 is second-year conventional cotton. Without Nematicide and With Nematicide refer to absence or presence of fluopyram, respectively. Different letters denote significant differences between nematicide treatments within crop phase (Fisher’s LSD, P ≤ 0.05). LSD, least significant difference; SI, Structure Index.