
Figure 1:
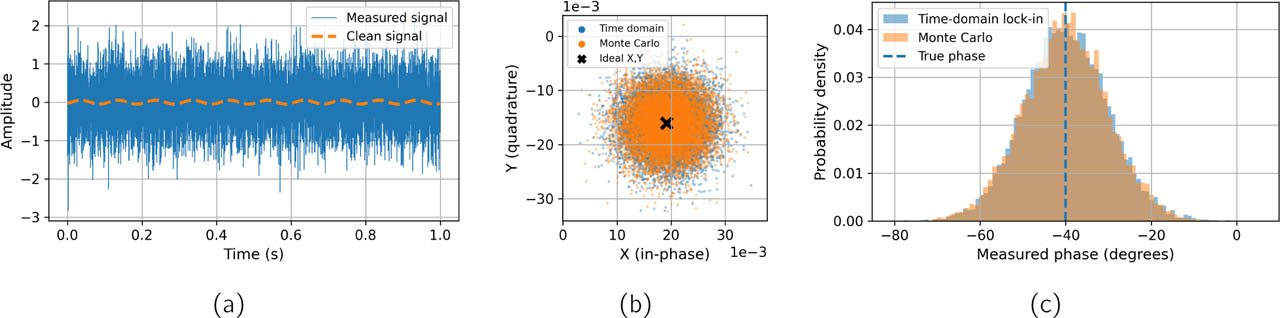
White-noise reference case. (a) 10 Hz signal (Asig = 0.05) with noise (σn = 0.6); the clean signal is dashed. (b) Lock-in outputs (X, Y ) and (c) measured phase from the time-domain simulation and the Monte Carlo model; the cross marks the noise-free point and the dashed line the true phase.
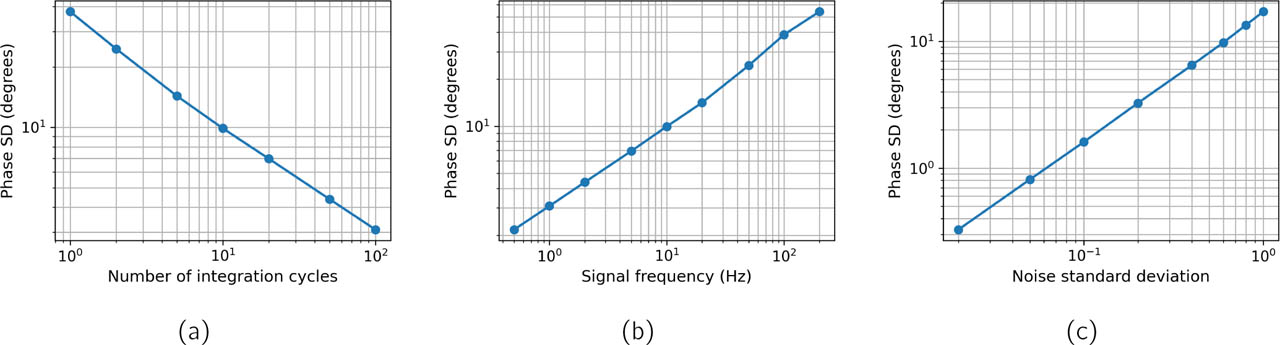
Figure 2:
White-noise case: standard deviation of the phase error as a function of (a) the number of integration cycles at 10 Hz, (b) the signal frequency with 10 cycles, and (c) the noise standard deviation at 10 Hz and 10 cycles.
Table 1:
Phase error versus SNR after demodulation (amplitude ratio; Monte Carlo, 200 000 simulated measurements per row). The last row is the limit SNRout → 0, i.e. a completely random phase.
| SNRout | Error SD (deg) | 95% of errors within (deg) | Errors > 90° (%) |
|---|---|---|---|
| 0.05 | 102 | ±170 | 48 |
| 0.1 | 100 | ±170 | 46 |
| 0.25 | 94 | ±168 | 40 |
| 0.5 | 84 | ±162 | 31 |
| 1 | 64 | ±140 | 16 |
| 2 | 35 | ±69 | 2.3 |
| 3 | 21 | ±41 | 0.1 |
| 5 | 12 | ±23 | 0 |
| 10 | 5.8 | ±11 | 0 |
| 20 | 2.9 | ±5.6 | 0 |
| 100 | 0.57 | ±1.1 | 0 |
| → 0 (random) | 104 | ±171 | 50 |
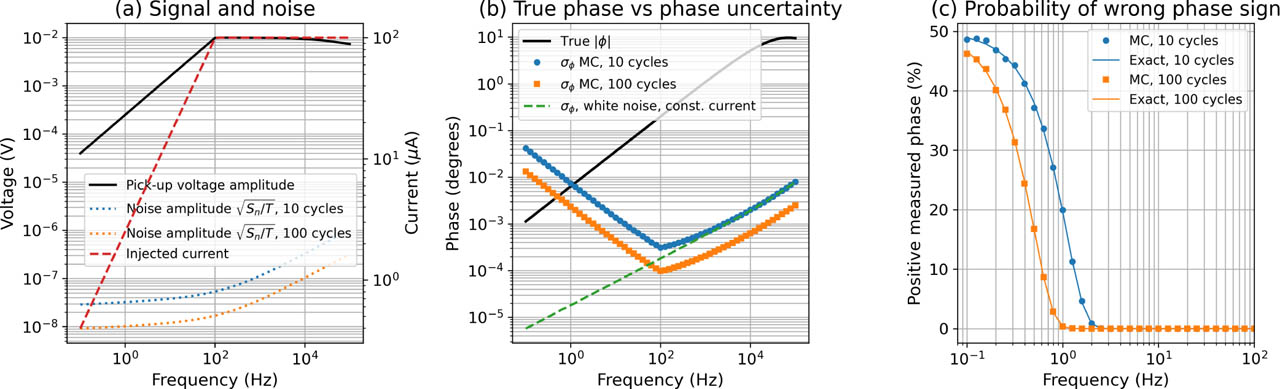
Figure 3:
Low-frequency tetrapolar measurement. (a) Pick-up voltage, noise amplitude after averaging over 10 and 100 cycles (left axis) and injected current (right axis). (b) True phase magnitude and standard deviation of the phase error for 10 and 100 cycles (markers: Monte Carlo; lines: Eq. (3)), and for constant current with white noise. (c) Fraction of measurements with a positive (wrong-sign) phase (markers: Monte Carlo; lines: Eq. (4)).
Table 2:
Sensitivity analysis (10 cycles): true phase at 1 Hz, percentage of positive phases at 1 and 0.1 Hz, and the highest frequency f1% where this exceeds 1%.
| Case | ϕ1 Hz (deg) | P1 Hz (%) | P0.1 Hz (%) | f1% (Hz) |
|---|---|---|---|---|
| Reference | −0.006 | 20 | 49 | 2.0 |
| |Ze (1 Hz)| = 100 kΩ | −0.006 | < 0.1 | 44 | 0.56 |
| |Ze (1 Hz)| = 2.5 MΩ | −0.006 | 46 | 50 | 8.7 |
| Electrode noise power ×10 | −0.006 | 36 | 50 | 3.6 |
| Amp. 3 nV, corner 5 Hz | −0.006 | 12 | 48 | 1.6 |
| Amp. 30 nV | −0.006 | 35 | 50 | 3.3 |
| Compliance 10 V | −0.006 | < 0.1 | 46 | 0.77 |
| Dispersion 1 Ω | −0.089 | < 0.1 | 31 | 0.30 |
| Dispersion 10 Ω | −0.77 | < 0.1 | < 0.1 | 0.06 |