
Table 1:
Comparison of the present study with selected prior works on low-cost sEMG prosthetic systems. NR = Not Reported.
| Study | Sensor | Ch. | Gest. | Classifiers | Real Data | Cost |
|---|---|---|---|---|---|---|
| Gusman et al. [19] | MyoWare | 1 | 2 | Threshold | No | NR |
| Tavakoli et al. [21] | Custom | 2 | 4 | SVM | No | NR |
| Atzori et al. [28] | Otto Bock | 12 | 50 | CNN | No | NR |
| Côté-Allard et al. [15] | Myo Armband | 8 | 7 | CNN+TL | Partial | NR |
| Prakash et al. [30] | FMG (pressure) | 1 | 6 | Fuzzy control | Yes | NR |
| Sravya et al. [31] | MyoWare | 1 | 3 | SVM | No | NR |
| Present Study | MyoWare 1.0 | 1 | 3 | RF, SVM, KNN, 1D CNN, LSTM | Yes | $232 |
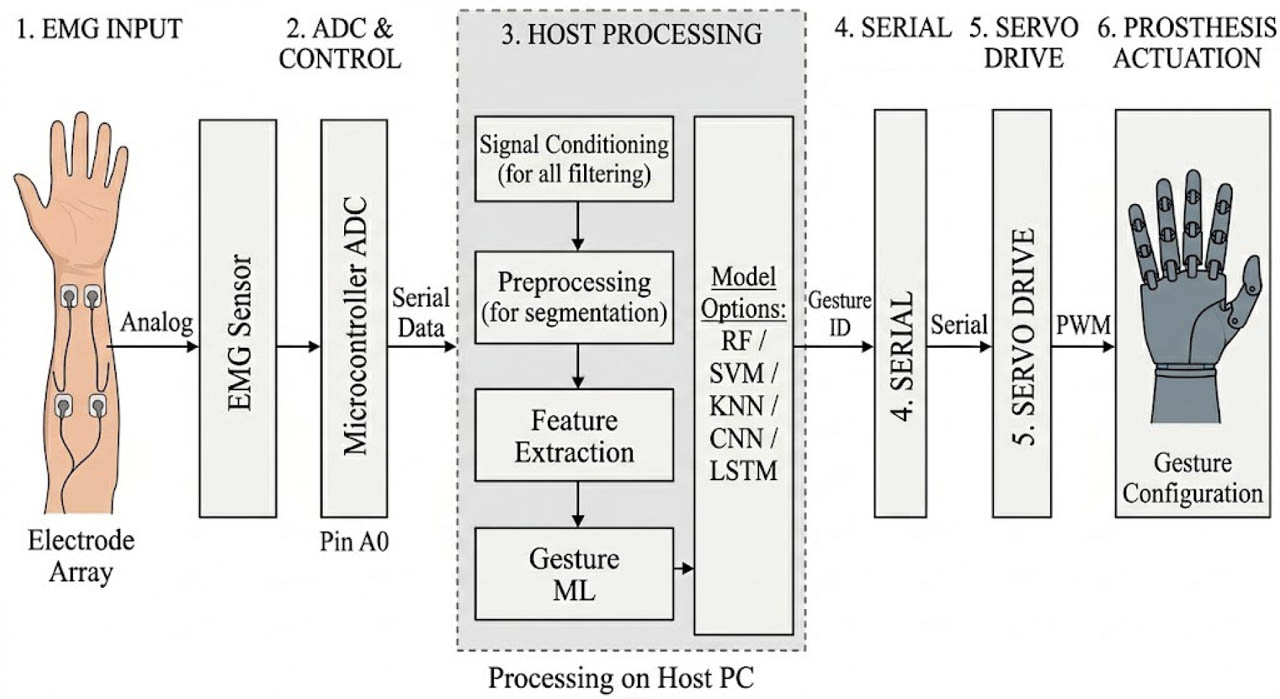
Figure 1:
End-to-end system architecture of the proposed low-cost, sEMG-controlled, 3D-printed prosthetic hand. The dashed box denotes processing performed on a host PC; all other blocks are embedded hardware.
Table 2:
Itemized component costs at representative unit prices. Depending on sourcing, the total system cost ranges from approximately USD 122 (optimized sourcing) to USD 232 (full retail).
| Component | Qty | Unit (USD) | Total (USD) |
|---|---|---|---|
| MyoWare 1.0 | 1 | 37.95 | 37.95 |
| Arduino Nano compatible clone | 1 | 4.50 | 4.50 |
| SG90 servo | 5 | 2.50 | 12.50 |
| PLA filament (1 kg spool) | 1 | 20.00 | 20.00 |
| Ag/AgCl electrodes (50 pack) | 1 | 8.00 | 8.00 |
| Breadboard, wires and connectors | 1 set | 6.00 | 6.00 |
| Nylon tendon line | 1 | 4.00 | 4.00 |
| PTFE tubing (1 m) | 2 | 2.50 | 5.00 |
| 5 V USB power bank | 1 | 8.00 | 8.00 |
| Printing electricity | – | – | 2.55 |
| Miscellaneous solder and screws | – | – | 10.00 |
| 2S lithium-ion pack, 7.4 V, 2000 mAh | 1 | 11.50 | 11.50 |
| LM2596 5 V buck module | 1 | 1.80 | 1.80 |
| 1000 μF and 100 nF capacitors | 1 set | 0.70 | 0.70 |
| Itemized total | 132.50 |
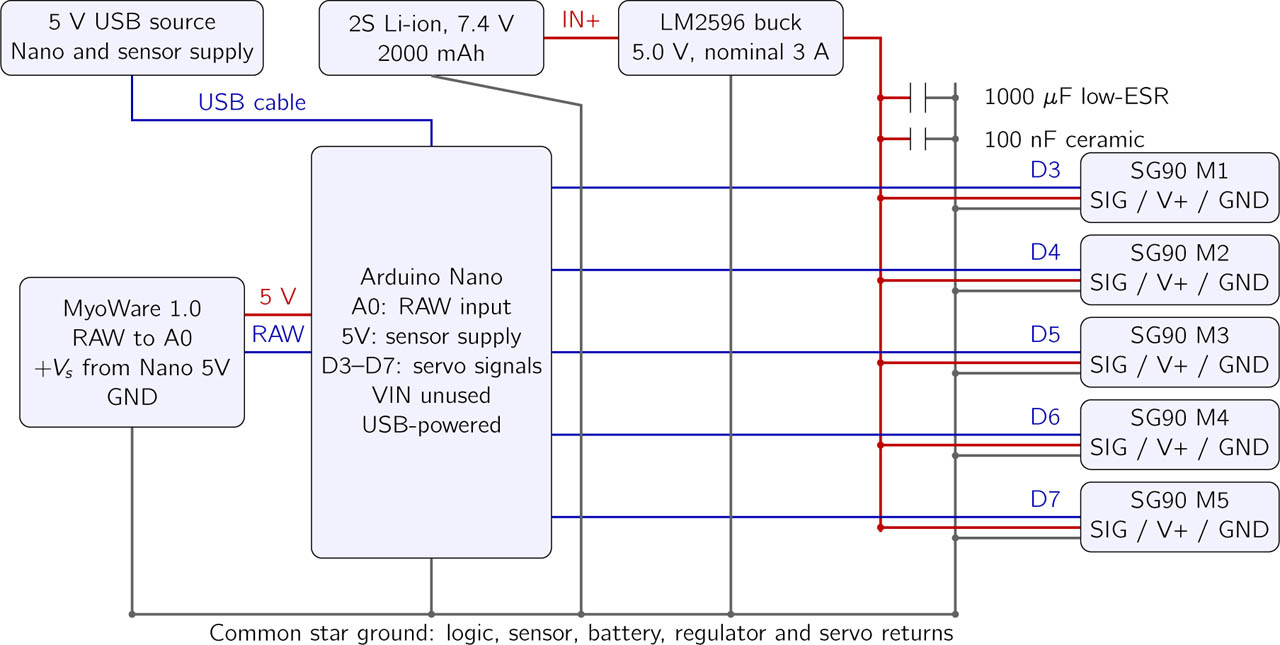
Figure 2:
Power wiring schematic. Separate logic and servo positive rails share a star-ground reference; the capacitors are connected in parallel across the servo supply. Dots indicate junctions; crossings without dots are unconnected.
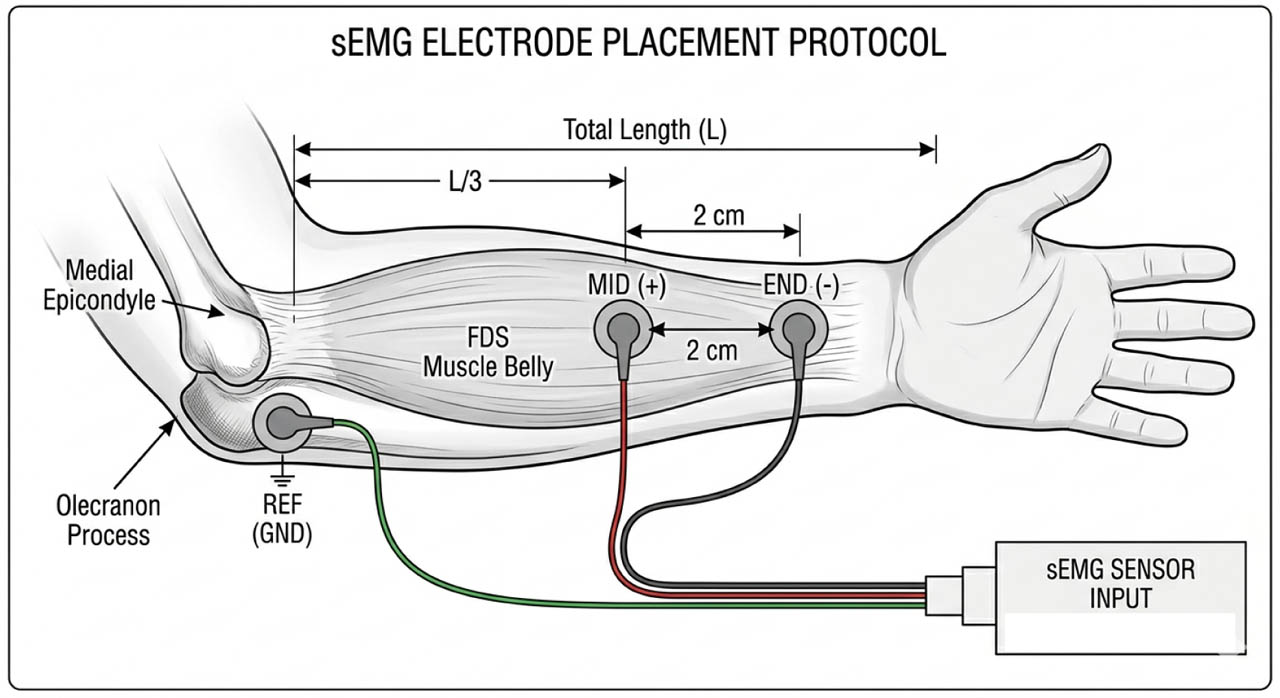
Figure 3:
Electrode placement protocol. The MID and END electrodes are positioned longitudinally on the flexor digitorum superficialis; the REF electrode is on the olecranon process.
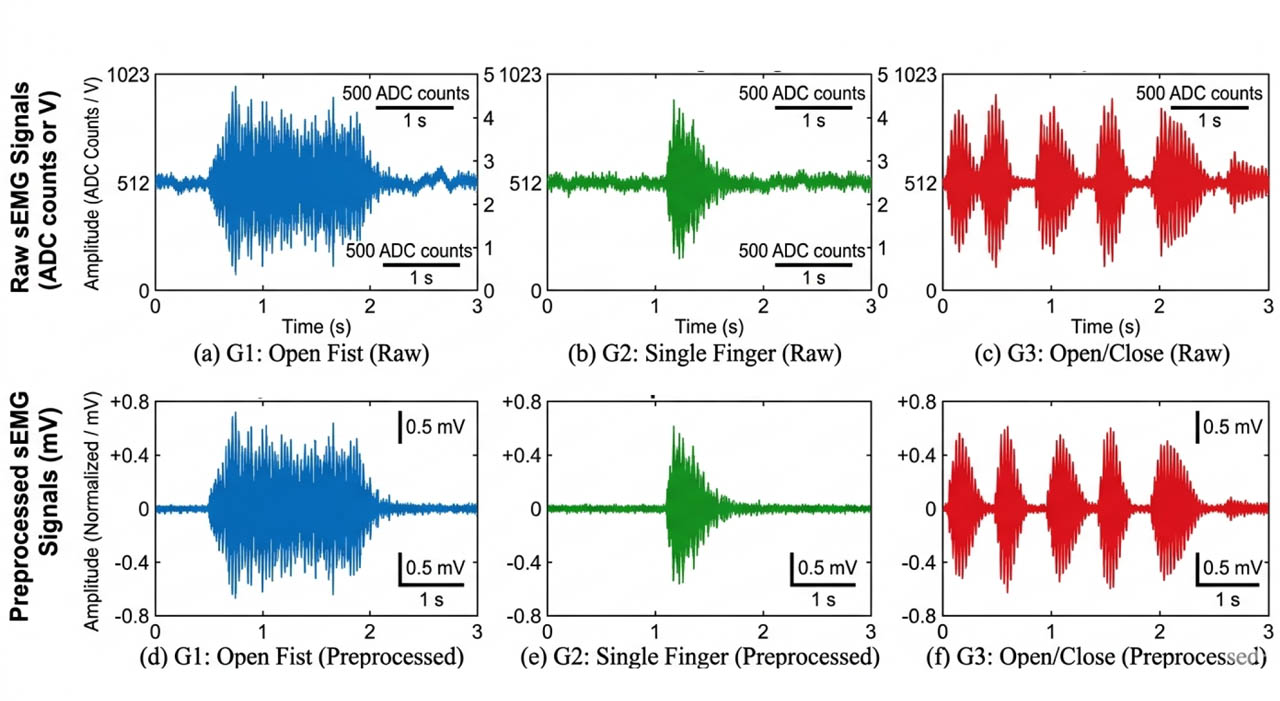
Figure 4:
Representative sEMG signals for the three gesture classes from Subject S1. Top row: raw sensor output. Bottom row: preprocessed signals after bandpass (20–450 Hz), notch (50 Hz), and DC offset removal.
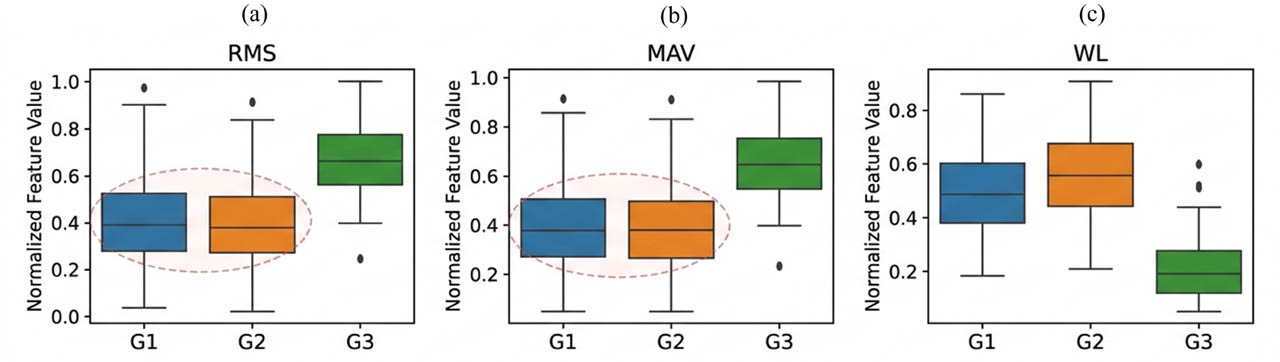
Figure 5:
Box plots of the amplitude features RMS, MAV and WL across the three gesture classes for the real-world live dataset. Substantial overlap between G1 and G2 is visible, particularly in the MAV and RMS distributions.
Table 3:
Classification performance on the synthetic dataset (mean ± SD across 10 folds).
| Classifier | Acc. (%) | Prec. (%) | Rec. (%) | F1 (%) | κ |
|---|---|---|---|---|---|
| Random Forest | 96.2 ± 1.8 | 96.4 | 96.1 | 96.2 | 0.943 |
| SVM | 94.5 ± 2.3 | 94.7 | 94.4 | 94.5 | 0.917 |
| KNN | 92.8 ± 2.7 | 92.9 | 92.6 | 92.7 | 0.892 |
| 1D CNN | 95.8 ± 1.5 | 95.9 | 95.7 | 95.8 | 0.937 |
| LSTM | 93.4 ± 3.1 | 93.6 | 93.2 | 93.4 | 0.901 |
Table 4:
Classification performance on the Ninapro DB5 subset (LOSO cross-validation).
| Classifier | Acc. (%) | Prec. (%) | Rec. (%) | F1 (%) | κ |
|---|---|---|---|---|---|
| Random Forest | 82.4 ± 5.6 | 82.8 | 82.1 | 82.4 | 0.736 |
| SVM | 79.1 ± 6.2 | 79.5 | 78.8 | 79.1 | 0.687 |
| KNN | 75.3 ± 7.1 | 75.8 | 74.9 | 75.3 | 0.630 |
| 1D CNN | 80.6 ± 5.8 | 80.9 | 80.3 | 80.6 | 0.709 |
| LSTM | 77.2 ± 6.9 | 77.6 | 76.8 | 77.2 | 0.658 |
Table 5:
Classification performance on the real-world live dataset (LOSO cross-validation).
| Classifier | Acc. (%) | Prec. (%) | Rec. (%) | F1 (%) | κ |
|---|---|---|---|---|---|
| Random Forest | 68.7 ± 7.8 | 69.2 | 68.4 | 68.8 | 0.531 |
| SVM | 57.3 ± 9.1 | 57.8 | 56.9 | 57.3 | 0.360 |
| KNN | 54.1 ± 10.2 | 54.6 | 53.7 | 54.1 | 0.312 |
| 1D CNN | 60.7 ± 7.9 | 60.7 | 60.7 | 60.7 | 0.410 |
| LSTM | 52.9 ± 11.4 | 53.4 | 52.5 | 52.9 | 0.294 |
Table 6:
Normalised confusion matrix (%) for Random Forest on real-world live data.
| Pred. G1 | Pred. G2 | Pred. G3 | |
|---|---|---|---|
| Actual G1 (Open Fist) | 73.2 | 15.1 | 11.7 |
| Actual G2 (Single Finger) | 19.8 | 59.4 | 20.8 |
| Actual G3 (Open/Close) | 8.6 | 17.9 | 73.5 |
Table 7:
Normalised confusion matrix (%) for 1D CNN on real-world live data.
| Pred. G1 | Pred. G2 | Pred. G3 | |
|---|---|---|---|
| Actual G1 (Open Fist) | 60.4 | 19.8 | 19.8 |
| Actual G2 (Single Finger) | 19.8 | 60.4 | 19.8 |
| Actual G3 (Open/Close) | 19.6 | 19.1 | 61.3 |
Table 8:
Summary of accuracy (%) across all three dataset conditions. Δ denotes the absolute accuracy drop from synthetic to real-world data.
| Classifier | Synthetic | Online | Real-World | Δ (Synth → Real) |
|---|---|---|---|---|
| Random Forest | 96.2 | 82.4 | 68.7 | −27.5 |
| SVM | 94.5 | 79.1 | 57.3 | −37.2 |
| KNN | 92.8 | 75.3 | 54.1 | −38.7 |
| 1D CNN | 95.8 | 80.6 | 60.7 | −35.1 |
| LSTM | 93.4 | 77.2 | 52.9 | −40.5 |
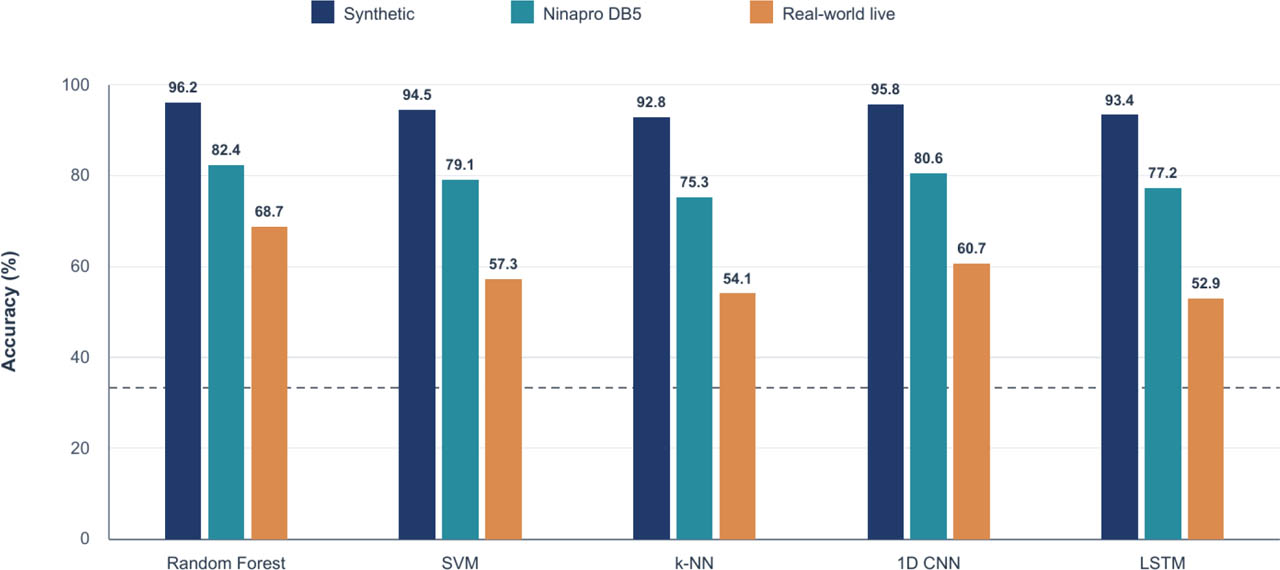
Figure 6:
Classification accuracy (%) for the five evaluated classifiers across synthetic, Ninapro DB5 and live datasets. Bar heights and labels reproduce Tables 3–5 and 8. The dashed line marks 33.3% chance. RF had the smallest synthetic-to-live decrease (27.5 pp), and LSTM the largest (40.5 pp).
Table 9:
Robustness Degradation Index (RDI) for all classifiers. Achance = 33.3%. Lower RDI indicates greater robustness.
| Classifier | Asynth (%) | Areal (%) | ΔA (pp) | RDI (%) |
|---|---|---|---|---|
| Random Forest | 96.2 | 68.7 | 27.5 | 43.7 |
| SVM | 94.5 | 57.3 | 37.2 | 60.8 |
| KNN | 92.8 | 54.1 | 38.7 | 65.0 |
| 1D CNN | 95.8 | 60.7 | 35.1 | 56.2 |
| LSTM | 93.4 | 52.9 | 40.5 | 67.4 |
Table 10:
Nemenyi post-hoc test: pairwise rank differences and significance (α = 0.05, CD = 1.929). Bold entries indicate statistically significant differences.
| 1D CNN | SVM | KNN | LSTM | |
|---|---|---|---|---|
| RF | 1.2 | 2.1 | 2.9 | 3.3 |
| 1D CNN | – | 0.9 | 1.7† | 2.1 |
| SVM | – | – | 0.8 | 1.2 |
| KNN | – | – | – | 0.4 |
Table 11:
Per-subject Random Forest accuracy (%) on real-world live data.
| Subj. | S1 | S2 | S3 | S4 | S5 | S6 | S7 | S8 | S9 | S10 | | | Mean ± SD |
| Acc. | 78.3 | 72.1 | 65.4 | 71.8 | 59.2 | 74.6 | 63.7 | 68.9 | 55.1 | 77.9 | | | 68.7 ± 7.8 |
Table 12:
Held-out permutation importance of the eight RF input features on real-world live data (mean accuracy decrease in pp over 10 LOSO folds, 20 permutations each).
| Feature | Mean decrease (pp) | Between-fold SD (pp) |
|---|---|---|
| WL | 7.4 | 2.1 |
| RMS | 6.8 | 1.9 |
| MAV | 5.9 | 1.7 |
| SSC | 3.6 | 1.4 |
| ZC | 3.1 | 1.2 |
| MNF | 2.4 | 1.0 |
| MDF | 1.9 | 0.9 |
| PKF | 0.8 | 0.6 |
Table 13:
Computational performance on the host PC and candidate routes to standalone embedded deployment.
| Classifier | Train (s) | Infer. (ms) | Size (KB) | Execution | Potential standalone route |
|---|---|---|---|---|---|
| RF | 2.3 | 1.2 | 850 | Host PC | 32-bit MCU after pruning and quantization |
| SVM | 1.8 | 0.8 | 120 | Host PC | 32-bit MCU, subject to memory checks |
| KNN | 0.1 | 3.5 | 2400 | Host PC | Not practical in the present memory budget |
| 1D CNN | 45.2 | 4.8 | 1200 | Host PC | 32-bit MCU with TinyML quantization |
| LSTM | 68.7 | 8.3 | 1800 | Host PC | Not practical in the present size/latency budget |
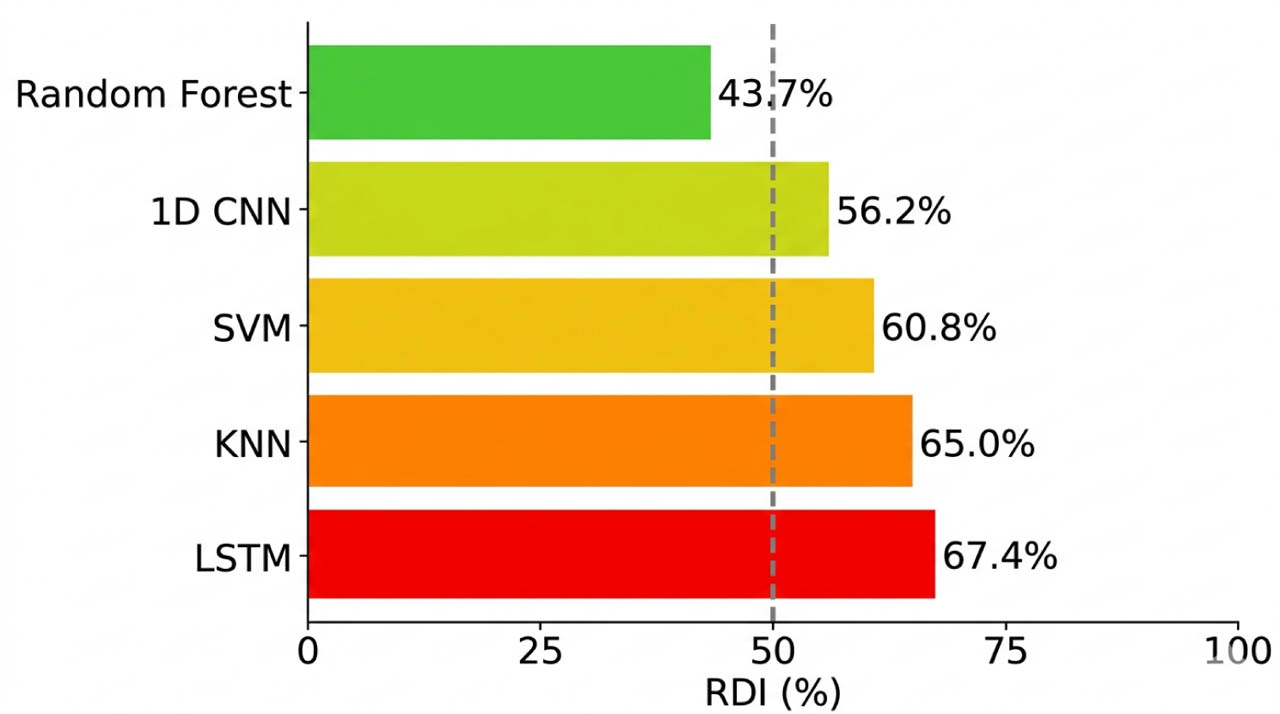
Figure 7:
Robustness Degradation Index (RDI) for all five classifiers. Lower values indicate greater robustness to synthetic-to-real domain shift. Random Forest (RDI = 43.7%) is the most robust classifier.
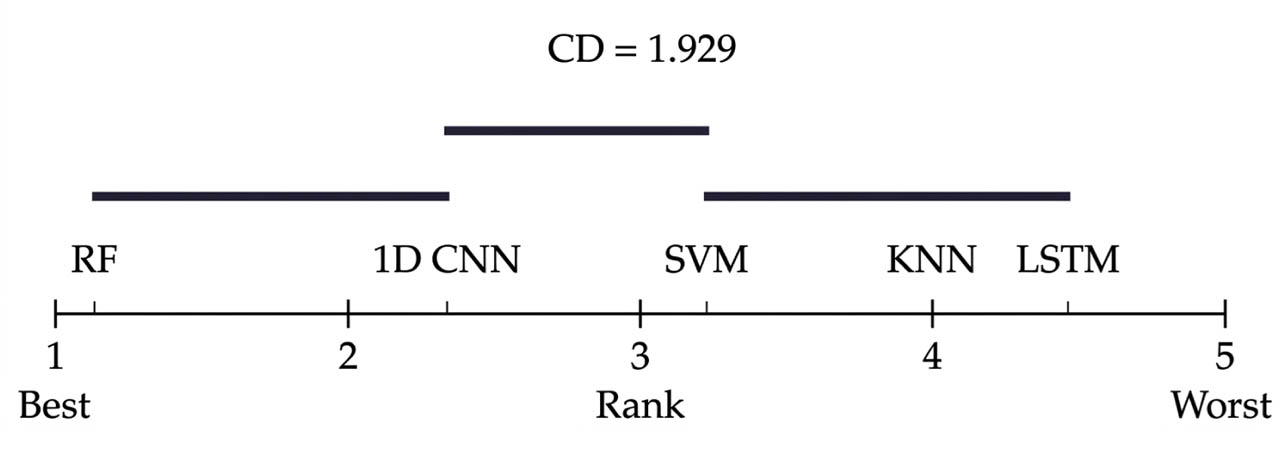
Figure 8:
Critical difference diagram (Nemenyi post-hoc test, α = 0.05, CD = 1.929). Classifiers connected by a horizontal bar are not significantly different. RF is significantly better than SVM, KNN and LSTM; RF and 1D CNN are not significantly different.
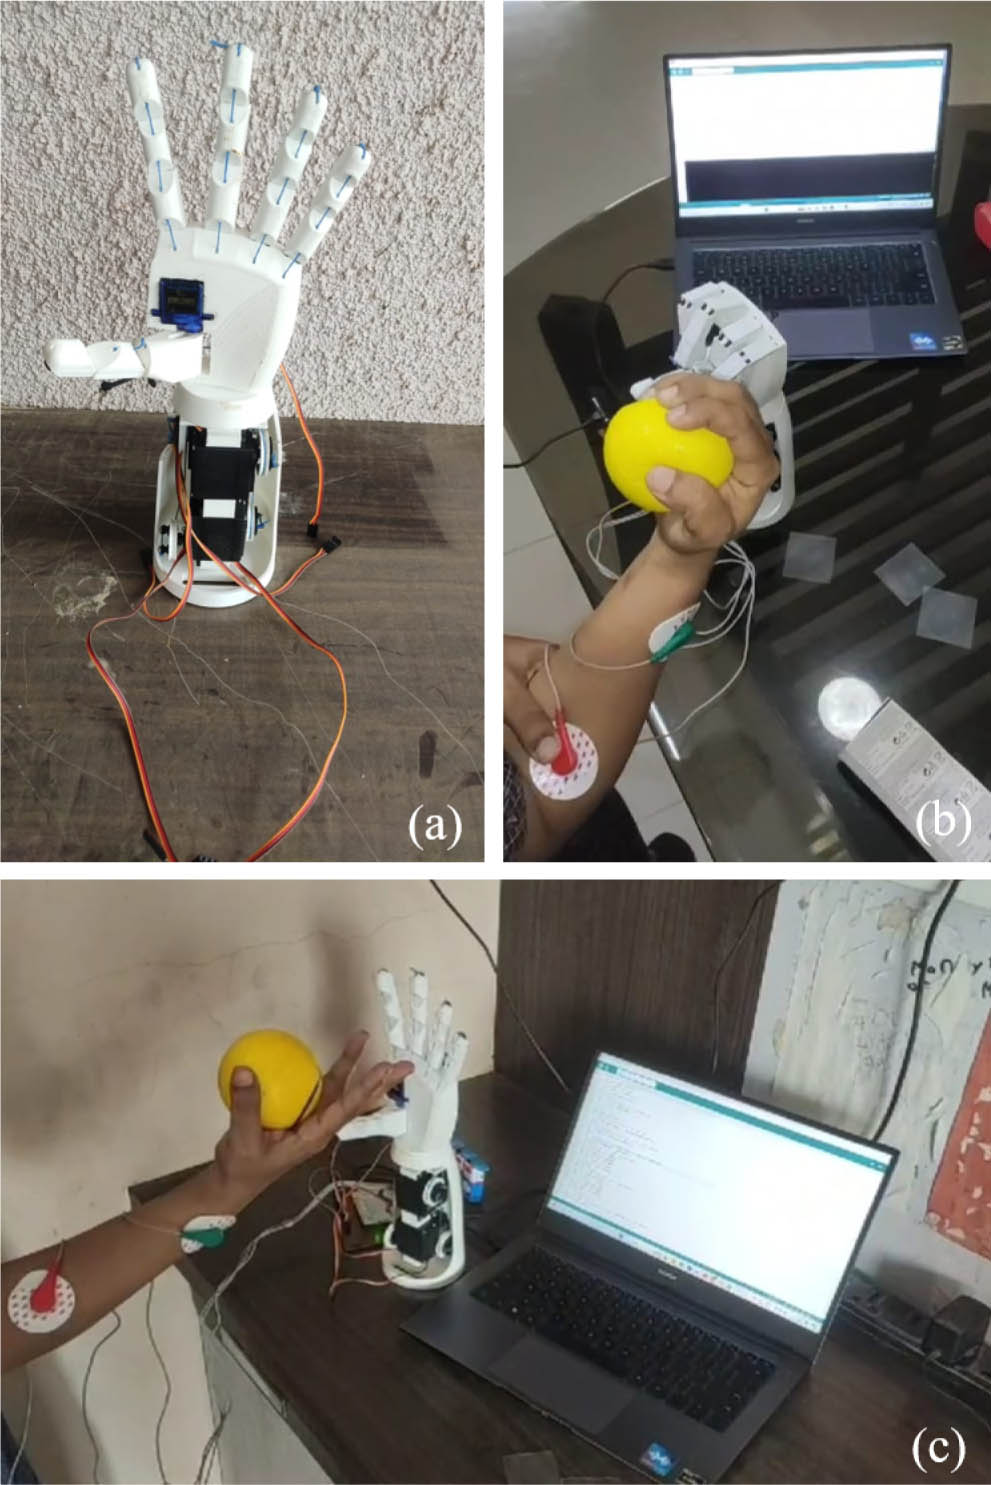
Figure 9:
Physical prototype and live testing: (a) assembled five-finger hand in the open posture, with tendon-driven PLA fingers and forearm-base servos; (b) participant trial in which grasping a ball produces prosthetic finger flexion; (c) open prosthetic posture during a participant trial, with the tethered acquisition/classification PC visible.
Table 14:
Hardware and task comparison. Costs exclude clinical services and use reported study values.
Table 15:
Evaluation context for interpreting Table 14.
| Study | Subjects | Gesture definitions | Conditions | Validation |
|---|---|---|---|---|
| Gusman | NR | Binary open/close | Threshold prototype | NR |
| Tavakoli | NR | Four hand gestures | Controlled recordings | NR |
| Prakash | 13 live | Six grip patterns | 5 amputees, 8 intact in live testing | Offline and live; fold protocol NR |
| Sravya | NR | Three gestures | Laboratory recordings | NR |
| Atzori | NR | 50 database movements | Public benchmark | Database evaluation |
| Present study | 10 | Open Fist, index extension, repetitive open/close | Able-bodied, single session, live recordings | LOSO; held-out subject |