
Fig. 1.
Descriptive statistics and correlations stratified on officer commission_ Correlations above the diagonal represents COs (N = 224), and correlations below the diagonal represents NCOs (N = 241)
| Variable | Means (SD) | Bivariate correlations | ||||||||
|---|---|---|---|---|---|---|---|---|---|---|
| NCOs | COs | 1. | 2. | 3. | 4. | 5. | 6. | 7. | 8. | |
| 1. Turnover intentions | 3.19 (0.82) | 2.87 (0.74) | − | 0.41** | −0.10 | −0.43** | −0.19** | −0.50** | −0.57** | −0.13 |
| 2. Work–life conflict | 3.31 (0.91) | 3.34 (0.92) | 0.52** | − | −0.22** | −0.58** | 0.08 | −0.16* | −0.22** | −0.06 |
| 3. Flexible hours | 2.86 (1.45) | 3.21 (1.41) | −0.21** | −0.25** | − | 0.14* | −0.06 | 0.13* | −0.04 | −0.06 |
| 4. Predictability | 2.79 (1.03) | 3.12 (1.07) | −0.42** | −0.55** | 0.13* | − | −0.08 | 0.22* | 0.30** | 0.19** |
| 5. Organisational links | 2.67 (0.65) | 2.86 (0.56) | 0.01 | 0.18** | −0.11 | −0.18** | − | 0.29** | 0.19** | 0.21** |
| 6. Organisational fit | 3.88 (0.60) | 4.03 (0.59) | −0.42** | −0.25** | 0.09 | 0.18** | 0.14* | − | 0.44** | 0.18** |
| 7. Career prospects | 2.43 (0.93) | 2.90 (0.78) | −0.71** | −0.43** | 0.16* | 0.37** | −0.01 | 0.44** | − | 0.17* |
| 8. Community-fit | 3.64 (0.91) | 3.94 (0.69) | −0.24** | −0.12 | −0.06 | 0.18** | 0.10 | 0.19** | 0.22** | − |
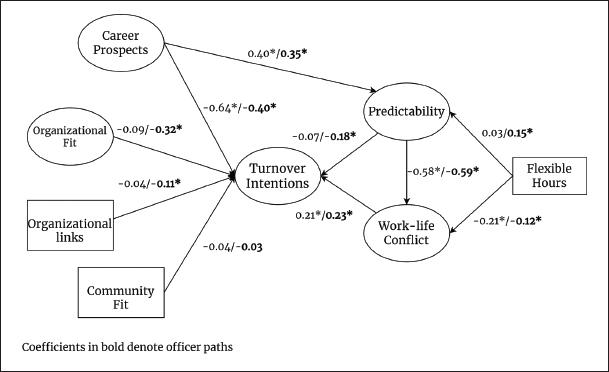
Standardised covariance and measurement coefficients from multi-group SEM for officers (N = 224) and NCOs (N = 241)
| Covariance paths | Officers | NCOs |
|---|---|---|
| β (SE) | β (SE) | |
| Organisational fit - organisational links | 0.28**(0.07) | 0.15*(0.07) |
| Organisational fit - career prospects | 0.55**(0.06) | 0.53**(0.06) |
| Organisational fit - community fit | 0.22**(0.07) | 0.24**(0.07) |
| Organisational links - career prospects | 0.21**(0.07) | 0.01 (0.06) |
| Organisational links - community fit | 0.23**(0.06) | 0.13*(0.06) |
| Career prospects - community fit | 0.17*(0.07) | 0.25**(0.07) |
| Measurement coefficients’ | ||
| Turnover intentions 1 | 0.60 (0.05) | 0.62 (0.04) |
| Turnover intentions 2 | 0.70 (0.04) | 0.76 (0.03) |
| Turnover intentions 3 | 0.62 (0.05) | 0.67 (0.04) |
| Turnover intentions 4 | 0.75 (0.04) | 0.82 (0.03) |
| Turnover intentions 5 | 0.58 (0.05) | 0.62 (0.04) |
| Turnover intentions 6 | 0.74 (0.04) | 0.61 (0.04) |
| Organisational fit 1 | 0.57 (0.05) | 0.46 (0.06) |
| Organisational fit 2 | 0.88 (0.03) | 0.88 (0.04) |
| Organisational fit 3 | 0.73 (0.04) | 0.74 (0.04) |
| Career prospects 1 | 0.85 (0.03) | 0.84 (0.02) |
| Career prospects 2 | 0.85 (0.03) | 0.88 (0.02) |
| Career prospects 3 | 0.62 (0.05) | 0.79 (0.03) |
| Career prospects 4 | 0.57 (0.05) | 0.65 (0.04) |
| Career prospects 5 | 0.70 (0.04) | 0.81 (0.03) |
| Work-life conflict 1 | 0.67 (0.04) | 0.65 (0.04) |
| Work-life conflict 2 | 0.69 (0.04) | 0.72 (0.03) |
| Work-life conflict 3 | 0.73 (0.04) | 0.76 (0.03) |
| Work-life conflict 4 | 0.91 (0.03) | 0.85 (0.02) |
| Work-life conflict 5 | 0.91 (0.02) | 0.88 (0.02) |
| Work-life conflict 6 | 0.84 (0.02) | 0.80 (0.03) |
| Predictability 1 | 0.85 (0.02) | 0.75 (0.03) |
| Predictability 2 | 0.92 (0.02) | 0.92 (0.02) |
| Predictability 3 | 0.84 (0.02) | 0.86 (0.02) |
| Predictability 4 | 0.64 (0.04) | 0.62 (0.04) |
Global fit of SEM models for COs, NCOs and the full sample
| Model | Sub-sample | df | χ2 | CFI | RMSEA | SRMR | BIC |
|---|---|---|---|---|---|---|---|
| Original model | COs | 309 | 500 | 0.937 | 0.053 | 0.106 | 14624 |
| Respecified model | COs | 308 | 476 | 0.951 | 0.045 | 0.067 | 14606 |
| Original model | NCOs | 309 | 609 | 0.914 | 0.064 | 0.146 | 16183 |
| Respecified model | NCOs | 308 | 575 | 0.927 | 0.060 | 0.084 | 16115 |
| Original model | Total | 309 | 771 | 0.931 | 0.057 | 0.123 | 30592 |
| Respecified model | Total | 308 | 707 | 0.943 | 0.053 | 0.062 | 30534 |
Priority list for targets for interventions to reduce turnover NCOs and COs in the armed forces
| Priority | NCOs | COs |
|---|---|---|
| 1 | Career prospects | Career prospects |
| 2 | Work-life conflict | Predictability |
| 3 | Predictability | Organisational fit |
| 4 | Flexible hours | Work-life conflict |
| 5 | - | Organisational links |
| 6 | - | Flexible hours |
Sample characteristics stratified on officer commission
| NCOs (N = 241) | COs (N = 224) | |||
|---|---|---|---|---|
| Mean | SD | Mean | SD | |
| Education level* | 2.74 | 0.94 | 4.25 | 0.51 |
| Service length* | 2.25 | 1.26 | 3.49 | 1.30 |
| Living alone (%) | 44 | 22 | ||
| Children (%) | 35 | 66 | ||
| Weekly commute (%)’ | 17 | 23 | ||