COVID-19 is caused by the virus SARS-CoV-2 (severe acute respiratory syndrome coronavirus 2). By the end of 2019, the illness began spreading rapidly across the globe. It resulted in millions of deaths and prompted governments to implement strict measures, including widespread quarantines. Between March and April 2020, universities and research laboratories worldwide shut down for several months, forcing scientists to work from home without access to essential equipment. Comments in scientific journals and magazines decried the possible consequences on science in general, and for women, early career scientists, and underrepresented groups in particular (Collins, 2020; Langin, 2021; McNutt, 2020). Surprisingly, Rousseau et al. (2023) found that, generally, the number of published articles in 2021 was even higher than expected under normal circumstances. Did COVID-19 pass without effect on scientific production? In this note, we will show that the impact on the number of published articles came for most countries several years later. Generally, we may say that an unusually high scientific activity characterizes the years 2020-2021.
The structure of the paper is as follows. We start with a brief literature overview and method section. Then the results are shown using tables, while typical publication patterns are shown by graphs. Special attention goes to possible differences between journals in the broad category of the Life Sciences and Biomedicine on the one hand, and the remaining journals on the other. We conclude by pointing out the main findings of our investigation, among which are the differences in publication patterns between China and India, and most other leading countries.
We collected data from three databases: WoS, only including SCI-Expanded, SSCI, and the A&HCI; Scopus; and OpenAlex, in all cases restricted to the “article” document type. This restriction reflects our focus on original, peer-reviewed research. Data collection took place in May 2025. Since we are mainly interested in the period around 2019-2020, we gathered data for the years 2015-2024.
Clarivate’s Web of Science (WoS) and Elsevier’s Scopus are well-known among scientists. For a recent discussion, we refer to e.g., (Singh et al., 2021). OpenAlex, a large open-access database of scholarly works, was established in 2021 and is curated by the non-profit organization OurResearch (OurResearch, 2025a; Priem et al., 2022). Its growing prominence within the bibliometric domain is attributable to its comprehensive source coverage and its open and decentralized framework (van Eck et al., 2024). As of May 2025, OpenAlex contains more than 267 million records, virtually doubling the holdings of its proprietary counterparts (OurResearch, 2025b). Recent discussions of its coverage and potential for research evaluation can be found in (Zhang et al., 2024; Culbert et al., 2025).
Recognizing that COVID-19 and geopolitical developments affect countries differently, we collected data for the WoS, and separately for fourteen highly productive countries: Australia, Brazil, Canada, China, France, Germany, India, Italy, Japan, Russia, Spain, Switzerland, the UK, and the USA.
Results for the UK in the WoS were obtained by a query CU=(England OR Scotland OR Wales OR North Ireland). The results of our queries yield all articles in which the investigated country participated, possibly among many more. For the data restricted to the WoS broad category of Life Sciences and Biomedicine (in short: LSB) we used the same query as shown in Appendix 1 of Rousseau et al. (2023). It is well-known, see e.g. (Fassin, 2023), that COVID-19 exercised a huge, maybe even disruptive, influence on research related to this theme. For this reason, we collected data on the broad category most closely related to this theme and compared them with the remaining publications in the WoS.
To enhance clarity, the results are presented in thousands of articles. In the tables, the publication peak is indicated in bold, while the first low point is marked in bold italic.
First, we show the data for the WoS as a whole, and then we continue with separate countries and the resulting data in the WoS, Scopus, OpenAlex. Further, we show separate data for the WoS, restricted to the broad area Life Sciences and Biomedicine (LSB), and to the WoS, without LSB. A discussion of these results follows in the next section.
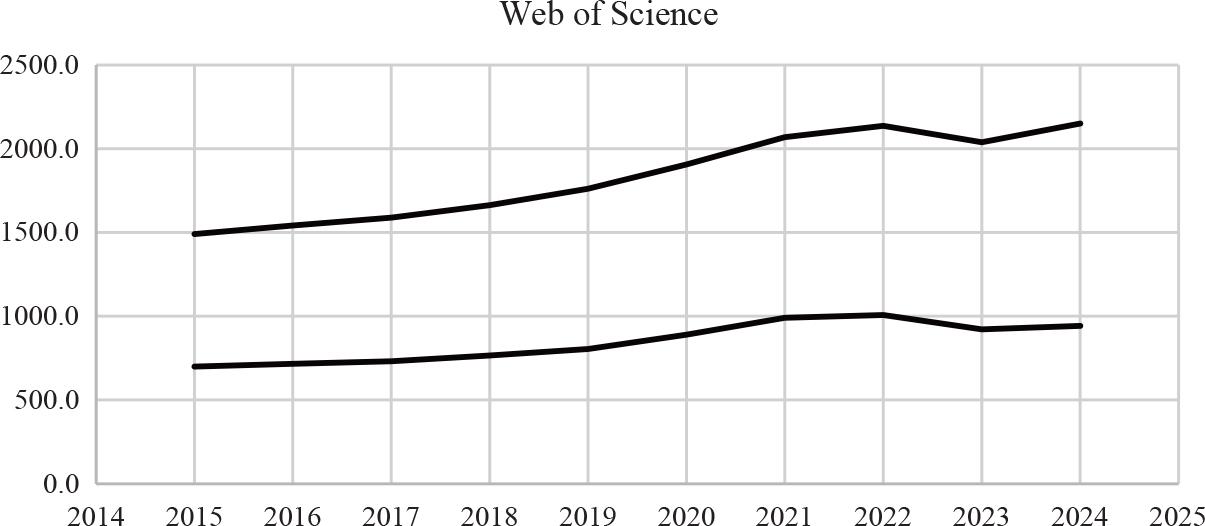
Upper curve: yearly number of publications in the WoS (three subdatabases); lower curve: publications in the broad category of Life Sciences and Biomedicine.
The following tables, presented in alphabetical order by country, show the results for the three databases, followed by the data for the Web of Science, restricted to the broad category Life Sciences and Biomedicine, and for the difference between the two.
Research articles from Australia.
| FPY | WoS | Scopus | OpenAlex | WoS LSB | WoS no LSB |
|---|---|---|---|---|---|
| 2015 | 58.3 | 101 | 97 | 30.9 | 27.4 |
| 2016 | 61.2 | 107 | 98 | 32.5 | 28.7 |
| 2017 | 63.3 | 110 | 100 | 33.0 | 30.3 |
| 2018 | 66.5 | 113 | 103 | 35.0 | 31.5 |
| 2019 | 69.9 | 118 | 109 | 36.4 | 33.4 |
| 2020 | 74.4 | 122 | 116 | 39.0 | 35.5 |
| 2021 | 79.1 | 128 | 117 | 42.7 | 36.5 |
| 2022 | 75.6 | 127 | 107 | 40.4 | 35.2 |
| 2023 | 68.6 | 122 | 105 | 35.5 | 33.1 |
| 2024 | 70.1 | 125 | 93 | 36.1 | 34.0 |
Research articles from Brazil.
| FPY | WoS | Scopus | OpenAlex | WoS LSB | WoS no LSB |
|---|---|---|---|---|---|
| 2015 | 64.1 | 72 | 112 | 34.1 | 30.0 |
| 2016 | 66.0 | 73 | 113 | 35.2 | 30.8 |
| 2017 | 67.8 | 75 | 115 | 35.8 | 32.0 |
| 2018 | 70.6 | 79 | 120 | 37.5 | 33.2 |
| 2019 | 73.3 | 82 | 124 | 39.1 | 34.2 |
| 2020 | 77.3 | 88 | 133 | 41.0 | 36.2 |
| 2021 | 82.2 | 95 | 135 | 44.2 | 38.0 |
| 2022 | 78.8 | 94 | 127 | 42.0 | 36.8 |
| 2023 | 73.2 | 89 | 127 | 37.9 | 35.3 |
| 2024 | 74.3 | 93 | 112 | 38.4 | 35.9 |
Research articles from Canada.
| FPY | WoS | Scopus | OpenAlex | WoS LSB | WoS no LSB |
|---|---|---|---|---|---|
| 2015 | 64.1 | 72 | 112 | 34.1 | 30.0 |
| 2016 | 66.0 | 73 | 113 | 35.2 | 30.8 |
| 2017 | 67.8 | 75 | 115 | 35.8 | 32.0 |
| 2018 | 70.6 | 79 | 120 | 37.5 | 33.2 |
| 2019 | 73.3 | 82 | 124 | 39.1 | 34.2 |
| 2020 | 77.3 | 88 | 133 | 41.0 | 36.2 |
| 2021 | 82.2 | 95 | 135 | 44.2 | 38.0 |
| 2022 | 78.8 | 94 | 127 | 42.0 | 36.8 |
| 2023 | 73.2 | 89 | 127 | 37.9 | 35.3 |
| 2024 | 74.3 | 93 | 112 | 38.4 | 35.9 |
Research articles from China
| FPY | WoS | Scopus | OpenAlex | WoS LSB | WoS no LSB |
|---|---|---|---|---|---|
| 2015 | 279.6 | 382 | 527 | 100.1 | 179.5 |
| 2016 | 306.9 | 403 | 445 | 110.3 | 196.6 |
| 2017 | 341.1 | 431 | 487 | 122.8 | 218.3 |
| 2018 | 391.2 | 478 | 561 | 141.0 | 250.2 |
| 2019 | 459.1 | 570 | 632 | 168.5 | 290.5 |
| 2020 | 513.0 | 643 | 677 | 197.6 | 315.4 |
| 2021 | 572.6 | 704 | 767 | 227.1 | 345.5 |
| 2022 | 693.9 | 840 | 911 | 277.5 | 416.5 |
| 2023 | 689.9 | 848 | 926 | 259.0 | 430.8 |
| 2024 | 791.4 | 975 | 903 | 284.5 | 506.9 |
Research articles from France
| FPY | WoS | Scopus | OpenAlex | WoS LSB | WoS no LSB |
|---|---|---|---|---|---|
| 2015 | 71.3 | 82 | 142 | 31.1 | 40.2 |
| 2016 | 73.7 | 83 | 145 | 32.1 | 41.6 |
| 2017 | 74.6 | 84 | 146 | 32.4 | 42.2 |
| 2018 | 74.3 | 84 | 151 | 33.0 | 41.4 |
| 2019 | 75.0 | 84 | 153 | 33.0 | 42.0 |
| 2020 | 79.4 | 90 | 154 | 36.3 | 43.2 |
| 2021 | 82.4 | 94 | 155 | 38.8 | 43.6 |
| 2022 | 77.1 | 91 | 150 | 36.6 | 40.5 |
| 2023 | 73.3 | 87 | 157 | 33.5 | 39.8 |
| 2024 | 73.6 | 89 | 139 | 33.0 | 40.6 |
Research articles from Germany.
| FPY | WoS | Scopus | OpenAlex | WoS LSB | WoS no LSB |
|---|---|---|---|---|---|
| 2015 | 103.3 | 119 | 180 | 48.3 | 55.0 |
| 2016 | 107.0 | 120 | 184 | 49.8 | 57.2 |
| 2017 | 110.0 | 122 | 185 | 50.2 | 59.7 |
| 2018 | 112.0 | 125 | 192 | 51.2 | 60.8 |
| 2019 | 115.1 | 127 | 198 | 52.9 | 62.3 |
| 2020 | 121.4 | 136 | 206 | 57.0 | 64.3 |
| 2021 | 131.9 | 149 | 213 | 64.4 | 67.5 |
| 2022 | 123.5 | 145 | 197 | 60.6 | 62.8 |
| 2023 | 116.1 | 139 | 195 | 54.6 | 61.5 |
| 2024 | 116.6 | 144 | 172 | 53.3 | 63.3 |
Research articles from India.
| FPY | WoS | Scopus | OpenAlex | WoS LSB | WoS no LSB |
|---|---|---|---|---|---|
| 2015 | 59.5 | 103 | 156 | 22.2 | 37.3 |
| 2016 | 63.5 | 106 | 178 | 22.8 | 40.7 |
| 2017 | 66.9 | 105 | 194 | 23.2 | 43.7 |
| 2018 | 71.8 | 114 | 205 | 24.0 | 47.7 |
| 2019 | 77.2 | 139 | 211 | 24.8 | 52.3 |
| 2020 | 84.9 | 139 | 253 | 28.1 | 56.8 |
| 2021 | 98.0 | 149 | 276 | 34.4 | 63.6 |
| 2022 | 109.9 | 169 | 295 | 37.7 | 72.2 |
| 2023 | 108.1 | 175 | 318 | 35.1 | 72.9 |
| 2024 | 116.6 | 203 | 290 | 35.4 | 81.2 |
esearch articles from Italy.
| FPY | WoS | Scopus | OpenAlex | WoS LSB | WoS no LSB |
|---|---|---|---|---|---|
| 2015 | 62.6 | 73 | 107 | 32.1 | 30.4 |
| 2016 | 65.0 | 75 | 109 | 33.1 | 31.9 |
| 2017 | 66.2 | 76 | 111 | 33.4 | 32.8 |
| 2018 | 68.4 | 80 | 114 | 34.9 | 33.5 |
| 2019 | 71.3 | 85 | 120 | 36.8 | 34.5 |
| 2020 | 82.0 | 99 | 138 | 44.1 | 37.9 |
| 2021 | 89.0 | 108 | 141 | 48.9 | 40.2 |
| 2022 | 85.3 | 105 | 135 | 46.8 | 38.6 |
| 2023 | 81.4 | 103 | 134 | 42.3 | 39.1 |
| 2024 | 82.9 | 107 | 122 | 41.9 | 41.0 |
Research articles from Japan.
| FPY | WoS | Scopus | OpenAlex | WoS LSB | WoS no LSB |
|---|---|---|---|---|---|
| 2015 | 75.2 | 91 | 157 | 37.0 | 38.2 |
| 2016 | 77.4 | 92 | 157 | 37.6 | 39.8 |
| 2017 | 79.1 | 93 | 159 | 38.4 | 40.7 |
| 2018 | 80.8 | 95 | 162 | 40.0 | 40.8 |
| 2019 | 81.5 | 97 | 161 | 39.7 | 41.7 |
| 2020 | 87.7 | 105 | 164 | 43.4 | 44.3 |
| 2021 | 92.8 | 112 | 162 | 48.0 | 44.8 |
| 2022 | 87.2 | 108 | 153 | 45.2 | 42.0 |
| 2023 | 80.8 | 101 | 149 | 40.2 | 40.5 |
| 2024 | 80.8 | 104 | 135 | 39.4 | 41.4 |
Research articles from Russia.
| FPY | WoS | Scopus | OpenAlex | WoS LSB | WoS no LSB |
|---|---|---|---|---|---|
| 2015 | 34.4 | 53 | 85 | 7.1 | 27.3 |
| 2016 | 36.0 | 59 | 96 | 7.4 | 28.6 |
| 2017 | 37.7 | 63 | 105 | 7.8 | 29.9 |
| 2018 | 39.7 | 69 | 126 | 8.5 | 31.2 |
| 2019 | 42.0 | 84 | 156 | 9.4 | 32.6 |
| 2020 | 44.6 | 86 | 176 | 10.8 | 33.8 |
| 2021 | 46.1 | 89 | 194 | 12.3 | 33.9 |
| 2022 | 44.4 | 86 | 168 | 12.2 | 32.1 |
| 2023 | 40.8 | 85 | 148 | 11.4 | 29.4 |
| 2024 | 37.0 | 79 | 106 | 10.1 | 27.0 |
Research articles from Spain.
| FPY | WoS | Scopus | OpenAlex | WoS LSB | WoS no LSB |
|---|---|---|---|---|---|
| 2015 | 55.9 | 67 | 110 | 26.7 | 29.2 |
| 2016 | 57.6 | 68 | 112 | 26.8 | 30.8 |
| 2017 | 58.7 | 70 | 118 | 27.5 | 31.2 |
| 2018 | 60.8 | 72 | 122 | 28.7 | 32.1 |
| 2019 | 64.6 | 80 | 126 | 31.3 | 33.3 |
| 2020 | 72.2 | 89 | 138 | 36.4 | 35.8 |
| 2021 | 77.6 | 96 | 140 | 40.7 | 36.9 |
| 2022 | 72.4 | 94 | 129 | 37.7 | 34.7 |
| 2023 | 70.0 | 93 | 133 | 34.9 | 35.1 |
| 2024 | 71.0 | 97 | 112 | 34.7 | 36.3 |
Research articles from Switzerland.
| FPY | WoS | Scopus | OpenAlex | WoS LSB | WoS no LSB |
|---|---|---|---|---|---|
| 2015 | 28.3 | 32 | 47 | 14.7 | 13.6 |
| 2016 | 30.4 | 33 | 47 | 15.6 | 14.8 |
| 2017 | 31.7 | 34 | 50 | 16.5 | 15.2 |
| 2018 | 32.3 | 35 | 51 | 16.8 | 15.5 |
| 2019 | 32.8 | 35 | 52 | 17.3 | 15.5 |
| 2020 | 35.1 | 39 | 57 | 19.0 | 16.2 |
| 2021 | 38.0 | 42 | 60 | 21.3 | 16.8 |
| 2022 | 36.0 | 41 | 56 | 19.9 | 16.1 |
| 2023 | 34.5 | 40 | 56 | 18.5 | 16.0 |
| 2024 | 35.4 | 42 | 49 | 18.9 | 16.5 |
Research articles from the UK.
| FPY | WoS | Scopus | OpenAlex | WoS LSB | WoS no LSB |
|---|---|---|---|---|---|
| 2015 | 109.7 | 129 | 210 | 52.8 | 56.9 |
| 2016 | 116.0 | 132 | 213 | 54.7 | 61.3 |
| 2017 | 119.8 | 135 | 218 | 55.6 | 64.3 |
| 2018 | 124.8 | 143 | 224 | 58.3 | 66.5 |
| 2019 | 128.7 | 147 | 230 | 60.2 | 68.5 |
| 2020 | 136.3 | 157 | 246 | 64.6 | 71.6 |
| 2021 | 145.7 | 170 | 253 | 71.8 | 73.9 |
| 2022 | 136.5 | 164 | 232 | 65.9 | 70.6 |
| 2023 | 128.3 | 159 | 232 | 60.0 | 68.3 |
| 2024 | 132.6 | 169 | 207 | 60.5 | 72.1 |
Research articles from the USA.
| FPY | WoS | Scopus | OpenAlex | WoS LSB | WoS no LSB |
|---|---|---|---|---|---|
| 2015 | 382.5 | 433 | 755 | 205.6 | 176.9 |
| 2016 | 392.5 | 434 | 746 | 210.4 | 182.1 |
| 2017 | 400.8 | 443 | 758 | 214.2 | 186.6 |
| 2018 | 410.0 | 458 | 776 | 219.7 | 190.3 |
| 2019 | 416.8 | 467 | 804 | 222.9 | 193.9 |
| 2020 | 433.5 | 494 | 878 | 235.6 | 197.9 |
| 2021 | 449.1 | 521 | 830 | 251.8 | 197.3 |
| 2022 | 417.9 | 496 | 777 | 233.2 | 184.8 |
| 2023 | 388.5 | 476 | 840 | 214.8 | 173.7 |
| 2024 | 391.9 | 495 | 721 | 213.9 | 178.0 |
We first discuss the 14 countries. Eleven Western countries (including Japan and Brazil) show the same basic pattern in the WoS and Scopus. A typical example, the UK, is shown in Figure 2.
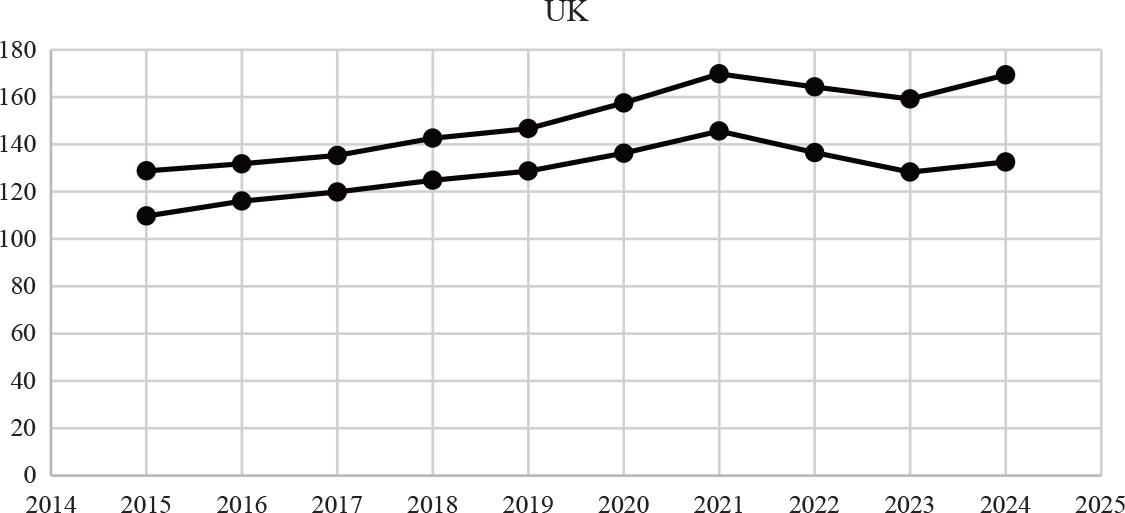
UK: Upper curve: Scopus data, lower curve: WoS data
Numbers increase until the year 2021 (corresponding to our earlier findings in Rousseau et al. (2023)), then decrease for two years, reaching a local minimum in the year 2023, and then increase again in 2024. The other countries, China, India, and Russia, exhibit a slightly different pattern. China and India continueto increase their production, except for a slight dip in 2023. This is illustrated by the case of China in Figure 3.
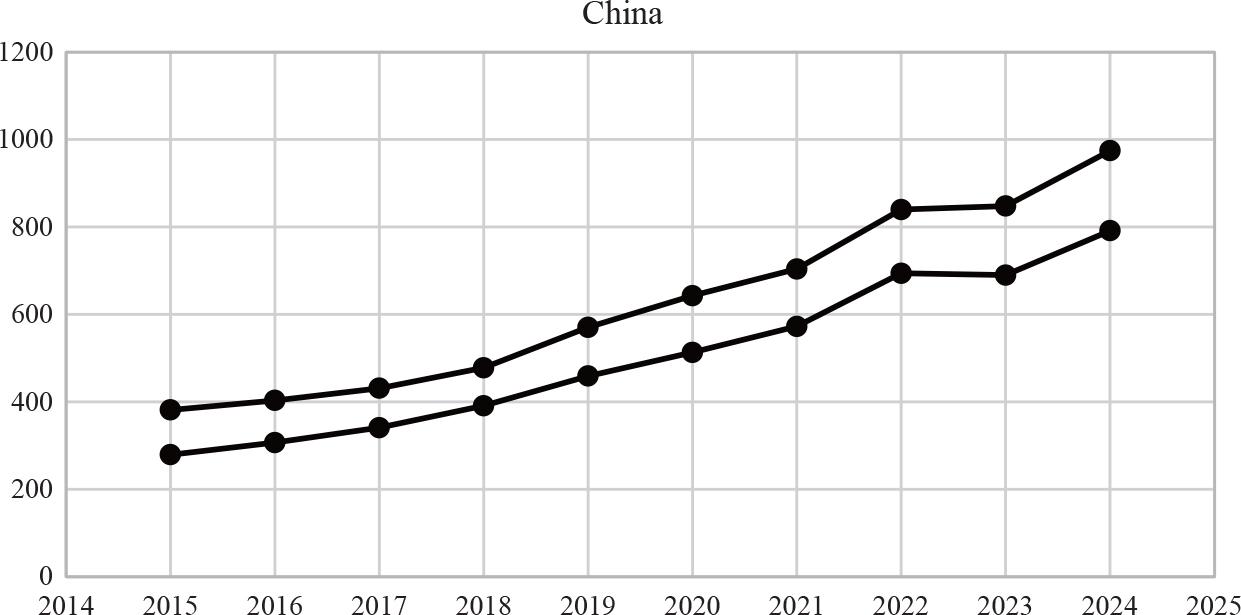
China: Upper curve: Scopus data, lower curve: WoS data
Finally, similar to the other countries, Russia peaked in 2021 but has shown a steady decrease since then, likely due to the war in which this country is involved, see Figure 4.

Russia: Upper curve: Scopus data, lower curve: WoS data
Data in OpenAlex are more challenging to interpret since the numbers for the year 2024 are clearly incomplete. However, OpenAlex also indicates that for most countries, a peak was reached in 2021, with Brazil and the USA peaking in 2020, followed by a decline for the USA in 2022. Yet, because of the relative incompleteness of OpenAlex, especially during the year 2024, this database does not seem to be the best possible to find the patterns we were looking for.
Now we return to Figure 1, which presents the data for the WoS. The pattern illustrated in Figure 2, which applies to many countries, is not evident in Figure 1. In this figure, we see a peak in the year 2022, followed by a small dip in 2023. One could say that the WoS data for recent years align with those of China.
A broadly distributed questionnaire is needed to definitively explain this phenomenon. The urgency of the pandemic situation accounts for part of the increase, particularly in the life sciences. However, based on informal discussions in the author’s local academic circles, a plausible explanation is that when scientists could not access their universities in 2020, they still had access to large datasets and had already (vaguely) developed new ideas for theoretical work. With fewer distractions, they finally had time to reflect and write, leading to a surge in publications in 2021. The subsequent decline by 2023 may indicate a return to normal routines and fewer accumulated ideas.
To test the influence of the life sciences on the observed patterns, we conducted the same queries in the WoS (three subdatabases and only articles), for the Life Sciences and Biomedicine on its own, and by making the difference with the total, we obtained results for the other publications. The results are shown in the last two columns of the tables above. Country-wise, the same patterns are present, with some exceptions of small magnitude, mainly for the LSB in the most recent year.
For the critical period [2020-2024], we performed the same investigations with four WoS subdatabases, including the ESCI. Patterns were the same as for the three subdatabases and are not shown here.
As an aside, we mention that according to Scopus, China surpassed the USA in 2018, according to the WoS this happened in 2019, while according to OpenAlex, is was only in 2022 that China published more articles than the USA. According to the WoS (only three subdatabases), China has published twice as many articles (202%) as the USA in 2024. This doubling has not yet occurred in Scopus, but China comes close (197%).
In conclusion, we recall the graph for the UK (see Figure 2) as an exemplar for the influence of COVID-19 on a country’s scientific production. We clearly see the increase in 2020, leading to a peak in 2021, followed by a decrease in 2022 and 2023. From then on, it seems that the line from the past (period 2015–2019) more or less continues. For the countries following the UK graph, this pattern also occurs for publications in the LSB, and even better for publications not belonging to this broad category.
Our investigation shows that while COVID-19 did impact scientific output in Western countries, it took several years to fully understand the nature of this effect. In China and India, COVID-19 is apparent only as a small ripple in their – increasing - publication curves. We recall from Rousseau et al. (2023) that especially the Life Sciences and Biomedicine had a huge increase in publications, but also the other broad categories showed an increase.
A reviewer of our previous publication (Rousseau et al., 2023) asked if the results could be a consequence of a sudden increase in “publication titles”, which it was not. On the occasion of this new investigation, we performed the same query as in 2022 and obtained the results shown in Table 15. The average number of articles per publication title shows the same pattern as the number of articles. Hence, the new findings cannot be explained by a sudden increase or decrease in the number of publication titles.
Number of “publication titles” in the WoS (three subdatabases).
| FPY | Absolute number of publication titles | Number of articles (in 1000) | Average number of articles per title |
|---|---|---|---|
| 2018 | 14,252 | 1662,6 | 117 |
| 2019 | 14,312 | 1760,5 | 123 |
| 2020 | 14,309 | 1906,0 | 133 |
| 2021 | 14,289 | 2067,9 | 145 |
| 2022 | 13,839 | 2135,8 | 154 |
| 2023 | 13,713 | 2038,0 | 149 |
| 2024 | 13,409 | 2150,9 | 160 |
A key takeaway from our investigation is the importance of analyzing countries individually rather than assuming a universal trend. In our case, the overall pattern is heavily shaped by China. For many countries, COVID-19 significantly affected publication patterns over an extended period. In conclusion, our article offers a discussion framed as a natural experiment within the science of science.