
Figure 1

Figure 2
The mapping from ESI classes to science fields_
| Field(full) | Field(abb.) | ESI class |
|---|---|---|
| Agricultural Sciences | AGR | Agricultural Sciences |
| Environment/Ecology | ENV | Environment/Ecology |
| Geosciences | GEO | Geosciences |
| Engineering | ENG | Computer Science Engineering Materials Science |
| Biology | BIO | Biology & Biochemistry Microbiology Molecular Biology & Genetics Plant & Animal Science |
| Medicine | MED | Clinical Medicine Immunology Neuroscience & Behavior Pharmacology & Toxicology Psychiatry/Psychology |
| Mathematics | MAT | Mathematics |
| Chemistry | CHE | Chemistry |
| Physics | PHY | Physics |
| Space Science | SPA | Space Science |
Similarity values based on citation disciplinary structures in 1993 and 2013_
| Country | Sim(VCi1993, VCi2013) | Country | Sim(VCi1993, VCi2013) |
|---|---|---|---|
| Brazil | 0.739 | Italy | 0.942 |
| Canada | 0.971 | Japan | 0.950 |
| China | 0.907 | Russia | 0.951 |
| France | 0.978 | South Africa | 0.963 |
| Germany | 0.969 | United Kingdom | 0.968 |
| India | 0.974 | United States | 0.982 |
Jeffreys-Matusita distances between publication and citation disciplinary structure and vector means within G7 and BRICS countries_
| country | Dist(VPi2013, VCi2013) | Mean(VPi2013) | Mean(VCi2013) |
|---|---|---|---|
| United States | 2.1 | 19.2 | 25.3 |
| Russia | 1.9 | 2.6 | 1.1 |
| Brazil | 1.3 | 2.5 | 1.5 |
| India | 1.2 | 3.6 | 2.4 |
| China | 1.0 | 14.8 | 13.8 |
| United Kingdom | 0.8 | 4.3 | 5.4 |
| Japan | 0.8 | 4.6 | 3.6 |
| Germany | 0.7 | 5.0 | 5.9 |
| France | 0.5 | 3.9 | 4.4 |
| Italy | 0.4 | 3.5 | 3.8 |
| South Africa | 0.4 | 0.6 | 0.4 |
| Canada | 0.3 | 2.9 | 3.2 |
Journal and publication volume by publication year_
| Publication year | # journals | # publications |
|---|---|---|
| 1993 | 3,221 | 436,440 |
| 2013 | 3,221 | 634,994 |
| Total | 3,221 | 1,071,434 |
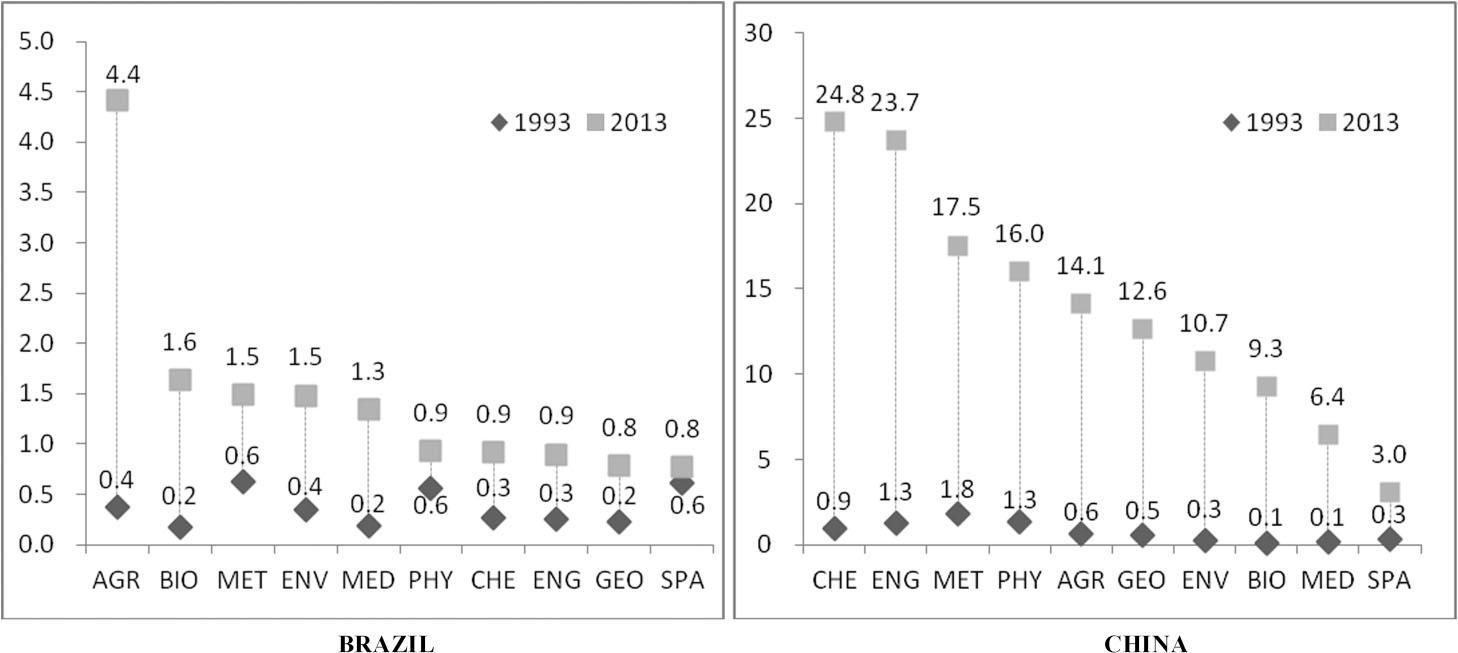
RCij2013 values for 21 countries (2013)_
| Field | CHE | ENG | MAT | PHY | AGR | GEO | ENV | BIO | MED | SPA |
|---|---|---|---|---|---|---|---|---|---|---|
| Australia | 1.7 | 2.6 | 1.5 | 1.5 | 2.9 | 4.1 | 5.2 | 2.9 | 3.3 | 2.4 |
| Brazil | 0.9 | 0.9 | 1.5 | 0.9 | 4.4 | 0.8 | 1.5 | 1.6 | 1.4 | 0.8 |
| Canada | 2.2 | 2.7 | 2.6 | 2.0 | 3.1 | 3.9 | 4.6 | 3.5 | 4.0 | 2.8 |
| China | 24.8 | 23.7 | 17.5 | 16.0 | 14.1 | 12.6 | 10.7 | 9.3 | 6.4 | 3.0 |
| France | 3.7 | 3.3 | 6.1 | 4.7 | 3.4 | 5.8 | 3.8 | 3.8 | 3.5 | 6.1 |
| Germany | 6.2 | 3.9 | 5.3 | 8.0 | 3.7 | 6.1 | 5.0 | 6.1 | 5.7 | 8.6 |
| India | 4.5 | 3.6 | 1.7 | 2.9 | 3.2 | 1.8 | 2.1 | 2.0 | 1.1 | 1.4 |
| Iran | 1.8 | 2.5 | 1.8 | 1.0 | 1.8 | 0.7 | 0.7 | 0.5 | 0.5 | 0.4 |
| Italy | 2.4 | 3.2 | 4.9 | 3.7 | 4.8 | 3.8 | 2.5 | 3.0 | 4.4 | 5.0 |
| Japan | 5.2 | 3.0 | 2.8 | 5.8 | 2.3 | 3.2 | 1.6 | 4.6 | 4.0 | 3.4 |
| Republic of Korea | 3.3 | 4.5 | 1.8 | 3.0 | 3.0 | 0.8 | 1.1 | 2.1 | 2.1 | 0.8 |
| Netherlands | 1.1 | 1.1 | 0.8 | 1.3 | 1.8 | 1.7 | 2.2 | 2.0 | 3.2 | 2.1 |
| Poland | 1.0 | 0.9 | 2.1 | 1.1 | 1.3 | 0.6 | 1.0 | 0.9 | 0.6 | 0.6 |
| Russia | 1.0 | 0.6 | 2.3 | 2.6 | 0.2 | 1.6 | 0.3 | 0.5 | 0.1 | 1.7 |
| South Africa | 0.3 | 0.2 | 0.5 | 0.2 | 0.6 | 0.4 | 0.8 | 0.4 | 0.3 | 0.6 |
| Spain | 3.1 | 2.9 | 3.1 | 2.4 | 7.2 | 2.4 | 3.8 | 2.6 | 2.3 | 3.0 |
| Switzerland | 1.3 | 1.1 | 1.2 | 1.8 | 0.8 | 2.0 | 2.2 | 1.5 | 1.5 | 1.4 |
| Taiwan | 1.3 | 2.8 | 1.0 | 1.3 | 1.4 | 0.7 | 0.7 | 0.8 | 1.0 | 0.4 |
| Turkey | 0.6 | 1.3 | 1.7 | 0.6 | 1.7 | 0.6 | 0.7 | 0.4 | 0.9 | 0.2 |
| United Kingdom | 3.7 | 4.2 | 4.0 | 4.4 | 3.0 | 6.9 | 5.8 | 6.2 | 7.3 | 8.2 |
| United States | 18.9 | 17.3 | 19.6 | 23.1 | 15.0 | 27.9 | 26.4 | 32.5 | 34.9 | 37.5 |