
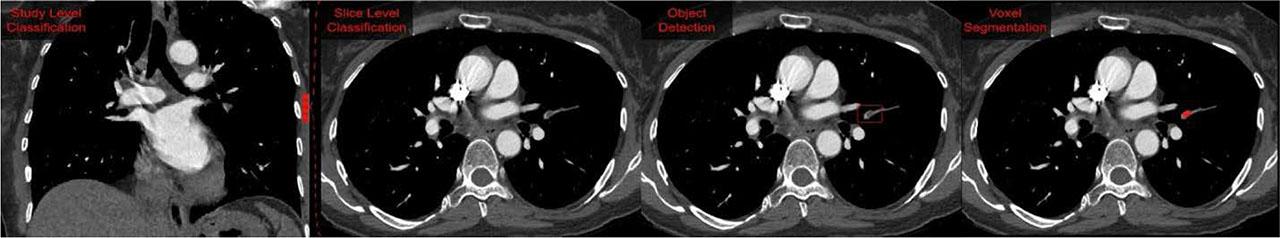
FIGURE 1.
Bounding box detection performance for PE detection_ Results reported at mAP at 0_5 IoU_ Due to the very small amount of data available and the granularity of the task, dataset sizes are reported in number of annotated images_
| Author | Year | mAP at 0.5 IoU | Train size (scans) | Test size (scans) |
|---|---|---|---|---|
| Long et al.40 | 2021 | 80.9 | 8,792 | 304 |
| Kiourt et al.41 | 2021 | 68 | 673 | – |
| Xu et al.42 | 2023 | 72.7 | 71,488 | 17,328 |
| Bushra et al.43 | 2024 | 84.6 | 6,219 | 2,573 |
Evolution of study-level PE detection method performance (2002–2024)_ The progression shows significant improvement from early approaches with high false positive rates to modern AI systems achieving better balance between sensitivity and specificity_
| Author | Year | Sensitivity (%) | Specificity (%) | False positive PEs/case | PPV (%) | F1 (%) | Train size (scans) | Test size (scans) |
|---|---|---|---|---|---|---|---|---|
| Masutani et al.26 | 2002 | 100.0/85.0* | – | 7.7/2.6 | 11 | 19.8 | 11 | 19 |
| Pichon et al.12 | 2004 | 86 | – | 6.3 | – | – | 6 | |
| Maizlin et al.33 | 2007 | 53.3 | 77.5 | 1 | 28.5 | 37.4 | – | 104 |
| Engelke et al.27 | 2008 | 30.7 | – | 4.1 | – | – | 56 | |
| Das et al.35 | 2008 | 83 | 80 | 4 | – | – | 43 | |
| Zhou et al.36 | 2009 | 80 | – | 18.9 | 59 | 6 | ||
| Wittenberg et al.34 | 2010 | 94 | 21 | 4.7 | – | 292 | ||
| Tajbakhsh et al.28 | 2015 | 83.4 | – | 2 | – | 121 | ||
| Huang et al.29 | 2020 | 75 | 81 | – | 77 | 75.9 | 1461 | 369 |
| Weikert et al.31 | 2020 | 92.7 | 95.5 | 0.12 | 86 | 28,000 | 1,465 | |
| Ma et al.37 | 2022 | 86 | 85 | – | – | – | 5,292 | 1,000 |
| Condrea et al.32 | 2024 | 92.9 | 96.1 | 0.15 | – | 91 | 6,133 | 836 |
| Doğan et al.38 | 2024 | 96.2 | 93.4 | – | – | – | 38 | 12 |
Performance comparison of slice-level PE detection methods_ The table summarizes sensitivity, specificity, and AUC values reported in recent studies, showing the evolution of detection capabilities across different architectures and datasets_
| Author | Year | Sensitivity (%) | Specificity (%) | AUC (%) | Train size (scans) | Test size (scans) |
|---|---|---|---|---|---|---|
| RSNA Kaggle Challenge 1st place22 | 2020 | – | – | 96.2 | 7,279 | 2,000 |
| Ajmera et al.18 | 2022 | 93 | 89 | 94 | 853 | 340 |
| Huhtanen et al.39 | 2022 | 86 | 93 | 94 | 600 | 200 |
| Ma et al.37 | 2022 | 86 | 85 | 92.6 | 5,292 | 2,000 |
Performance of PE segmentation Methods_ Results show the progression of segmentation accuracy using the DSC and other relevant metrics_
| Author | Year | DSC | Train size (scans) | Test size (scans) |
|---|---|---|---|---|
| Cano-Espinosa et al.52 | 2020 | 48.5 | 60 | 20 |
| Long et al.40 | 2021 | 74.7 | – | – |
| Liu et al.51** | 2022 | 96.65 | – | – |
| Han et al.53 | 2023 | 86.20 | 11 | 4 |
| Olescki et al.54 | 2023 | 81 | – | – |
| Pu et al.46 WSL* | 2023 | 64.7 | 6,415 | 91 |
| Doğan et al.38 | 2024 | 96.2 | 800 | 216 |
Publicly available PE datasets_ The progression from study-level to voxel-level annotations shows the inverse relationship between annotation detail and dataset size, reflecting the increased annotation effort required for more detailed labels_
| Dataset | Annotation type | Size (scans) |
|---|---|---|
| INSPECT20 | Study-level | 23,248 |
| RadFusion21 | Study-level | 1,794 |
| RSPECT22 | Slice-level | 12,195 |
| RSPECT Augmented23 | Bounding boxes | 445 |
| FUMPE24 | Voxel segmentation | 35 |
| PE-CTA25 | Voxel segmentation | 205 |
Per-embolus localization performance in PE detection_ Note: Direct comparison between methods should be made with caution due to varying evaluation protocols and matching criteria between predicted and ground truth emboli_
| Author | Year | Recall | PPV | F1 | Train size (scans) | Test size (scans) |
|---|---|---|---|---|---|---|
| Özkan et al.44 | 2014 | 95.1 | 52.6 | 67.7 | 142 | 33 |
| Tajbakhsh et al.28 | 2015 | 83.4 | 47.2 | 60.3 | 121 | 20 |
| Tajbakhsh et al.45 | 2019 | 32.9 | 98.6 | 49.4 | 121 | 20 |
| Weikert et al.31 | 2020 | 82.2 | 86.8 | 85.8 | 30,000 | 1,465 |
| Xu et al.42 | 2023 | 93.2 | 51.2 | 66.1 | 113 | – |
| Pu et al.46 WSL* | 2023 | 61.8 | 78.2 | 69.1 | 6,415 | 91 |
| Zhu et al.47 | 2024 | 86 | 61.3 | 71.6 | 142 | 410 |
| Condrea et al.48 WSL* | 2024 | 66.9 | 77.0 | 71.6 | 11329 | 445 |
| Condrea et al.48 Finetune** | 2024 | 73.9 | 77.5 | 75.5 | 111 | 334 |